- +1-315-215-1633
- sales@thebrainyinsights.com

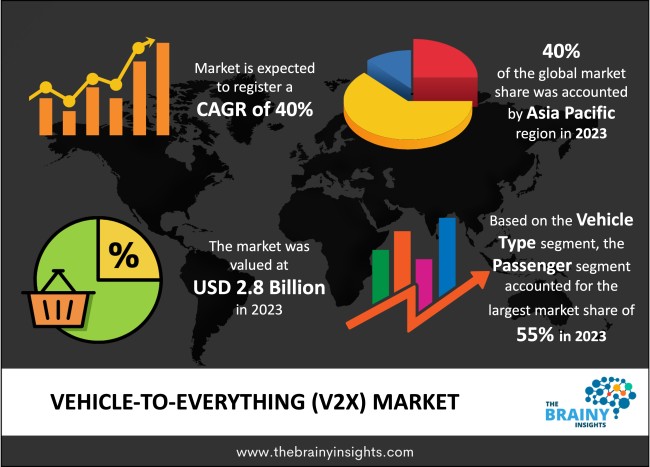
The global vehicle-to-everything (V2X) market was valued at USD 2.8 billion in 2023 and grew at a CAGR of 40% from 2024 to 2033. The market is expected to reach USD 80.99 billion by 2033. The increasing demand for smart urban mobility solutions will drive the growth of the global vehicle-to-everything (V2X) market. This technology enhances the driver's situational awareness, reducing the chances of accidents. This happens because this technology shares various types of information, such as traffic signals, road conditions, and potential dangers. At the same time, it helps reduce pollution and increase the vehicle's efficiency.
Communication between a vehicle and any object that could affect or be affected by it is called "vehicle-to-everything" communication or technology. These systems include parking metres, traffic lights, lane markers, lighting, overhead RFID readers, and cameras. Automobiles communicate in real-time with anything from other automobiles to pedestrians and traffic signals. It also includes sensors, cameras, and wireless connectivity technology. There are several components of V2X, including V2V, V2I, V2P, and V2N communications. V2X technology increases both pedestrian and driver safety. It improves fuel economy and saves both money and time. Using V2X can significantly lower the number of traffic accidents by allowing for the direct exchange of information between infrastructure, pedestrians, and cars. Collision warnings, Blind spots and lane change warnings are features that enable safety on roadways. V2X warns or informs drivers of impending traffic bottlenecks and recommends alternate ways which increase traffic efficiency. Road accident rates can be significantly lowered with the help of V2X technology. For instance, the electrical emergency brake light is used to alert other drivers that a certain car is beginning to brake. Additionally, V2X can quickly and accurately spot vulnerable persons or potential road dangers. With V2X technology in place, it is simpler to create a transportation system that is effective and safe based on real-time data collected by the authorities, which will ultimately lead to cost savings. This will ensure long-term economic gains beyond the automobile industry. V2X also lessens the environmental impact of transportation, which is one of its most important advantages. Additionally, V2X makes driving much more comfortable. Due to such safety benefits, the customer's trust and willingness to use it will increase, which will increase its popularity in the market. This technology can also help in upgrading public transport. Such as no delay in the arrival of vehicles, reliable schedule and accurate communication with each other, which can help in avoiding accidents and troubles.
Get an overview of this study by requesting a free sample
The increasing demand for smart urban mobility solutions – one of the foremost urban problems today is traffic congestion. The lack of proper, well-planned and backed-by-science infrastructure and systems on the road has made urban mobility extremely inefficient. Traffic congestion leads to air pollution, which significantly contributes to carbon emissions and drives climate change. Traffic congestion also increases maintenance costs for the user as more fuel is spent waiting on roads. It decreases fuel efficiency and reduces engine performance and overall lifespan. It wastes time which reduces productivity and causes losses at personal and national levels. It is mentally and physically exhausting and impacts health, which again causes a loss of productivity at a personal and national level. Traffic congestion adds to noise pollution. The lack of infrastructure, smart systems, technologies, and increasing population have all led to increasing traffic in urban centres. This has contributed to air and noise pollution, physical and mental exhaustion, detrimental health and environmental effects and reduced fuel economy. V2X technology is a novel method which utilizes state-of-the-art hardware, software, devices and systems to improve communications between cars, pedestrians, traffic signals and other road infrastructure to facilitate efficient urban mobility. It also improves fuel economy and reduces accidents and carbon emissions. Therefore, the increasing demand for smart technologies to reduce traffic congestion will drive the global vehicle-to-everything market's growth.
The high investment costs – the development and implementation of V2X technology have certain infrastructural requirements. It needs a seamless network and communications technology, smart integrated vehicles and road infrastructure to support it. The development of such infrastructure in countries with the absence of basic road and traffic infrastructure is a distant dream. Therefore, the high investment costs will hamper the market's growth.
The favourable government initiatives – it is the primary duty and function of government to offer the best public utilities for their citizens. With the growing population and rapid urbanization, the demand for improved quality of life has increased globally. Therefore, the government is curating policies and increasing funding to develop smart cities with novel technologies like V2X integrated into the urban mobility infrastructure, thereby offering the residents the best quality of public utilities. Using V2X also enables the government to achieve its other sustainability and environmental conservation goals. It also improves productivity by saving time and ensuring a healthy environment for the citizenry. Therefore, favourable government initiatives will augment the global vehicle-to-everything market's growth and development in the forecast period.
The regions analyzed for the market include North America, Europe, South America, Asia Pacific, the Middle East, and Africa. Asia Pacific emerged as the largest global vehicle-to-everything (V2X) market, with a 40% market revenue share in 2023.
Asia Pacific region will account for the largest market share with revenue growth. China and India are the most populated countries, with rapid urbanization happening domestically as disposable incomes rise. Given its dismal road infrastructure, India also tops the list of deaths due to road accidents. Therefore, the Asia Pacific needs V2X technology to improve road safety and fuel economy and reduce carbon emissions. Japan and China contribute to the technology, while China and India offer the necessary consumer market, thereby driving the region's growth.
Asia Pacific Region Vehicle-to-Everything (V2X) Market Share in 2023 - 40%
www.thebrainyinsights.com
Check the geographical analysis of this market by requesting a free sample
The communication type segment is divided into vehicle-to-vehicle (V2V), vehicle-to-pedestrian (V2P), vehicle-to-cloud (V2C), vehicle-to-infrastructure (V2I), vehicle-to-grid (V2G), vehicle-to-network (V2N), and vehicle-to-device (V2D). The vehicle-to-vehicle segment dominated the market, with a market share of around 34% in 2023. Vehicle-to-vehicle or V2V, as the name suggests, is the ability of a vehicle to communicate with other vehicles in the vicinity. It is an easy application, given the growing demand for smart cars. The technology can communicate details like speed and location to nearby vehicles through wireless technology. The real-time exchange of these details helps avoid traffic congestion and collisions and improves transport efficiency.
The vehicle type segment is divided into passenger and commercial. The passenger segment dominated the market, with a market share of around 55% in 2023. They form the most significant part of active traffic on roads, thereby contributing to its rising dominance in the segment. Furthermore, given the rising disposable income, the increasing demand for smart cars with V2X technologies is also driving the segment's growth.
The connectivity segment is divided into dedicated short-range communication (DSRC) and cellular. The dedicated short-range communication segment dominated the market, with a market share of around 59% in 2023. dedicated short-range communications allow for direct wireless data interchange in the V2X technology. It has low latency, which enables faster real-time communication. It is dependable, reliable, and allows interoperability. It is also highly secure, which increases its applications.
The application segment is divided into automated driver assistance, emergency vehicle notification, fleet and asset management, line of sight, backing, intelligent traffic systems, passenger information systems, parking management systems, non-line of sight and others. The automated driver assistance segment dominated the market, with a market share of around 27% in 2023. Automated driver assistance systems improve auto and road safety by providing a secure human-machine interface. The technology uses cameras and sensors to recognise surrounding barriers and driving faults, which is followed by the necessary mitigative action. It reduces accidents and collisions and prevents fatalities and injuries. It has several features, including automatic emergency braking, pedestrian detection, surround view, parking assist, driver fatigue detection, and gaze detection.
| Attribute | Description |
|---|---|
| Market Size | Revenue (USD Billion) |
| Market size value in 2023 | USD 2.8 Billion |
| Market size value in 2033 | USD 80.99 Billion |
| CAGR (2024 to 2033) | 40% |
| Historical data | 2020-2022 |
| Base Year | 2023 |
| Forecast | 2024-2033 |
| Region | The regions analyzed for the market are Asia Pacific, Europe, South America, North America, and Middle East & Africa. Furthermore, the regions are further analyzed at the country level. |
| Segments | Communication Type, Vehicle Type, Connectivity and Application |
As per The Brainy Insights, the size of the global vehicle-to-everything (V2X) market was valued at USD 2.8 billion in 2023 to USD 80.99 billion by 2033.
Global vehicle-to-everything (V2X) market is growing at a CAGR of 40% during the forecast period 2024-2033.
The market's growth will be influenced by the increasing demand for smart urban mobility solutions.
The high investments costs could hamper the market growth.
1. Introduction
1.1. Objectives of the Study
1.2. Market Definition
1.3. Research Scope
1.4. Currency
1.5. Key Target Audience
2. Research Methodology and Assumptions
3. Executive Summary
4. Premium Insights
4.1. Porter’s Five Forces Analysis
4.2. Value Chain Analysis
4.3. Top Investment Pockets
4.3.1. Market Attractiveness Analysis by Communication Type
4.3.2. Market Attractiveness Analysis by Vehicle Type
4.3.3. Market Attractiveness Analysis by Connectivity
4.3.4. Market Attractiveness Analysis by Application
4.3.5. Market Attractiveness Analysis by Region
4.4. Industry Trends
5. Market Dynamics
5.1. Market Evaluation
5.2. Drivers
5.2.1. The increasing demand for smart urban mobility solutions
5.3. Restraints
5.3.1. The high investments costs
5.4. Opportunities
5.4.1. The favorable government initiatives
5.5. Challenges
5.5.1. The high risk of cyberattacks
6. Global Vehicle-to-Everything (V2X) Market Analysis and Forecast, By Communication Type
6.1. Segment Overview
6.2. Vehicle-to-Vehicle (V2V)
6.3. Vehicle-to-Pedestrian (V2P)
6.4. Vehicle-to-Cloud (V2C)
6.5. Vehicle-to-Infrastructure (V2I)
6.6. Vehicle-to-Grid (V2G)
6.7. Vehicle-to-Network (V2N)
6.8. Vehicle-to-Device (V2D)
7. Global Vehicle-to-Everything (V2X) Market Analysis and Forecast, By Vehicle Type
7.1. Segment Overview
7.2. Passenger
7.3. Commercial
8. Global Vehicle-to-Everything (V2X) Market Analysis and Forecast, By Connectivity
8.1. Segment Overview
8.2. Dedicated Short-Range Communication (DSRC)
8.3. Cellular
9. Global Vehicle-to-Everything (V2X) Market Analysis and Forecast, By Application
9.1. Segment Overview
9.2. Automated Driver Assistance
9.3. Emergency Vehicle Notification
9.4. Fleet and Asset Management
9.5. Line of Sight
9.6. Backing
9.7. Intelligent Traffic Systems
9.8. Passenger Information Systems
9.9. Parking Management Systems
9.10. Non-Line of Sight
9.11. Others
10. Global Vehicle-to-Everything (V2X) Market Analysis and Forecast, By Regional Analysis
10.1. Segment Overview
10.2. North America
10.2.1. U.S.
10.2.2. Canada
10.2.3. Mexico
10.3. Europe
10.3.1. Germany
10.3.2. France
10.3.3. U.K.
10.3.4. Italy
10.3.5. Spain
10.4. Asia-Pacific
10.4.1. Japan
10.4.2. China
10.4.3. India
10.5. South America
10.5.1. Brazil
10.6. Middle East and Africa
10.6.1. UAE
10.6.2. South Africa
11. Global Vehicle-to-Everything (V2X) Market-Competitive Landscape
11.1. Overview
11.2. Market Share of Key Players in the Vehicle-to-Everything (V2X) Market
11.2.1. Global Company Market Share
11.2.2. North America Company Market Share
11.2.3. Europe Company Market Share
11.2.4. APAC Company Market Share
11.3. Competitive Situations and Trends
11.3.1. Product Launches and Developments
11.3.2. Partnerships, Collaborations, and Agreements
11.3.3. Mergers & Acquisitions
11.3.4. Expansions
12. Company Profiles
12.1. Arada Systems Inc.
12.1.1. Business Overview
12.1.2. Company Snapshot
12.1.3. Company Market Share Analysis
12.1.4. Company Product Portfolio
12.1.5. Recent Developments
12.1.6. SWOT Analysis
12.2. Autotalks Ltd.
12.2.1. Business Overview
12.2.2. Company Snapshot
12.2.3. Company Market Share Analysis
12.2.4. Company Product Portfolio
12.2.5. Recent Developments
12.2.6. SWOT Analysis
12.3. Cisco Systems Inc.
12.3.1. Business Overview
12.3.2. Company Snapshot
12.3.3. Company Market Share Analysis
12.3.4. Company Product Portfolio
12.3.5. Recent Developments
12.3.6. SWOT Analysis
12.4. Cohda Wireless Pty
12.4.1. Business Overview
12.4.2. Company Snapshot
12.4.3. Company Market Share Analysis
12.4.4. Company Product Portfolio
12.4.5. Recent Developments
12.4.6. SWOT Analysis
12.5. Continental AG
12.5.1. Business Overview
12.5.2. Company Snapshot
12.5.3. Company Market Share Analysis
12.5.4. Company Product Portfolio
12.5.5. Recent Developments
12.5.6. SWOT Analysis
12.6. Delphi Automotive PLC
12.6.1. Business Overview
12.6.2. Company Snapshot
12.6.3. Company Market Share Analysis
12.6.4. Company Product Portfolio
12.6.5. Recent Developments
12.6.6. SWOT Analysis
12.7. Denso Corporation
12.7.1. Business Overview
12.7.2. Company Snapshot
12.7.3. Company Market Share Analysis
12.7.4. Company Product Portfolio
12.7.5. Recent Developments
12.7.6. SWOT Analysis
12.8. Infineon Technologies AG
12.8.1. Business Overview
12.8.2. Company Snapshot
12.8.3. Company Market Share Analysis
12.8.4. Company Product Portfolio
12.8.5. Recent Developments
12.8.6. SWOT Analysis
12.9. Qualcomm Incorporated
12.9.1. Business Overview
12.9.2. Company Snapshot
12.9.3. Company Market Share Analysis
12.9.4. Company Product Portfolio
12.9.5. Recent Developments
12.9.6. SWOT Analysis
12.10. Toyota Motor Corporation
12.10.1. Business Overview
12.10.2. Company Snapshot
12.10.3. Company Market Share Analysis
12.10.4. Company Product Portfolio
12.10.5. Recent Developments
12.10.6. SWOT Analysis
List of Table
1. Global Vehicle-to-Everything (V2X) Market, By Communication Type, 2020-2033 (USD Billion)
2. Global Vehicle-to-Vehicle (V2V) Vehicle-to-Everything (V2X) Market, By Region, 2020-2033 (USD Billion)
3. Global Vehicle-to-Pedestrian (V2P) Vehicle-to-Everything (V2X) Market, By Region, 2020-2033 (USD Billion)
4. Global Vehicle-to-Cloud (V2C) Vehicle-to-Everything (V2X) Market, By Region, 2020-2033 (USD Billion)
5. Global Vehicle-to-Infrastructure (V2I) Vehicle-to-Everything (V2X) Market, By Region, 2020-2033 (USD Billion)
6. Global Vehicle-to-Grid (V2G) Vehicle-to-Everything (V2X) Market, By Region, 2020-2033 (USD Billion)
7. Global Vehicle-to-Network (V2N) Vehicle-to-Everything (V2X) Market, By Region, 2020-2033 (USD Billion)
8. Global Vehicle-to-Device (V2D) Vehicle-to-Everything (V2X) Market, By Region, 2020-2033 (USD Billion)
9. Global Vehicle-to-Everything (V2X) Market, By Vehicle Type, 2020-2033 (USD Billion)
10. Global Passenger Vehicle-to-Everything (V2X) Market, By Region, 2020-2033 (USD Billion)
11. Global Commercial Vehicle-to-Everything (V2X) Market, By Region, 2020-2033 (USD Billion)
12. Global Vehicle-to-Everything (V2X) Market, By Connectivity, 2020-2033 (USD Billion)
13. Global Dedicated Short-Range Communication (DSRC) Vehicle-to-Everything (V2X) Market, By Region, 2020-2033 (USD Billion)
14. Global Cellular Vehicle-to-Everything (V2X) Market, By Region, 2020-2033 (USD Billion)
15. Global Vehicle-to-Everything (V2X) Market, By Application, 2020-2033 (USD Billion)
16. Global Automated Driver Assistance Vehicle-to-Everything (V2X) Market, By Region, 2020-2033 (USD Billion)
17. Global Emergency Vehicle Notification Vehicle-to-Everything (V2X) Market, By Region, 2020-2033 (USD Billion)
18. Global Fleet and Asset Management Vehicle-to-Everything (V2X) Market, By Region, 2020-2033 (USD Billion)
19. Global Line of Sight Vehicle-to-Everything (V2X) Market, By Region, 2020-2033 (USD Billion)
20. Global Backing Vehicle-to-Everything (V2X) Market, By Region, 2020-2033 (USD Billion)
21. Global Intelligent Traffic Systems Vehicle-to-Everything (V2X) Market, By Region, 2020-2033 (USD Billion)
22. Global Passenger Information Systems Vehicle-to-Everything (V2X) Market, By Region, 2020-2033 (USD Billion)
23. Global Parking Management Systems Vehicle-to-Everything (V2X) Market, By Region, 2020-2033 (USD Billion)
24. Global Non-Line of Sight Vehicle-to-Everything (V2X) Market, By Region, 2020-2033 (USD Billion)
25. Global Others Vehicle-to-Everything (V2X) Market, By Region, 2020-2033 (USD Billion)
26. Global Vehicle-to-Everything (V2X) Market, By Region, 2020-2033 (USD Billion)
27. North America Vehicle-to-Everything (V2X) Market, By Communication Type, 2020-2033 (USD Billion)
28. North America Vehicle-to-Everything (V2X) Market, By Vehicle Type, 2020-2033 (USD Billion)
29. North America Vehicle-to-Everything (V2X) Market, By Connectivity, 2020-2033 (USD Billion)
30. North America Vehicle-to-Everything (V2X) Market, By Application, 2020-2033 (USD Billion)
31. U.S. Vehicle-to-Everything (V2X) Market, By Communication Type, 2020-2033 (USD Billion)
32. U.S. Vehicle-to-Everything (V2X) Market, By Vehicle Type, 2020-2033 (USD Billion)
33. U.S. Vehicle-to-Everything (V2X) Market, By Connectivity, 2020-2033 (USD Billion)
34. U.S. Vehicle-to-Everything (V2X) Market, By Application, 2020-2033 (USD Billion)
35. Canada Vehicle-to-Everything (V2X) Market, By Communication Type, 2020-2033 (USD Billion)
36. Canada Vehicle-to-Everything (V2X) Market, By Vehicle Type, 2020-2033 (USD Billion)
37. Canada Vehicle-to-Everything (V2X) Market, By Connectivity, 2020-2033 (USD Billion)
38. Canada Vehicle-to-Everything (V2X) Market, By Application, 2020-2033 (USD Billion)
39. Mexico Vehicle-to-Everything (V2X) Market, By Communication Type, 2020-2033 (USD Billion)
40. Mexico Vehicle-to-Everything (V2X) Market, By Vehicle Type, 2020-2033 (USD Billion)
41. Mexico Vehicle-to-Everything (V2X) Market, By Connectivity, 2020-2033 (USD Billion)
42. Mexico Vehicle-to-Everything (V2X) Market, By Application, 2020-2033 (USD Billion)
43. Europe Vehicle-to-Everything (V2X) Market, By Communication Type, 2020-2033 (USD Billion)
44. Europe Vehicle-to-Everything (V2X) Market, By Vehicle Type, 2020-2033 (USD Billion)
45. Europe Vehicle-to-Everything (V2X) Market, By Connectivity, 2020-2033 (USD Billion)
46. Europe Vehicle-to-Everything (V2X) Market, By Application, 2020-2033 (USD Billion)
47. Germany Vehicle-to-Everything (V2X) Market, By Communication Type, 2020-2033 (USD Billion)
48. Germany Vehicle-to-Everything (V2X) Market, By Vehicle Type, 2020-2033 (USD Billion)
49. Germany Vehicle-to-Everything (V2X) Market, By Connectivity, 2020-2033 (USD Billion)
50. Germany Vehicle-to-Everything (V2X) Market, By Application, 2020-2033 (USD Billion)
51. France Vehicle-to-Everything (V2X) Market, By Communication Type, 2020-2033 (USD Billion)
52. France Vehicle-to-Everything (V2X) Market, By Vehicle Type, 2020-2033 (USD Billion)
53. France Vehicle-to-Everything (V2X) Market, By Connectivity, 2020-2033 (USD Billion)
54. France Vehicle-to-Everything (V2X) Market, By Application, 2020-2033 (USD Billion)
55. U.K. Vehicle-to-Everything (V2X) Market, By Communication Type, 2020-2033 (USD Billion)
56. U.K. Vehicle-to-Everything (V2X) Market, By Vehicle Type, 2020-2033 (USD Billion)
57. U.K. Vehicle-to-Everything (V2X) Market, By Connectivity, 2020-2033 (USD Billion)
58. U.K. Vehicle-to-Everything (V2X) Market, By Application, 2020-2033 (USD Billion)
59. Italy Vehicle-to-Everything (V2X) Market, By Communication Type, 2020-2033 (USD Billion)
60. Italy Vehicle-to-Everything (V2X) Market, By Vehicle Type, 2020-2033 (USD Billion)
61. Italy Vehicle-to-Everything (V2X) Market, By Connectivity, 2020-2033 (USD Billion)
62. Italy Vehicle-to-Everything (V2X) Market, By Application, 2020-2033 (USD Billion)
63. Spain Vehicle-to-Everything (V2X) Market, By Communication Type, 2020-2033 (USD Billion)
64. Spain Vehicle-to-Everything (V2X) Market, By Vehicle Type, 2020-2033 (USD Billion)
65. Spain Vehicle-to-Everything (V2X) Market, By Connectivity, 2020-2033 (USD Billion)
66. Spain Vehicle-to-Everything (V2X) Market, By Application, 2020-2033 (USD Billion)
67. Asia Pacific Vehicle-to-Everything (V2X) Market, By Communication Type, 2020-2033 (USD Billion)
68. Asia Pacific Vehicle-to-Everything (V2X) Market, By Vehicle Type, 2020-2033 (USD Billion)
69. Asia Pacific Vehicle-to-Everything (V2X) Market, By Connectivity, 2020-2033 (USD Billion)
70. Asia Pacific Vehicle-to-Everything (V2X) Market, By Application, 2020-2033 (USD Billion)
71. Japan Vehicle-to-Everything (V2X) Market, By Communication Type, 2020-2033 (USD Billion)
72. Japan Vehicle-to-Everything (V2X) Market, By Vehicle Type, 2020-2033 (USD Billion)
73. Japan Vehicle-to-Everything (V2X) Market, By Connectivity, 2020-2033 (USD Billion)
74. Japan Vehicle-to-Everything (V2X) Market, By Application, 2020-2033 (USD Billion)
75. China Vehicle-to-Everything (V2X) Market, By Communication Type, 2020-2033 (USD Billion)
76. China Vehicle-to-Everything (V2X) Market, By Vehicle Type, 2020-2033 (USD Billion)
77. China Vehicle-to-Everything (V2X) Market, By Connectivity, 2020-2033 (USD Billion)
78. China Vehicle-to-Everything (V2X) Market, By Application, 2020-2033 (USD Billion)
79. India Vehicle-to-Everything (V2X) Market, By Communication Type, 2020-2033 (USD Billion)
80. India Vehicle-to-Everything (V2X) Market, By Vehicle Type, 2020-2033 (USD Billion)
81. India Vehicle-to-Everything (V2X) Market, By Connectivity, 2020-2033 (USD Billion)
82. India Vehicle-to-Everything (V2X) Market, By Application, 2020-2033 (USD Billion)
83. South America Vehicle-to-Everything (V2X) Market, By Communication Type, 2020-2033 (USD Billion)
84. South America Vehicle-to-Everything (V2X) Market, By Vehicle Type, 2020-2033 (USD Billion)
85. South America Vehicle-to-Everything (V2X) Market, By Connectivity, 2020-2033 (USD Billion)
86. South America Vehicle-to-Everything (V2X) Market, By Application, 2020-2033 (USD Billion)
87. Brazil Vehicle-to-Everything (V2X) Market, By Communication Type, 2020-2033 (USD Billion)
88. Brazil Vehicle-to-Everything (V2X) Market, By Vehicle Type, 2020-2033 (USD Billion)
89. Brazil Vehicle-to-Everything (V2X) Market, By Connectivity, 2020-2033 (USD Billion)
90. Brazil Vehicle-to-Everything (V2X) Market, By Application, 2020-2033 (USD Billion)
91. Middle East and Africa Vehicle-to-Everything (V2X) Market, By Communication Type, 2020-2033 (USD Billion)
92. Middle East and Africa Vehicle-to-Everything (V2X) Market, By Vehicle Type, 2020-2033 (USD Billion)
93. Middle East and Africa Vehicle-to-Everything (V2X) Market, By Connectivity, 2020-2033 (USD Billion)
94. Middle East and Africa Vehicle-to-Everything (V2X) Market, By Application, 2020-2033 (USD Billion)
95. UAE Vehicle-to-Everything (V2X) Market, By Communication Type, 2020-2033 (USD Billion)
96. UAE Vehicle-to-Everything (V2X) Market, By Vehicle Type, 2020-2033 (USD Billion)
97. UAE Vehicle-to-Everything (V2X) Market, By Connectivity, 2020-2033 (USD Billion)
98. UAE Vehicle-to-Everything (V2X) Market, By Application, 2020-2033 (USD Billion)
99. South Africa Vehicle-to-Everything (V2X) Market, By Communication Type, 2020-2033 (USD Billion)
100. South Africa Vehicle-to-Everything (V2X) Market, By Vehicle Type, 2020-2033 (USD Billion)
101. South Africa Vehicle-to-Everything (V2X) Market, By Connectivity, 2020-2033 (USD Billion)
102. South Africa Vehicle-to-Everything (V2X) Market, By Application, 2020-2033 (USD Billion)
List of Figures
1. Global Vehicle-to-Everything (V2X) Market Segmentation
2. Vehicle-to-Everything (V2X) Market: Research Methodology
3. Market Size Estimation Methodology: Bottom-Up Approach
4. Market Size Estimation Methodology: Top-Down Approach
5. Data Triangulation
6. Porter’s Five Forces Analysis
7. Value Chain Analysis
8. Global Vehicle-to-Everything (V2X) Market Attractiveness Analysis by Communication Type
9. Global Vehicle-to-Everything (V2X) Market Attractiveness Analysis by Vehicle Type
10. Global Vehicle-to-Everything (V2X) Market Attractiveness Analysis by Connectivity
11. Global Vehicle-to-Everything (V2X) Market Attractiveness Analysis by Application
12. Global Vehicle-to-Everything (V2X) Market Attractiveness Analysis by Region
13. Global Vehicle-to-Everything (V2X) Market: Dynamics
14. Global Vehicle-to-Everything (V2X) Market Share by Communication Type (2023 & 2033)
15. Global Vehicle-to-Everything (V2X) Market Share by Vehicle Type (2023 & 2033)
16. Global Vehicle-to-Everything (V2X) Market Share by Connectivity (2023 & 2033)
17. Global Vehicle-to-Everything (V2X) Market Share by Application (2023 & 2033)
18. Global Vehicle-to-Everything (V2X) Market Share by Regions (2023 & 2033)
19. Global Vehicle-to-Everything (V2X) Market Share by Company (2023)
This study forecasts revenue at global, regional, and country levels from 2019 to 2032. The Brainy Insights has segmented the global vehicle-to-everything (V2X) market based on below mentioned segments:
Global Vehicle-to-Everything (V2X) Market by Communication Type:
Global Vehicle-to-Everything (V2X) Market by Vehicle Type:
Global Vehicle-to-Everything (V2X) Market by Connectivity:
Global Vehicle-to-Everything (V2X) Market by Application:
Global Vehicle-to-Everything (V2X) Market by Region:
Research has its special purpose to undertake marketing efficiently. In this competitive scenario, businesses need information across all industry verticals; the information about customer wants, market demand, competition, industry trends, distribution channels etc. This information needs to be updated regularly because businesses operate in a dynamic environment. Our organization, The Brainy Insights incorporates scientific and systematic research procedures in order to get proper market insights and industry analysis for overall business success. The analysis consists of studying the market from a miniscule level wherein we implement statistical tools which helps us in examining the data with accuracy and precision.
Our research reports feature both; quantitative and qualitative aspects for any market. Qualitative information for any market research process are fundamental because they reveal the customer needs and wants, usage and consumption for any product/service related to a specific industry. This in turn aids the marketers/investors in knowing certain perceptions of the customers. Qualitative research can enlighten about the different product concepts and designs along with unique service offering that in turn, helps define marketing problems and generate opportunities. On the other hand, quantitative research engages with the data collection process through interviews, e-mail interactions, surveys and pilot studies. Quantitative aspects for the market research are useful to validate the hypotheses generated during qualitative research method, explore empirical patterns in the data with the help of statistical tools, and finally make the market estimations.
The Brainy Insights offers comprehensive research and analysis, based on a wide assortment of factual insights gained through interviews with CXOs and global experts and secondary data from reliable sources. Our analysts and industry specialist assume vital roles in building up statistical tools and analysis models, which are used to analyse the data and arrive at accurate insights with exceedingly informative research discoveries. The data provided by our organization have proven precious to a diverse range of companies, facilitating them to address issues such as determining which products/services are the most appealing, whether or not customers use the product in the manner anticipated, the purchasing intentions of the market and many others.
Our research methodology encompasses an idyllic combination of primary and secondary initiatives. Key phases involved in this process are listed below:

The phase involves the gathering and collecting of market data and its related information with the help of different sources & research procedures.

The data procurement stage involves in data gathering and collecting through various data sources.
This stage involves in extensive research. These data sources includes:
Purchased Database: Purchased databases play a crucial role in estimating the market sizes irrespective of the domain. Our purchased database includes:
Primary Research: The Brainy Insights interacts with leading companies and experts of the concerned domain to develop the analyst team’s market understanding and expertise. It improves and substantiates every single data presented in the market reports. Primary research mainly involves in telephonic interviews, E-mail interactions and face-to-face interviews with the raw material providers, manufacturers/producers, distributors, & independent consultants. The interviews that we conduct provides valuable data on market size and industry growth trends prevailing in the market. Our organization also conducts surveys with the various industry experts in order to gain overall insights of the industry/market. For instance, in healthcare industry we conduct surveys with the pharmacists, doctors, surgeons and nurses in order to gain insights and key information of a medical product/device/equipment which the customers are going to usage. Surveys are conducted in the form of questionnaire designed by our own analyst team. Surveys plays an important role in primary research because surveys helps us to identify the key target audiences of the market. Additionally, surveys helps to identify the key target audience engaged with the market. Our survey team conducts the survey by targeting the key audience, thus gaining insights from them. Based on the perspectives of the customers, this information is utilized to formulate market strategies. Moreover, market surveys helps us to understand the current competitive situation of the industry. To be precise, our survey process typically involve with the 360 analysis of the market. This analytical process begins by identifying the prospective customers for a product or service related to the market/industry to obtain data on how a product/service could fit into customers’ lives.

Secondary Research: The secondary data sources includes information published by the on-profit organizations such as World bank, WHO, company fillings, investor presentations, annual reports, national government documents, statistical databases, blogs, articles, white papers and others. From the annual report, we analyse a company’s revenue to understand the key segment and market share of that organization in a particular region. We analyse the company websites and adopt the product mapping technique which is important for deriving the segment revenue. In the product mapping method, we select and categorize the products offered by the companies catering to domain specific market, deduce the product revenue for each of the companies so as to get overall estimation of the market size. We also source data and analyses trends based on information received from supply side and demand side intermediaries in the value chain. The supply side denotes the data gathered from supplier, distributor, wholesaler and the demand side illustrates the data gathered from the end customers for respective market domain.

The supply side for a domain specific market is analysed by:
The demand side for the market is estimated through:
In-house Library: Apart from these third-party sources, we have our in-house library of qualitative and quantitative information. Our in-house database includes market data for various industry and domains. These data are updated on regular basis as per the changing market scenario. Our library includes, historic databases, internal audit reports and archives.
Sometimes there are instances where there is no metadata or raw data available for any domain specific market. For those cases, we use our expertise to forecast and estimate the market size in order to generate comprehensive data sets. Our analyst team adopt a robust research technique in order to produce the estimates:
Data Synthesis: This stage involves the analysis & mapping of all the information obtained from the previous step. It also involves in scrutinizing the data for any discrepancy observed while data gathering related to the market. The data is collected with consideration to the heterogeneity of sources. Robust scientific techniques are in place for synthesizing disparate data sets and provide the essential contextual information that can orient market strategies. The Brainy Insights has extensive experience in data synthesis where the data passes through various stages:


Market Deduction & Formulation: The final stage comprises of assigning data points at appropriate market spaces so as to deduce feasible conclusions. Analyst perspective & subject matter expert based holistic form of market sizing coupled with industry analysis also plays a crucial role in this stage.
This stage involves in finalization of the market size and numbers that we have collected from data integration step. With data interpolation, it is made sure that there is no gap in the market data. Successful trend analysis is done by our analysts using extrapolation techniques, which provide the best possible forecasts for the market.
Data Validation & Market Feedback: Validation is the most important step in the process. Validation & re-validation via an intricately designed process helps us finalize data-points to be used for final calculations.

The Brainy Insights interacts with leading companies and experts of the concerned domain to develop the analyst team’s market understanding and expertise. It improves and substantiates every single data presented in the market reports. The data validation interview and discussion panels are typically composed of the most experienced industry members. The participants include, however, are not limited to:
Moreover, we always validate our data and findings through primary respondents from all the major regions we are working on.


Free Customization
Fortune 500 Clients
Free Yearly Update On Purchase Of Multi/Corporate License
Companies Served Till Date