- +1-315-215-1633
- sales@thebrainyinsights.com

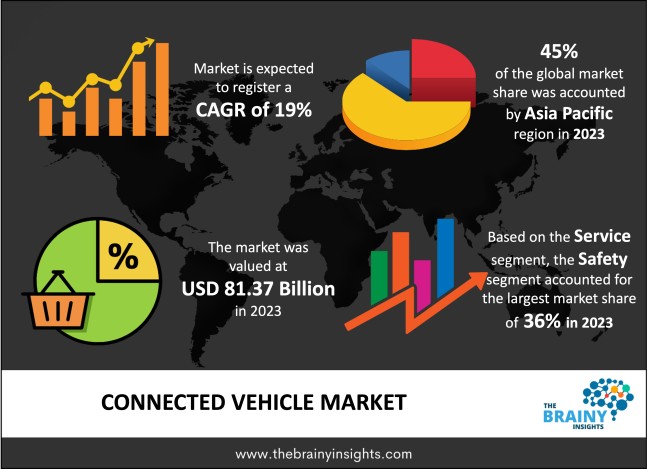
The global connected vehicle market is expected to reach USD 463.38 billion by 2033, at a CAGR of 19% during the forecast period 2024 to 2033. North America is expected to grow the fastest during the forecast period. Developments in connectivity technology, such as the integration of 5G, will make it even easier for Connected Vehicles to grow. 5G networks provide high speed and low latency in connectivity, which makes it easier to do real-time monitoring and analysis.
A connected vehicle is equipped with cutting-edge technology and is linked to the Internet, allowing it to communicate with other vehicles and infrastructure. Because they have internet access, these connected vehicles can interact wirelessly. A hotspot from an external device or a permanently installed connection module with an integrated SIM card offers Internet to the vehicle. These linked automobiles provide a safer and more secure alternative to conventional vehicles due to their ability to measure distance, speed, and other factors. Vehicle-to-vehicle connectivity, vehicle-to-infrastructure, vehicle-to-pedestrian, vehicle-to-cloud, and vehicle-to-everything are the communication technologies that increase safety, vehicle efficiency, and commute times. The connected automobile also supplies remote parking solutions, route guidance, and better infotainment options due to the vehicle's efficient communication with traffic signals. Apple Inc., Google Inc., and Baidu Inc. are a few businesses entering the connected automobile market, delivering superior technology and outstanding safety of IoT-enabled cars. Connected Vehicles can help start services like ride-sharing. This will reduce traffic, congestion, and pollution. It can also remove the shortcomings in autonomous driving because it provides real-time data, which can make autonomous driving even better and more reliable.
Get an overview of this study by requesting a free sample
Rising Need for Vehicle Safety- The increased need for improved vehicle safety to decrease road accidents is expected to assist market expansion during the predicted period. According to UN data, around 1.3 million people die in traffic accidents yearly, with an additional 20-50 million injured. In this context, linked vehicle technology connects surrounding digital devices with the car to provide the driver with information such as the density of pedestrians or two-wheelers ahead of the route. Furthermore, consumers' growing reliance on technology leads them to purchase automobiles with connectivity capabilities, such as those that allow them to listen to music streaming apps or audiobooks while driving or to answer a phone call while on the road safely. Furthermore, this technology is expected to assist in alleviating traffic congestion and delays by diverting oncoming vehicles away from high-traffic locations. These elements are projected to contribute to market expansion in the coming years.
Cyber Attacks- The vulnerability to cyber-attacks is a significant factor impeding the expansion of the connected vehicle market. The rise of the connected vehicle market is projected to be stymied by improvements in global vehicle rules and the high maintenance cost of modern suspension systems.
Rising Safety Standards- The industry is seeing a significant increase in the integration of modern safety and comfort features in vehicles, such as advanced driver assistance systems, vehicle infotainment, and many others. Furthermore, the growing acceptability of self-driving or automated vehicles contributes to the market's increased growth.
High Cost of Raw Materials- The rise of the connected vehicle market is projected to be hampered by the rising high cost of raw materials.
The regions analyzed for the market include North America, Europe, South America, Asia Pacific, the Middle East, and Africa. Asia Pacific emerged as the most significant global connected vehicle market, with a 45% market revenue share in 2023.
Asia Pacific dominates the connected vehicle market, with a 45% market revenue share in 2023. The surge in demand for digital features in automobiles, particularly in developing nations such as China and India, is expected to fuel the region's connected vehicle market. China is one of the world's major automotive marketplaces, with more than 21.48 million passenger cars delivered in 2021, representing a 6% increase over 2020 sales. Despite the pandemic, China remains one of the significant vehicle buyers, providing excellent potential for predictive technology to establish itself in the Chinese automobile market.
Asia Pacific Region Connected Vehicle Market Share in 2023 - 45%
www.thebrainyinsights.com
Check the geographical analysis of this market by requesting a free sample
North America is expected to witness the fastest growth during the forecast period. Investment firms are providing cash to leading connected vehicle developers to encourage the adoption of cybersecurity in connected automobiles. This is included to ensure secure data transport. In addition, prominent automakers are introducing new autonomous, connected vehicles to improve the driving experience. Top American companies have evolved to deliver better and more efficient connected vehicle services, expanding the North American connected vehicle market. Furthermore, introducing advanced features such as ADAS has enabled vehicle makers to provide connected vehicle services, resulting in market development across North America.
The service segment is divided into driver assistance, safety, entertainment, well-being, vehicle management, and mobility management. The safety segment dominated the market, with a market share of around 36% in 2023. Various telecommunications providers and international automakers work together to enhance connected vehicle technology while putting road safety first. For example, the Vodafone Group and Jaguar Land Rover demonstrated the new C-V2X technology, a cellular vehicle-to-everything connected technology, in conjunction with Huawei Technologies Co., Ltd., to optimize road safety requirements. Adopting technology to improve vehicle safety accelerates the development of connected vehicles with safety features.
The vehicle segment is divided into passenger cars, autonomous cars, and commercial vehicles. The autonomous cars segment dominated the market, with a market share of around 45% in 2023. Autonomous and connected vehicles are gaining popularity among consumers and are expected to achieve wider acceptability over the predicted period. The advanced driving assistance systems (ADAS) on display are intended to close the gap between today's vehicles and those of tomorrow. Furthermore, with increased technological breakthroughs in the automobile industry, end customers are willing to pay more for the latest technology that improves the driving experience and promotes driver and rider safety. ADAS technologies such as collision warning, blind spot recognition, lane assistance, and so on have a substantial impact on consumer behaviour. They are projected to improve vehicle performance by minimizing vehicle downtime and informing the owner of vehicle issues.
| Attribute | Description |
|---|---|
| Market Size | Revenue (USD Billion) |
| Market size value in 2023 | USD 81.37 billion |
| Market size value in 2033 | USD 463.38 billion |
| CAGR (2024 to 2033) | 19% |
| Historical data | 2020-2022 |
| Base Year | 2023 |
| Forecast | 2024-2033 |
| Regional Segments | North America, Asia Pacific, Europe, Latin America, Middle East and Africa |
| Segments | Service, Vehicle |
As per The Brainy Insights, the size of the connected vehicle market was valued at USD 81.37 billion in 2023 to USD 463.38 billion by 2033.
The global connected vehicle market is growing at a CAGR of 19% during the forecast period 2024-2033.
Asia Pacific emerged as the largest connected vehicle market.
Key players in the connected vehicle market are Bosch, Delphi Technologies PLC, Harman International Industries, Inc., Infineon Technologies AG, NXP Semiconductors N.V., Toyota Motor Corporation, Valeo, ZF Friedrichshafen AG, and BorgWarner.
1. Introduction
1.1. Objectives of the Study
1.2. Market Definition
1.3. Research Scope
1.4. Currency
1.5. Key Target Audience
2. Research Methodology and Assumptions
3. Executive Summary
4. Premium Insights
4.1. Porter’s Five Forces Analysis
4.2. Value Chain Analysis
4.3. Top Investment Pockets
4.3.1. Market Attractiveness Analysis by Service
4.3.2. Market Attractiveness Analysis by Vehicle
4.3.3. Market Attractiveness Analysis by Region
4.4. Industry Trends
5. Market Dynamics
5.1. Market Evaluation
5.2. Drivers
5.2.1. Rising Need for Vehicle Safety
5.3. Restraints
5.3.1. Cyber Attacks
5.4. Opportunities
5.4.1. Rising Safety Standards
5.5. Challenges
5.5.1. High Cost of Raw Materials
6. Global Connected Vehicle Market Analysis and Forecast, By Service
6.1. Segment Overview
6.2. Driver Assistance
6.3. Safety
6.4. Entertainment
6.5. Well-Being
6.6. Vehicle Management
6.7. Mobility Management
7. Global Connected Vehicle Market Analysis and Forecast, By Vehicle
7.1. Segment Overview
7.2. Passenger Cars
7.3. Autonomous Cars
7.4. Commercial Vehicle
8. Global Connected Vehicle Market Analysis and Forecast, By Regional Analysis
8.1. Segment Overview
8.2. North America
8.2.1. U.S.
8.2.2. Canada
8.2.3. Mexico
8.3. Europe
8.3.1. Germany
8.3.2. France
8.3.3. U.K.
8.3.4. Italy
8.3.5. Spain
8.4. Asia-Pacific
8.4.1. Japan
8.4.2. China
8.4.3. India
8.5. South America
8.5.1. Brazil
8.6. Middle East and Africa
8.6.1. UAE
8.6.2. South Africa
9. Global Connected Vehicle Market-Competitive Landscape
9.1. Overview
9.2. Market Share of Key Players in Global Connected Vehicle Market
9.2.1. Global Company Market Share
9.2.2. North America Company Market Share
9.2.3. Europe Company Market Share
9.2.4. APAC Company Market Share
9.3. Competitive Situations and Trends
9.3.1. Product Launches and Developments
9.3.2. Partnerships, Collaborations, and Agreements
9.3.3. Mergers & Acquisitions
9.3.4. Expansions
10. Company Profiles
10.1. Bosch
10.1.1. Business Overview
10.1.2. Company Snapshot
10.1.3. Company Market Share Analysis
10.1.4. Company Product Portfolio
10.1.5. Recent Developments
10.1.6. SWOT Analysis
10.2. Delphi Technologies PLC
10.2.1. Business Overview
10.2.2. Company Snapshot
10.2.3. Company Market Share Analysis
10.2.4. Company Product Portfolio
10.2.5. Recent Developments
10.2.6. SWOT Analysis
10.3. Harman International Industries, Inc.
10.3.1. Business Overview
10.3.2. Company Snapshot
10.3.3. Company Market Share Analysis
10.3.4. Company Product Portfolio
10.3.5. Recent Developments
10.3.6. SWOT Analysis
10.4. Infineon Technologies AG
10.4.1. Business Overview
10.4.2. Company Snapshot
10.4.3. Company Market Share Analysis
10.4.4. Company Product Portfolio
10.4.5. Recent Developments
10.4.6. SWOT Analysis
10.5. NXP Semiconductors N.V.
10.5.1. Business Overview
10.5.2. Company Snapshot
10.5.3. Company Market Share Analysis
10.5.4. Company Product Portfolio
10.5.5. Recent Developments
10.5.6. SWOT Analysis
10.6. Toyota Motor Corporation
10.6.1. Business Overview
10.6.2. Company Snapshot
10.6.3. Company Market Share Analysis
10.6.4. Company Product Portfolio
10.6.5. Recent Developments
10.6.6. SWOT Analysis
10.7. Valeo
10.7.1. Business Overview
10.7.2. Company Snapshot
10.7.3. Company Market Share Analysis
10.7.4. Company Product Portfolio
10.7.5. Recent Developments
10.7.6. SWOT Analysis
10.8. ZF Friedrichshafen AG
10.8.1. Business Overview
10.8.2. Company Snapshot
10.8.3. Company Market Share Analysis
10.8.4. Company Product Portfolio
10.8.5. Recent Developments
10.8.6. SWOT Analysis
10.9. BorgWarner
10.9.1. Business Overview
10.9.2. Company Snapshot
10.9.3. Company Market Share Analysis
10.9.4. Company Product Portfolio
10.9.5. Recent Developments
10.9.6. SWOT Analysis
List of Table
1. Global Connected Vehicle Market, By Service, 2020-2033 (USD Billion)
2. Global Driver Assistance, Connected Vehicle Market, By Region, 2020-2033 (USD Billion)
3. Global Safety, Connected Vehicle Market, By Region, 2020-2033 (USD Billion)
4. Global Entertainment, Connected Vehicle Market, By Region, 2020-2033 (USD Billion)
5. Global Well-Being, Connected Vehicle Market, By Region, 2020-2033 (USD Billion)
6. Global Vehicle Management, Connected Vehicle Market, By Region, 2020-2033 (USD Billion)
7. Global Mobility Management, Connected Vehicle Market, By Region, 2020-2033 (USD Billion)
8. Global Connected Vehicle Market, By Vehicle, 2020-2033 (USD Billion)
9. Global Passenger Cars, Connected Vehicle Market, By Region, 2020-2033 (USD Billion)
10. Global Autonomous Cars, Connected Vehicle Market, By Region, 2020-2033 (USD Billion)
11. Global Commercial Vehicle, Connected Vehicle Market, By Region, 2020-2033 (USD Billion)
12. North America Connected Vehicle Market, By Service, 2020-2033 (USD Billion)
13. North America Connected Vehicle Market, By Vehicle, 2020-2033 (USD Billion)
14. U.S. Connected Vehicle Market, By Service, 2020-2033 (USD Billion)
15. U.S. Connected Vehicle Market, By Vehicle, 2020-2033 (USD Billion)
16. Canada Connected Vehicle Market, By Service, 2020-2033 (USD Billion)
17. Canada Connected Vehicle Market, By Vehicle, 2020-2033 (USD Billion)
18. Mexico Connected Vehicle Market, By Service, 2020-2033 (USD Billion)
19. Mexico Connected Vehicle Market, By Vehicle, 2020-2033 (USD Billion)
20. Europe Connected Vehicle Market, By Service, 2020-2033 (USD Billion)
21. Europe Connected Vehicle Market, By Vehicle, 2020-2033 (USD Billion)
22. Germany Connected Vehicle Market, By Service, 2020-2033 (USD Billion)
23. Germany Connected Vehicle Market, By Vehicle, 2020-2033 (USD Billion)
24. France Connected Vehicle Market, By Service, 2020-2033 (USD Billion)
25. France Connected Vehicle Market, By Vehicle, 2020-2033 (USD Billion)
26. U.K. Connected Vehicle Market, By Service, 2020-2033 (USD Billion)
27. U.K. Connected Vehicle Market, By Vehicle, 2020-2033 (USD Billion)
28. Italy Connected Vehicle Market, By Service, 2020-2033 (USD Billion)
29. Italy Connected Vehicle Market, By Vehicle, 2020-2033 (USD Billion)
30. Spain Connected Vehicle Market, By Service, 2020-2033 (USD Billion)
31. Spain Connected Vehicle Market, By Vehicle, 2020-2033 (USD Billion)
32. Asia Pacific Connected Vehicle Market, By Service, 2020-2033 (USD Billion)
33. Asia Pacific Connected Vehicle Market, By Vehicle, 2020-2033 (USD Billion)
34. Japan Connected Vehicle Market, By Service, 2020-2033 (USD Billion)
35. Japan Connected Vehicle Market, By Vehicle, 2020-2033 (USD Billion)
36. China Connected Vehicle Market, By Service, 2020-2033 (USD Billion)
37. China Connected Vehicle Market, By Vehicle, 2020-2033 (USD Billion)
38. India Connected Vehicle Market, By Service, 2020-2033 (USD Billion)
39. India Connected Vehicle Market, By Vehicle, 2020-2033 (USD Billion)
40. South America Connected Vehicle Market, By Service, 2020-2033 (USD Billion)
41. South America Connected Vehicle Market, By Vehicle, 2020-2033 (USD Billion)
42. Brazil Connected Vehicle Market, By Service, 2020-2033 (USD Billion)
43. Brazil Connected Vehicle Market, By Vehicle, 2020-2033 (USD Billion)
44. Middle East and Africa Connected Vehicle Market, By Service, 2020-2033 (USD Billion)
45. Middle East and Africa Connected Vehicle Market, By Vehicle, 2020-2033 (USD Billion)
46. UAE Connected Vehicle Market, By Service, 2020-2033 (USD Billion)
47. UAE Connected Vehicle Market, By Vehicle, 2020-2033 (USD Billion)
48. South Africa Connected Vehicle Market, By Service, 2020-2033 (USD Billion)
49. South Africa Connected Vehicle Market, By Vehicle, 2020-2033 (USD Billion)
List of Figures
1. Global Connected Vehicle Market Segmentation
2. Global Connected Vehicle Market: Research Methodology
3. Market Size Estimation Methodology: Bottom-Up Approach
4. Market Size Estimation Methodology: Top-Down Approach
5. Data Triangulation
6. Porter’s Five Forces Analysis
7. Value Chain Analysis
8. Global Connected Vehicle Market Attractiveness Analysis by Service
9. Global Connected Vehicle Market Attractiveness Analysis by Vehicle
10. Global Connected Vehicle Market Attractiveness Analysis by Region
11. Global Connected Vehicle Market: Dynamics
12. Global Connected Vehicle Market Share by Service (2023 & 2033)
13. Global Connected Vehicle Market Share by Vehicle (2023 & 2033)
14. Global Connected Vehicle Market Share by Regions (2023 & 2033)
15. Global Connected Vehicle Market Share by Company (2023)
This study forecasts global, regional, and country revenue from 2020 to 2033. The Brainy Insights has segmented the global connected vehicle market based on the below-mentioned segments:
Global Connected Vehicle Market By Service:
Global Connected Vehicle Market By Vehicle:
Global Connected Vehicle Market By Region:
Research has its special purpose to undertake marketing efficiently. In this competitive scenario, businesses need information across all industry verticals; the information about customer wants, market demand, competition, industry trends, distribution channels etc. This information needs to be updated regularly because businesses operate in a dynamic environment. Our organization, The Brainy Insights incorporates scientific and systematic research procedures in order to get proper market insights and industry analysis for overall business success. The analysis consists of studying the market from a miniscule level wherein we implement statistical tools which helps us in examining the data with accuracy and precision.
Our research reports feature both; quantitative and qualitative aspects for any market. Qualitative information for any market research process are fundamental because they reveal the customer needs and wants, usage and consumption for any product/service related to a specific industry. This in turn aids the marketers/investors in knowing certain perceptions of the customers. Qualitative research can enlighten about the different product concepts and designs along with unique service offering that in turn, helps define marketing problems and generate opportunities. On the other hand, quantitative research engages with the data collection process through interviews, e-mail interactions, surveys and pilot studies. Quantitative aspects for the market research are useful to validate the hypotheses generated during qualitative research method, explore empirical patterns in the data with the help of statistical tools, and finally make the market estimations.
The Brainy Insights offers comprehensive research and analysis, based on a wide assortment of factual insights gained through interviews with CXOs and global experts and secondary data from reliable sources. Our analysts and industry specialist assume vital roles in building up statistical tools and analysis models, which are used to analyse the data and arrive at accurate insights with exceedingly informative research discoveries. The data provided by our organization have proven precious to a diverse range of companies, facilitating them to address issues such as determining which products/services are the most appealing, whether or not customers use the product in the manner anticipated, the purchasing intentions of the market and many others.
Our research methodology encompasses an idyllic combination of primary and secondary initiatives. Key phases involved in this process are listed below:

The phase involves the gathering and collecting of market data and its related information with the help of different sources & research procedures.

The data procurement stage involves in data gathering and collecting through various data sources.
This stage involves in extensive research. These data sources includes:
Purchased Database: Purchased databases play a crucial role in estimating the market sizes irrespective of the domain. Our purchased database includes:
Primary Research: The Brainy Insights interacts with leading companies and experts of the concerned domain to develop the analyst team’s market understanding and expertise. It improves and substantiates every single data presented in the market reports. Primary research mainly involves in telephonic interviews, E-mail interactions and face-to-face interviews with the raw material providers, manufacturers/producers, distributors, & independent consultants. The interviews that we conduct provides valuable data on market size and industry growth trends prevailing in the market. Our organization also conducts surveys with the various industry experts in order to gain overall insights of the industry/market. For instance, in healthcare industry we conduct surveys with the pharmacists, doctors, surgeons and nurses in order to gain insights and key information of a medical product/device/equipment which the customers are going to usage. Surveys are conducted in the form of questionnaire designed by our own analyst team. Surveys plays an important role in primary research because surveys helps us to identify the key target audiences of the market. Additionally, surveys helps to identify the key target audience engaged with the market. Our survey team conducts the survey by targeting the key audience, thus gaining insights from them. Based on the perspectives of the customers, this information is utilized to formulate market strategies. Moreover, market surveys helps us to understand the current competitive situation of the industry. To be precise, our survey process typically involve with the 360 analysis of the market. This analytical process begins by identifying the prospective customers for a product or service related to the market/industry to obtain data on how a product/service could fit into customers’ lives.

Secondary Research: The secondary data sources includes information published by the on-profit organizations such as World bank, WHO, company fillings, investor presentations, annual reports, national government documents, statistical databases, blogs, articles, white papers and others. From the annual report, we analyse a company’s revenue to understand the key segment and market share of that organization in a particular region. We analyse the company websites and adopt the product mapping technique which is important for deriving the segment revenue. In the product mapping method, we select and categorize the products offered by the companies catering to domain specific market, deduce the product revenue for each of the companies so as to get overall estimation of the market size. We also source data and analyses trends based on information received from supply side and demand side intermediaries in the value chain. The supply side denotes the data gathered from supplier, distributor, wholesaler and the demand side illustrates the data gathered from the end customers for respective market domain.

The supply side for a domain specific market is analysed by:
The demand side for the market is estimated through:
In-house Library: Apart from these third-party sources, we have our in-house library of qualitative and quantitative information. Our in-house database includes market data for various industry and domains. These data are updated on regular basis as per the changing market scenario. Our library includes, historic databases, internal audit reports and archives.
Sometimes there are instances where there is no metadata or raw data available for any domain specific market. For those cases, we use our expertise to forecast and estimate the market size in order to generate comprehensive data sets. Our analyst team adopt a robust research technique in order to produce the estimates:
Data Synthesis: This stage involves the analysis & mapping of all the information obtained from the previous step. It also involves in scrutinizing the data for any discrepancy observed while data gathering related to the market. The data is collected with consideration to the heterogeneity of sources. Robust scientific techniques are in place for synthesizing disparate data sets and provide the essential contextual information that can orient market strategies. The Brainy Insights has extensive experience in data synthesis where the data passes through various stages:


Market Deduction & Formulation: The final stage comprises of assigning data points at appropriate market spaces so as to deduce feasible conclusions. Analyst perspective & subject matter expert based holistic form of market sizing coupled with industry analysis also plays a crucial role in this stage.
This stage involves in finalization of the market size and numbers that we have collected from data integration step. With data interpolation, it is made sure that there is no gap in the market data. Successful trend analysis is done by our analysts using extrapolation techniques, which provide the best possible forecasts for the market.
Data Validation & Market Feedback: Validation is the most important step in the process. Validation & re-validation via an intricately designed process helps us finalize data-points to be used for final calculations.

The Brainy Insights interacts with leading companies and experts of the concerned domain to develop the analyst team’s market understanding and expertise. It improves and substantiates every single data presented in the market reports. The data validation interview and discussion panels are typically composed of the most experienced industry members. The participants include, however, are not limited to:
Moreover, we always validate our data and findings through primary respondents from all the major regions we are working on.


Free Customization
Fortune 500 Clients
Free Yearly Update On Purchase Of Multi/Corporate License
Companies Served Till Date