- +1-315-215-1633
- sales@thebrainyinsights.com

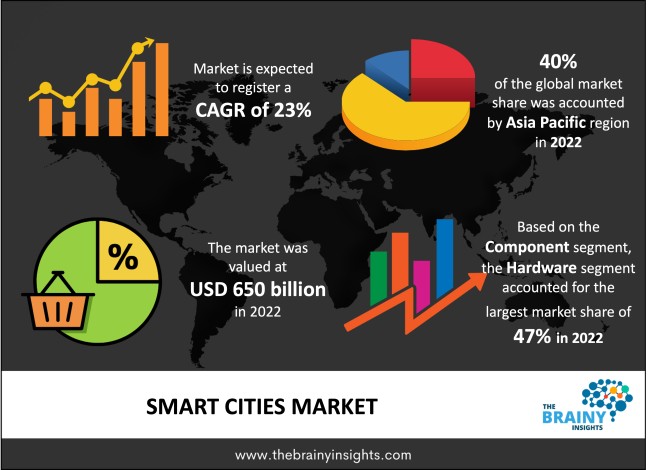
The global smart cities market was valued at USD 650 billion in 2022 and grew at a CAGR of 23% from 2023 to 2032. The market is expected to reach USD 5151.86 billion by 2032. Increasing government expenditure on smart city development projects will drive the growth of the global smart cities market.
A city is an urban settlement with a high population density. It has an administrative and development body governing the city. The city has well-defined territorial boundaries. Rapid urbanization has led to an increasing number of unplanned cities being developed and the haphazard expansion of old cities. This has led to inefficient use of city resources, wastage, lack of basic facilities for the citizens, a lower standard of living, pollution, and inadequate healthcare and education. The growth of cities is bound to continue, given the increasing population and shift towards non-agricultural income sources. Therefore, it is vital to improve the functioning of cities to make optimal use of resources, reduce wastage and improve productivity. Integrating technologies in city administration, healthcare, education systems, transportation, waste collection and disposal, and water and gas connection forms the basis of a smart city. A smart city is a technologically advanced urban setting. The smart city administration employs ICT to improve operational efficiency, service delivery and public utilities. The goal of a smart city is to use technology to ensure a sufficient supply of water, reliable access to electricity, sanitation, effective public transport, and affordable housing. It enables strong communications, good governance, and citizen engagement. These cities are clean economies with renewable and sustainable sources of energy. They thrive on sustainability and eco-friendly process and systems. Smart cities are secure, safe, healthy, accessible, fast and productive.
Get an overview of this study by requesting a free sample
The rapid urbanization – the growing population, increasing disposable income, and rising industrialization have all contributed to the world's rapid urbanisation. However, this urbanization has been haphazard, ad-hoc and unplanned, leading to inefficient and wasteful use of resources. The unplanned urban clusters are congested, polluted, and inaccessible, with poor living conditions and inadequate healthcare and education institutions. They are overburdened and inefficient. Therefore, it is imperative to repurpose the cities and build them back with smarter technologies to make them efficient, resilient and sustainable. Smart cities will offer smart infrastructure, enabling smart governance, timely delivery of services, and seamless urban mobility solutions. The increasing automation and digitization of economies and the development of novel technologies such as IoT, AI, API and data analytics will contribute significantly to the market's development and growth. The increasing government expenditure and favourable initiatives will also propel the market's demand.
The high capital investments – the development of smart cities is the prerogative of the government institutions given the public nature of commodities like public transport systems, healthcare, education, roads etc. Furthermore, private players do not primarily invest in large sums of projects with long incubation periods. Therefore, the government is the sole funding authority for smart city development projects. Given the significant amount of technology acquisition, adoption and integration, the capital expenditure is high in these projects. Furthermore, the systemic problems of red tape, bureaucracy, and corruption all lead to delays and escalating costs. Therefore, the high capital investments will hamper the market's growth.
The development of novel technologies like AI, API, and IoT – the rising research and development expenditure in developing artificial intelligence, the internet of things, big data and machine learning have paved the way for its applications in smart cities. For instance, AI can analyze security cameras to assess the unsafe areas of the city. It can monitor movement in public spaces to ensure safety. Big data can analyze large amounts of data in real time, which will help optimise city resources, thereby improving efficiency, sustainability and productivity. The development of new technologies to improve traffic management, infrastructure durability, governance, record keeping and management will all contribute to the development of the global smart cities market in the forecast period.
The regions analyzed for the market include North America, Europe, South America, Asia Pacific, the Middle East, and Africa. Asia Pacific emerged as the most significant global smart cities market, with a 40% market revenue share in 2022.
The rapid urbanization and industrialization will drive the market's growth. The expanding ICT infrastructure will enable quicker development of smart cities. The increasing government capital expenditure and dedicated missions for developing smart cities will bode well for the market. The smart cities market will witness favourable growth as the Asia Pacific economies focus on achieving their UN SDG goals by 2030. The climate pledges to secure future generations' future will offer the necessary imputes to the market's development and growth. China, Japan, South Korea and Taiwan will drive the technological innovations significantly affecting smart city development projects.
Asia Pacific Region Smart Cities Market Share in 2022 - 40%
www.thebrainyinsights.com
Check the geographical analysis of this market by requesting a free sample
The component segment is divided into hardware, services, and software. The hardware segment dominated the market, with a market share of around 47% in 2022. The rising use of IoT, smart mobility vehicles, intelligent traffic signals, smart grids and communication lines will drive the segment's growth. Using security cameras, sensors, segways etc., to improve the safety, security, surveillance, and monitoring in cities will promote the segment's growth. The increasing government expenditure in acquiring smart hardware and rising private capital expenditure on research and development of smart technologies will propel the segment's growth.
The application segment is divided into smart infrastructure, smart energy, smart healthcare, smart education, smart governance, smart buildings, smart mobility management, smart security, and others. The smart energy segment dominated the market, with a market share of around 30% in 2022. Using smart technology to improve energy efficiency is known as smart energy. The growing energy needs and the rising threat of climate change have encouraged the adoption of smart energy technologies and initiatives. The aim is to meet the rising energy demands with clean, renewable and sustainable forms of energy. This is achieved by combining IoT sensor-based operations with artificial intelligence, machine learning, and data analytics technologies. Smart energy is fundamental to smart buildings, healthcare, education, and mobility solutions. It is the backbone of the economy, thereby dominating the market.
| Attribute | Description |
|---|---|
| Market Size | Revenue (USD Billion) |
| Market size value in 2022 | USD 650 Billion |
| Market size value in 2032 | USD 5151.86 Billion |
| CAGR (2023 to 2032) | 23% |
| Historical data | 2019-2021 |
| Base Year | 2022 |
| Forecast | 2023-2032 |
| Region | The regions analyzed for the market are Asia Pacific, Europe, South America, North America, and Middle East & Africa. Furthermore, the regions are further analyzed at the country level. |
| Segments | Component and Application |
As per The Brainy Insights, the size of the global smart cities market was valued at USD 650 billion in 2022 to USD 5151.86 billion by 2032.
Global smart cities market is growing at a CAGR of 23% during the forecast period 2023-2032.
The market's growth will be influenced by the rapid urbanization.
The high capital investments could hamper the market growth.
1. Introduction
1.1. Objectives of the Study
1.2. Market Definition
1.3. Research Scope
1.4. Currency
1.5. Key Target Audience
2. Research Methodology and Assumptions
3. Executive Summary
4. Premium Insights
4.1. Porter’s Five Forces Analysis
4.2. Value Chain Analysis
4.3. Top Investment Pockets
4.3.1. Market Attractiveness Analysis By Component
4.3.2. Market Attractiveness Analysis By Application
4.3.3. Market Attractiveness Analysis By Region
4.4. Industry Trends
5. Market Dynamics
5.1. Market Evaluation
5.2. Drivers
5.2.1. The rapid urbanization
5.3. Restraints
5.3.1. The high capital investments
5.4. Opportunities
5.4.1. The development of novel technologies like AI, API, and IoT
5.5. Challenges
5.5.1. The data privacy and security concerns
6. Global Smart Cities Market Analysis and Forecast, By Component
6.1. Segment Overview
6.2. Hardware
6.3. Services
6.4. Software
7. Global Smart Cities Market Analysis and Forecast, By Application
7.1. Segment Overview
7.2. Smart Infrastructure
7.3. Smart Energy
7.4. Smart Healthcare
7.5. Smart Education
7.6. Smart Governance
7.7. Smart Buildings
7.8. Smart Mobility Management
7.9. Smart Security
7.10. Others
8. Global Smart Cities Market Analysis and Forecast, By Regional Analysis
8.1. Segment Overview
8.2. North America
8.2.1. U.S.
8.2.2. Canada
8.2.3. Mexico
8.3. Europe
8.3.1. Germany
8.3.2. France
8.3.3. U.K.
8.3.4. Italy
8.3.5. Spain
8.4. Asia-Pacific
8.4.1. Japan
8.4.2. China
8.4.3. India
8.5. South America
8.5.1. Brazil
8.6. Middle East and Africa
8.6.1. UAE
8.6.2. South Africa
9. Global Smart Cities Market-Competitive Landscape
9.1. Overview
9.2. Market Share of Key Players in the Smart Cities Market
9.2.1. Global Company Market Share
9.2.2. North America Company Market Share
9.2.3. Europe Company Market Share
9.2.4. APAC Company Market Share
9.3. Competitive Situations and Trends
9.3.1. Product Launches and Developments
9.3.2. Partnerships, Collaborations, and Agreements
9.3.3. Mergers & Acquisitions
9.3.4. Expansions
10. Company Profiles
10.1. ABB Limited
10.1.1. Business Overview
10.1.2. Company Snapshot
10.1.3. Company Market Share Analysis
10.1.4. Company Product Portfolio
10.1.5. Recent Developments
10.1.6. SWOT Analysis
10.2. AGT International
10.2.1. Business Overview
10.2.2. Company Snapshot
10.2.3. Company Market Share Analysis
10.2.4. Company Product Portfolio
10.2.5. Recent Developments
10.2.6. SWOT Analysis
10.3. Cisco Systems, Inc.
10.3.1. Business Overview
10.3.2. Company Snapshot
10.3.3. Company Market Share Analysis
10.3.4. Company Product Portfolio
10.3.5. Recent Developments
10.3.6. SWOT Analysis
10.4. Ericsson
10.4.1. Business Overview
10.4.2. Company Snapshot
10.4.3. Company Market Share Analysis
10.4.4. Company Product Portfolio
10.4.5. Recent Developments
10.4.6. SWOT Analysis
10.5. General Electric
10.5.1. Business Overview
10.5.2. Company Snapshot
10.5.3. Company Market Share Analysis
10.5.4. Company Product Portfolio
10.5.5. Recent Developments
10.5.6. SWOT Analysis
10.6. Hitachi Ltd.
10.6.1. Business Overview
10.6.2. Company Snapshot
10.6.3. Company Market Share Analysis
10.6.4. Company Product Portfolio
10.6.5. Recent Developments
10.6.6. SWOT Analysis
10.7. Huawei Technologies Co. Ltd.
10.7.1. Business Overview
10.7.2. Company Snapshot
10.7.3. Company Market Share Analysis
10.7.4. Company Product Portfolio
10.7.5. Recent Developments
10.7.6. SWOT Analysis
10.8. IBM Corporation
10.8.1. Business Overview
10.8.2. Company Snapshot
10.8.3. Company Market Share Analysis
10.8.4. Company Product Portfolio
10.8.5. Recent Developments
10.8.6. SWOT Analysis
10.9. Microsoft Corporation
10.9.1. Business Overview
10.9.2. Company Snapshot
10.9.3. Company Market Share Analysis
10.9.4. Company Product Portfolio
10.9.5. Recent Developments
10.9.6. SWOT Analysis
10.10. Schneider Electric
10.10.1. Business Overview
10.10.2. Company Snapshot
10.10.3. Company Market Share Analysis
10.10.4. Company Component Portfolio
10.10.5. Recent Developments
10.10.6. SWOT Analysis
List of Table
1. Global Smart Cities Market, By Component, 2019-2032 (USD Billion)
2. Global Hardware Smart Cities Market, By Region, 2019-2032 (USD Billion)
3. Global Services Smart Cities Market, By Region, 2019-2032 (USD Billion)
4. Global Software Smart Cities Market, By Region, 2019-2032 (USD Billion)
5. Global Smart Cities Market, By Application, 2019-2032 (USD Billion)
6. Global Smart Infrastructure Smart Cities Market, By Region, 2019-2032 (USD Billion)
7. Global Smart Energy Smart Cities Market, By Region, 2019-2032 (USD Billion)
8. Global Smart Healthcare Smart Cities Market, By Region, 2019-2032 (USD Billion)
9. Global Smart Education Smart Cities Market, By Region, 2019-2032 (USD Billion)
10. Global Smart Governance Smart Cities Market, By Region, 2019-2032 (USD Billion)
11. Global Smart Buildings Smart Cities Market, By Region, 2019-2032 (USD Billion)
12. Global Smart Mobility Management Smart Cities Market, By Region, 2019-2032 (USD Billion)
13. Global Smart Security Smart Cities Market, By Region, 2019-2032 (USD Billion)
14. Global Others Smart Cities Market, By Region, 2019-2032 (USD Billion)
15. Global Smart Cities Market, By Region, 2019-2032 (USD Billion)
16. North America Smart Cities Market, By Component, 2019-2032 (USD Billion)
17. North America Smart Cities Market, By Application, 2019-2032 (USD Billion)
18. U.S. Smart Cities Market, By Component, 2019-2032 (USD Billion)
19. U.S. Smart Cities Market, By Application, 2019-2032 (USD Billion)
20. Canada Smart Cities Market, By Component, 2019-2032 (USD Billion)
21. Canada Smart Cities Market, By Application, 2019-2032 (USD Billion)
22. Mexico Smart Cities Market, By Component, 2019-2032 (USD Billion)
23. Mexico Smart Cities Market, By Application, 2019-2032 (USD Billion)
24. Europe Smart Cities Market, By Component, 2019-2032 (USD Billion)
25. Europe Smart Cities Market, By Application, 2019-2032 (USD Billion)
26. Germany Smart Cities Market, By Component, 2019-2032 (USD Billion)
27. Germany Smart Cities Market, By Application, 2019-2032 (USD Billion)
28. France Smart Cities Market, By Component, 2019-2032 (USD Billion)
29. France Smart Cities Market, By Application, 2019-2032 (USD Billion)
30. U.K. Smart Cities Market, By Component, 2019-2032 (USD Billion)
31. U.K. Smart Cities Market, By Application, 2019-2032 (USD Billion)
32. Italy Smart Cities Market, By Component, 2019-2032 (USD Billion)
33. Italy Smart Cities Market, By Application, 2019-2032 (USD Billion)
34. Spain Smart Cities Market, By Component, 2019-2032 (USD Billion)
35. Spain Smart Cities Market, By Application, 2019-2032 (USD Billion)
36. Asia Pacific Smart Cities Market, By Component, 2019-2032 (USD Billion)
37. Asia Pacific Smart Cities Market, By Application, 2019-2032 (USD Billion)
38. Japan Smart Cities Market, By Component, 2019-2032 (USD Billion)
39. Japan Smart Cities Market, By Application, 2019-2032 (USD Billion)
40. China Smart Cities Market, By Component, 2019-2032 (USD Billion)
41. China Smart Cities Market, By Application, 2019-2032 (USD Billion)
42. India Smart Cities Market, By Component, 2019-2032 (USD Billion)
43. India Smart Cities Market, By Application, 2019-2032 (USD Billion)
44. South America Smart Cities Market, By Component, 2019-2032 (USD Billion)
45. South America Smart Cities Market, By Application, 2019-2032 (USD Billion)
46. Brazil Smart Cities Market, By Component, 2019-2032 (USD Billion)
47. Brazil Smart Cities Market, By Application, 2019-2032 (USD Billion)
48. Middle East and Africa Smart Cities Market, By Component, 2019-2032 (USD Billion)
49. Middle East and Africa Smart Cities Market, By Application, 2019-2032 (USD Billion)
50. UAE Smart Cities Market, By Component, 2019-2032 (USD Billion)
51. UAE Smart Cities Market, By Application, 2019-2032 (USD Billion)
52. South Africa Smart Cities Market, By Component, 2019-2032 (USD Billion)
53. South Africa Smart Cities Market, By Application, 2019-2032 (USD Billion)
List of Figures
1. Global Smart Cities Market Segmentation
2. Smart Cities Market: Research Methodology
3. Market Size Estimation Methodology: Bottom-Up Approach
4. Market Size Estimation Methodology: Top-Down Approach
5. Data Triangulation
6. Porter’s Five Forces Analysis
7. Value Chain Analysis
8. Global Smart Cities Market Attractiveness Analysis By Component
9. Global Smart Cities Market Attractiveness Analysis By Application
10. Global Smart Cities Market Attractiveness Analysis By Region
11. Global Smart Cities Market: Dynamics
12. Global Smart Cities Market Share by Component (2022 & 2032)
13. Global Smart Cities Market Share by Application (2022 & 2032)
14. Global Smart Cities Market Share by Regions (2022 & 2032)
15. Global Smart Cities Market Share by Company (2022)
This study forecasts revenue at global, regional, and country levels from 2019 to 2032. The Brainy Insights has segmented the global smart cities market based on below mentioned segments:
Global Smart Cities Market by Component:
Global Smart Cities Market by Application:
Global Smart Cities Market by Region:
Research has its special purpose to undertake marketing efficiently. In this competitive scenario, businesses need information across all industry verticals; the information about customer wants, market demand, competition, industry trends, distribution channels etc. This information needs to be updated regularly because businesses operate in a dynamic environment. Our organization, The Brainy Insights incorporates scientific and systematic research procedures in order to get proper market insights and industry analysis for overall business success. The analysis consists of studying the market from a miniscule level wherein we implement statistical tools which helps us in examining the data with accuracy and precision.
Our research reports feature both; quantitative and qualitative aspects for any market. Qualitative information for any market research process are fundamental because they reveal the customer needs and wants, usage and consumption for any product/service related to a specific industry. This in turn aids the marketers/investors in knowing certain perceptions of the customers. Qualitative research can enlighten about the different product concepts and designs along with unique service offering that in turn, helps define marketing problems and generate opportunities. On the other hand, quantitative research engages with the data collection process through interviews, e-mail interactions, surveys and pilot studies. Quantitative aspects for the market research are useful to validate the hypotheses generated during qualitative research method, explore empirical patterns in the data with the help of statistical tools, and finally make the market estimations.
The Brainy Insights offers comprehensive research and analysis, based on a wide assortment of factual insights gained through interviews with CXOs and global experts and secondary data from reliable sources. Our analysts and industry specialist assume vital roles in building up statistical tools and analysis models, which are used to analyse the data and arrive at accurate insights with exceedingly informative research discoveries. The data provided by our organization have proven precious to a diverse range of companies, facilitating them to address issues such as determining which products/services are the most appealing, whether or not customers use the product in the manner anticipated, the purchasing intentions of the market and many others.
Our research methodology encompasses an idyllic combination of primary and secondary initiatives. Key phases involved in this process are listed below:

The phase involves the gathering and collecting of market data and its related information with the help of different sources & research procedures.

The data procurement stage involves in data gathering and collecting through various data sources.
This stage involves in extensive research. These data sources includes:
Purchased Database: Purchased databases play a crucial role in estimating the market sizes irrespective of the domain. Our purchased database includes:
Primary Research: The Brainy Insights interacts with leading companies and experts of the concerned domain to develop the analyst team’s market understanding and expertise. It improves and substantiates every single data presented in the market reports. Primary research mainly involves in telephonic interviews, E-mail interactions and face-to-face interviews with the raw material providers, manufacturers/producers, distributors, & independent consultants. The interviews that we conduct provides valuable data on market size and industry growth trends prevailing in the market. Our organization also conducts surveys with the various industry experts in order to gain overall insights of the industry/market. For instance, in healthcare industry we conduct surveys with the pharmacists, doctors, surgeons and nurses in order to gain insights and key information of a medical product/device/equipment which the customers are going to usage. Surveys are conducted in the form of questionnaire designed by our own analyst team. Surveys plays an important role in primary research because surveys helps us to identify the key target audiences of the market. Additionally, surveys helps to identify the key target audience engaged with the market. Our survey team conducts the survey by targeting the key audience, thus gaining insights from them. Based on the perspectives of the customers, this information is utilized to formulate market strategies. Moreover, market surveys helps us to understand the current competitive situation of the industry. To be precise, our survey process typically involve with the 360 analysis of the market. This analytical process begins by identifying the prospective customers for a product or service related to the market/industry to obtain data on how a product/service could fit into customers’ lives.

Secondary Research: The secondary data sources includes information published by the on-profit organizations such as World bank, WHO, company fillings, investor presentations, annual reports, national government documents, statistical databases, blogs, articles, white papers and others. From the annual report, we analyse a company’s revenue to understand the key segment and market share of that organization in a particular region. We analyse the company websites and adopt the product mapping technique which is important for deriving the segment revenue. In the product mapping method, we select and categorize the products offered by the companies catering to domain specific market, deduce the product revenue for each of the companies so as to get overall estimation of the market size. We also source data and analyses trends based on information received from supply side and demand side intermediaries in the value chain. The supply side denotes the data gathered from supplier, distributor, wholesaler and the demand side illustrates the data gathered from the end customers for respective market domain.

The supply side for a domain specific market is analysed by:
The demand side for the market is estimated through:
In-house Library: Apart from these third-party sources, we have our in-house library of qualitative and quantitative information. Our in-house database includes market data for various industry and domains. These data are updated on regular basis as per the changing market scenario. Our library includes, historic databases, internal audit reports and archives.
Sometimes there are instances where there is no metadata or raw data available for any domain specific market. For those cases, we use our expertise to forecast and estimate the market size in order to generate comprehensive data sets. Our analyst team adopt a robust research technique in order to produce the estimates:
Data Synthesis: This stage involves the analysis & mapping of all the information obtained from the previous step. It also involves in scrutinizing the data for any discrepancy observed while data gathering related to the market. The data is collected with consideration to the heterogeneity of sources. Robust scientific techniques are in place for synthesizing disparate data sets and provide the essential contextual information that can orient market strategies. The Brainy Insights has extensive experience in data synthesis where the data passes through various stages:


Market Deduction & Formulation: The final stage comprises of assigning data points at appropriate market spaces so as to deduce feasible conclusions. Analyst perspective & subject matter expert based holistic form of market sizing coupled with industry analysis also plays a crucial role in this stage.
This stage involves in finalization of the market size and numbers that we have collected from data integration step. With data interpolation, it is made sure that there is no gap in the market data. Successful trend analysis is done by our analysts using extrapolation techniques, which provide the best possible forecasts for the market.
Data Validation & Market Feedback: Validation is the most important step in the process. Validation & re-validation via an intricately designed process helps us finalize data-points to be used for final calculations.

The Brainy Insights interacts with leading companies and experts of the concerned domain to develop the analyst team’s market understanding and expertise. It improves and substantiates every single data presented in the market reports. The data validation interview and discussion panels are typically composed of the most experienced industry members. The participants include, however, are not limited to:
Moreover, we always validate our data and findings through primary respondents from all the major regions we are working on.


Free Customization
Fortune 500 Clients
Free Yearly Update On Purchase Of Multi/Corporate License
Companies Served Till Date