- +1-315-215-1633
- sales@thebrainyinsights.com

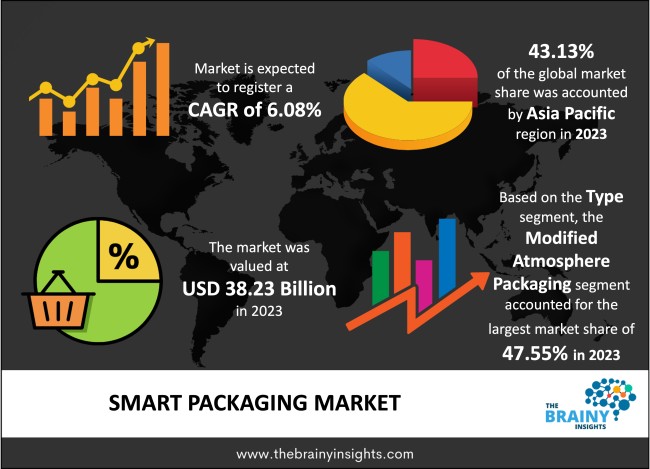
The global smart packaging market was valued at USD 38.23 billion in 2023 and grew at a CAGR of 6.08% from 2024 to 2033. The market is expected to reach USD 68.99 billion by 2033. The increasing demand for consumer goods in developing nations will drive the global smart packaging market's growth.
Packaging of goods incorporates the science, art, and technology of safeguarding goods for distribution, storage, sale, and use. It envisages the process of creating, analyzing, and designing packages. The choice of material, size, shape, and colour is also discussed at length. The primary goal achieved through effective packaging is to safeguard the goods. It protects them from external impact, moisture, microbes, spillage or other factors. Good packaging will facilitate effective delivery, make storage simple, and also enables manufacturers to communicate important handling instructions. The contents on the packaging are also excellent sales and advertising means to promote company business. The choice of packaging also determines the shelf-life of the products. Packaging allows the producers to keep their products clean and hygienic until it reaches the consumer. Smart packaging utilises new-age technology, devices, systems and products to improve packaging and supply chain logistics. For instance, RFID technology enables real-time tracking of products and locating them within no time. It promotes transparency and helps producers gain the trust of the consumers. Smart packaging also involves using innovative materials that effectively keep durable foods, beverages, vegetables and medicines intact for an extended period. Smart packaging enables enhanced authentication, traceability, and compliance. It promotes security and safeguards goods. Smart packaging allows sustainable measures to be implemented in the industry, which reduces waste and costs. It optimizes logistics. In general, smart packaging technology offers a wide range of potential application domains, and these benefits will propel its growth in the forecast period.
Get an overview of this study by requesting a free sample
The exponential growth of the E-commerce industry – The increasing ownership of smart connected devices, given the increasing disposable income of the population and better data connectivity facilitated by the telecom boom worldwide, has contributed to enhanced e-commerce accessibility in the global population. Furthermore, the lower prices of the internet and smartphones have augmented the e-commerce industry by increasing the active users on these platforms. The covid-19 pandemic-induced lockdowns increased the popularity of online shopping for groceries, food, clothing and other consumer goods, given the convenience, affordability and accessibility it offered. The pandemic encouraged several businesses to shift towards online e-commerce platforms to facilitate their business expansion. The growth of third-party e-commerce platforms like Amazon, Flipkart and Myntra has also contributed to the market's development. New market players are entering the industry daily, offering consumers more choices, faster services and higher customer satisfaction. The growth of the e-commerce industry will drive the demand for smart packaging. Smart packaging will enable users to optimize logistics, reduce costs, and effectively manage goods and supply chains, offering fast delivery and higher customer satisfaction.
High cost of smart packaging – Conventional packaging products do not incorporate technology or advanced devices, sensors, tags and IoT. Smart packaging uses advanced products, technologies, systems and devices such as sensors, RFIDs, and IoT for real-time product tracking, monitoring, controlling and management. They also use advanced packaging materials for extended shelf life, retaining the freshness and original quality of goods. These products or materials are costlier than conventional products. Not all market players can afford the new technology. Therefore, the high cost of smart packaging will restrict the market's growth.
Technological advancements and product innovations – digitization and automation globally have enabled economic units to achieve efficiency and enhanced productivity. The packaging sector also deploys new products and technologies to improve their work. The constant technological advancements and innovations enable the packaging sector to incorporate new methods, systems and devices that improve accessibility, monitoring and management of supply chain logistics. Growing demand for automated systems that execute smart logistics with little human involvement is a case in point. Real-time inventory information is provided by the sensors used to track the items. The range of AI and big data analytics applications has expanded due to increased research and advancements. RFID permits remote asset management and inventory tracking. It offers precision, dependability, real-time monitoring, minimal human participation, and security features have made it suitable for application in a variety of industries, including banking, financial services, aerospace, and defence. Such new applications will offer lucrative opportunities for global smart packaging market players in the forecast period.
The regions analyzed for the market include North America, Europe, South America, Asia Pacific, the Middle East, and Africa. Asia Pacific emerged as the most significant global smart packaging market, with a 43.13% market revenue share in 2023.
Asia Pacific region will account for the largest market share with revenue growth. The expansion of the Asia Pacific smart packaging industry is attributed to increasing government initiatives focused on developing effective, smart, seamless and faster supply chain logistics. The growing population of the region driven by India and China are increasing consumer demand which is also facilitated by the rising disposable income of the population. The enormous populations of China and India are fuelling the market for various items, including automobiles, consumer goods, and pharmaceuticals. Due to the increase in demand, efficient logistics are now a need.
Asia Pacific Region Smart Packaging Market Share in 2023 – 43.13%
www.thebrainyinsights.com
Check the geographical analysis of this market by requesting a free sample
The type segment is divided into active packaging, intelligent packaging and modified atmosphere packaging. The modified atmosphere packaging segment dominated the market, with a market share of around 47.55% in 2023. Modified atmosphere packaging alters a product's or its content's internal environment to increase its shelf life. The main applications of this technology are meat, fish, poultry, and dairy products that are prone to oxidation and further deterioration. Modified atmosphere packaging (MAP) imposes a gas environment, frequently consisting of an antimicrobial active gas like carbon dioxide and an inert gas like nitrogen. These gases shield the product from oxidation and rancidity, increasing its shelf life. It aids in maintaining the freshness, nutrition, and aesthetic appeal of packaged items.
The end-user segment is divided into food and beverages, automotive, personal care, pharmaceuticals and healthcare, and others. The food and beverages segment dominated the market, with a market share of around 40.33% in 2023. The food and beverage (F&B) industry covers all businesses that prepare, pack, and distribute raw food materials. This covers both packaged and fresh prepared foods, as well as alcoholic and non-alcoholic beverages. The demand for consumer products has expanded due to the expanding population and rising disposable income. With the population's rising disposable income, the consumer market is growing. Retailers are investing in smart technologies to secure timely delivery of high-quality goods, cut downtime in operations, and boost efficiency to win over the market's expanding consumer base.
| Attribute | Description |
|---|---|
| Market Size | Revenue (USD Billion) |
| Market size value in 2023 | USD 38.23 Billion |
| Market size value in 2033 | USD 68.99 Billion |
| CAGR (2024 to 2033) | 6.08% |
| Historical data | 2020-2022 |
| Base Year | 2023 |
| Forecast | 2024-2033 |
| Region | The regions analyzed for the market are Asia Pacific, Europe, South America, North America, and Middle East & Africa. Furthermore, the regions are further analyzed at the country level. |
| Segments | Type and End User |
As per The Brainy Insights, the size of the global smart packaging market was valued at USD 38.23 billion in 2023 to USD 68.99 billion by 2033.
Global smart packaging market is growing at a CAGR of 6.08% during the forecast period 2024-2033.
The market's growth will be influenced by the exponential growth of the E-commerce industry.
High cost of smart packaging could hamper the market growth.
1. Introduction
1.1. Objectives of the Study
1.2. Market Definition
1.3. Research Scope
1.4. Currency
1.5. Key Target Audience
2. Research Methodology and Assumptions
3. Executive Summary
4. Premium Insights
4.1. Porter’s Five Forces Analysis
4.2. Value Chain Analysis
4.3. Top Investment Pockets
4.3.1. Market Attractiveness Analysis By Type
4.3.2. Market Attractiveness Analysis By End User
4.3.3. Market Attractiveness Analysis By Region
4.4. Industry Trends
5. Market Dynamics
5.1. Market Evaluation
5.2. Drivers
5.2.1. The exponential growth of the E-commerce industry
5.3. Restraints
5.3.1. High cost of smart packaging
5.4. Opportunities
5.4.1. Technological advancements and product innovations
5.5. Challenges
5.5.1. Data privacy, security and safety concerns
6. Global Smart Packaging Market Analysis and Forecast, By Type
6.1. Segment Overview
6.2. Active Packaging
6.3. Intelligent Packaging
6.4. Modified Atmosphere Packaging
7. Global Smart Packaging Market Analysis and Forecast, By End User
7.1. Segment Overview
7.2. Food and Beverages
7.3. Automotive
7.4. Personal Care
7.5. Pharmaceuticals and Healthcare
7.6. Others
8. Global Smart Packaging Market Analysis and Forecast, By Regional Analysis
8.1. Segment Overview
8.2. North America
8.2.1. U.S.
8.2.2. Canada
8.2.3. Mexico
8.3. Europe
8.3.1. Germany
8.3.2. France
8.3.3. U.K.
8.3.4. Italy
8.3.5. Spain
8.4. Asia-Pacific
8.4.1. Japan
8.4.2. China
8.4.3. India
8.5. South America
8.5.1. Brazil
8.6. Middle East and Africa
8.6.1. UAE
8.6.2. South Africa
9. Global Smart Packaging Market-Competitive Landscape
9.1. Overview
9.2. Market Share of Key Players in the Smart Packaging Market
9.2.1. Global Company Market Share
9.2.2. North America Company Market Share
9.2.3. Europe Company Market Share
9.2.4. APAC Company Market Share
9.3. Competitive Situations and Trends
9.3.1. Product Launches and Developments
9.3.2. Partnerships, Collaborations, and Agreements
9.3.3. Mergers & Acquisitions
9.3.4. Expansions
10. Company Profiles
10.1. 3M
10.1.1. Business Overview
10.1.2. Company Snapshot
10.1.3. Company Market Share Analysis
10.1.4. Company Product Portfolio
10.1.5. Recent Developments
10.1.6. SWOT Analysis
10.2. Amcor Plc
10.2.1. Business Overview
10.2.2. Company Snapshot
10.2.3. Company Market Share Analysis
10.2.4. Company Product Portfolio
10.2.5. Recent Developments
10.2.6. SWOT Analysis
10.3. Avery Dennison Corporation
10.3.1. Business Overview
10.3.2. Company Snapshot
10.3.3. Company Market Share Analysis
10.3.4. Company Product Portfolio
10.3.5. Recent Developments
10.3.6. SWOT Analysis
10.4. Ball Corporation
10.4.1. Business Overview
10.4.2. Company Snapshot
10.4.3. Company Market Share Analysis
10.4.4. Company Product Portfolio
10.4.5. Recent Developments
10.4.6. SWOT Analysis
10.5. BASF SE
10.5.1. Business Overview
10.5.2. Company Snapshot
10.5.3. Company Market Share Analysis
10.5.4. Company Product Portfolio
10.5.5. Recent Developments
10.5.6. SWOT Analysis
10.6. Huhtamaki PPL Ltd
10.6.1. Business Overview
10.6.2. Company Snapshot
10.6.3. Company Market Share Analysis
10.6.4. Company Product Portfolio
10.6.5. Recent Developments
10.6.6. SWOT Analysis
10.7. International Paper
10.7.1. Business Overview
10.7.2. Company Snapshot
10.7.3. Company Market Share Analysis
10.7.4. Company Product Portfolio
10.7.5. Recent Developments
10.7.6. SWOT Analysis
10.8. Sealed Air Corporation
10.8.1. Business Overview
10.8.2. Company Snapshot
10.8.3. Company Market Share Analysis
10.8.4. Company Product Portfolio
10.8.5. Recent Developments
10.8.6. SWOT Analysis
10.9. Sysco Corporation
10.9.1. Business Overview
10.9.2. Company Snapshot
10.9.3. Company Market Share Analysis
10.9.4. Company Product Portfolio
10.9.5. Recent Developments
10.9.6. SWOT Analysis
10.10. Zebra Technologies Corporation
10.10.1. Business Overview
10.10.2. Company Snapshot
10.10.3. Company Market Share Analysis
10.10.4. Company Component Portfolio
10.10.5. Recent Developments
10.10.6. SWOT Analysis
List of Table
1. Global Smart Packaging Market, By Type, 2020-2033 (USD Billion)
2. Global Active Packaging Smart Packaging Market, By Region, 2020-2033 (USD Billion)
3. Global Intelligent Packaging Smart Packaging Market, By Region, 2020-2033 (USD Billion)
4. Global Modified Atmosphere Packaging Smart Packaging Market, By Region, 2020-2033 (USD Billion)
5. Global Smart Packaging Market, By End User, 2020-2033 (USD Billion)
6. Global Food and Beverages Smart Packaging Market, By Region, 2020-2033 (USD Billion)
7. Global Automotive Smart Packaging Market, By Region, 2020-2033 (USD Billion)
8. Global Personal Care Smart Packaging Market, By Region, 2020-2033 (USD Billion)
9. Global Pharmaceuticals and Healthcare Smart Packaging Market, By Region, 2020-2033 (USD Billion)
10. Global Others Smart Packaging Market, By Region, 2020-2033 (USD Billion)
11. Global Smart Packaging Market, By Region, 2020-2033 (USD Billion)
12. North America Smart Packaging Market, By Type, 2020-2033 (USD Billion)
13. North America Smart Packaging Market, By End User, 2020-2033 (USD Billion)
14. U.S. Smart Packaging Market, By Type, 2020-2033 (USD Billion)
15. U.S. Smart Packaging Market, By End User, 2020-2033 (USD Billion)
16. Canada Smart Packaging Market, By Type, 2020-2033 (USD Billion)
17. Canada Smart Packaging Market, By End User, 2020-2033 (USD Billion)
18. Mexico Smart Packaging Market, By Type, 2020-2033 (USD Billion)
19. Mexico Smart Packaging Market, By End User, 2020-2033 (USD Billion)
20. Europe Smart Packaging Market, By Type, 2020-2033 (USD Billion)
21. Europe Smart Packaging Market, By End User, 2020-2033 (USD Billion)
22. Germany Smart Packaging Market, By Type, 2020-2033 (USD Billion)
23. Germany Smart Packaging Market, By End User, 2020-2033 (USD Billion)
24. France Smart Packaging Market, By Type, 2020-2033 (USD Billion)
25. France Smart Packaging Market, By End User, 2020-2033 (USD Billion)
26. U.K. Smart Packaging Market, By Type, 2020-2033 (USD Billion)
27. U.K. Smart Packaging Market, By End User, 2020-2033 (USD Billion)
28. Italy Smart Packaging Market, By Type, 2020-2033 (USD Billion)
29. Italy Smart Packaging Market, By End User, 2020-2033 (USD Billion)
30. Spain Smart Packaging Market, By Type, 2020-2033 (USD Billion)
31. Spain Smart Packaging Market, By End User, 2020-2033 (USD Billion)
32. Asia Pacific Smart Packaging Market, By Type, 2020-2033 (USD Billion)
33. Asia Pacific Smart Packaging Market, By End User, 2020-2033 (USD Billion)
34. Japan Smart Packaging Market, By Type, 2020-2033 (USD Billion)
35. Japan Smart Packaging Market, By End User, 2020-2033 (USD Billion)
36. China Smart Packaging Market, By Type, 2020-2033 (USD Billion)
37. China Smart Packaging Market, By End User, 2020-2033 (USD Billion)
38. India Smart Packaging Market, By Type, 2020-2033 (USD Billion)
39. India Smart Packaging Market, By End User, 2020-2033 (USD Billion)
40. South America Smart Packaging Market, By Type, 2020-2033 (USD Billion)
41. South America Smart Packaging Market, By End User, 2020-2033 (USD Billion)
42. Brazil Smart Packaging Market, By Type, 2020-2033 (USD Billion)
43. Brazil Smart Packaging Market, By End User, 2020-2033 (USD Billion)
44. Middle East and Africa Smart Packaging Market, By Type, 2020-2033 (USD Billion)
45. Middle East and Africa Smart Packaging Market, By End User, 2020-2033 (USD Billion)
46. UAE Smart Packaging Market, By Type, 2020-2033 (USD Billion)
47. UAE Smart Packaging Market, By End User, 2020-2033 (USD Billion)
48. South Africa Smart Packaging Market, By Type, 2020-2033 (USD Billion)
49. South Africa Smart Packaging Market, By End User, 2020-2033 (USD Billion)
List of Figures
1. Global Smart Packaging Market Segmentation
2. Smart Packaging Market: Research Methodology
3. Market Size Estimation Methodology: Bottom-Up Approach
4. Market Size Estimation Methodology: Top-Down Approach
5. Data Triangulation
6. Porter’s Five Forces Analysis
7. Value Chain Analysis
8. Global Smart Packaging Market Attractiveness Analysis By Type
9. Global Smart Packaging Market Attractiveness Analysis By End User
10. Global Smart Packaging Market Attractiveness Analysis By Region
11. Global Smart Packaging Market: Dynamics
12. Global Smart Packaging Market Share by Type (2023 & 2033)
13. Global Smart Packaging Market Share by End User (2023 & 2033)
14. Global Smart Packaging Market Share by Regions (2023 & 2033)
15. Global Smart Packaging Market Share by Company (2023)
This study forecasts revenue at global, regional, and country levels from 2020 to 2033. The Brainy Insights has segmented the global smart packaging market based on below mentioned segments:
Global Smart Packaging Market by Type:
Global Smart Packaging Market by End User:
Global Smart Packaging Market by Region:
Research has its special purpose to undertake marketing efficiently. In this competitive scenario, businesses need information across all industry verticals; the information about customer wants, market demand, competition, industry trends, distribution channels etc. This information needs to be updated regularly because businesses operate in a dynamic environment. Our organization, The Brainy Insights incorporates scientific and systematic research procedures in order to get proper market insights and industry analysis for overall business success. The analysis consists of studying the market from a miniscule level wherein we implement statistical tools which helps us in examining the data with accuracy and precision.
Our research reports feature both; quantitative and qualitative aspects for any market. Qualitative information for any market research process are fundamental because they reveal the customer needs and wants, usage and consumption for any product/service related to a specific industry. This in turn aids the marketers/investors in knowing certain perceptions of the customers. Qualitative research can enlighten about the different product concepts and designs along with unique service offering that in turn, helps define marketing problems and generate opportunities. On the other hand, quantitative research engages with the data collection process through interviews, e-mail interactions, surveys and pilot studies. Quantitative aspects for the market research are useful to validate the hypotheses generated during qualitative research method, explore empirical patterns in the data with the help of statistical tools, and finally make the market estimations.
The Brainy Insights offers comprehensive research and analysis, based on a wide assortment of factual insights gained through interviews with CXOs and global experts and secondary data from reliable sources. Our analysts and industry specialist assume vital roles in building up statistical tools and analysis models, which are used to analyse the data and arrive at accurate insights with exceedingly informative research discoveries. The data provided by our organization have proven precious to a diverse range of companies, facilitating them to address issues such as determining which products/services are the most appealing, whether or not customers use the product in the manner anticipated, the purchasing intentions of the market and many others.
Our research methodology encompasses an idyllic combination of primary and secondary initiatives. Key phases involved in this process are listed below:

The phase involves the gathering and collecting of market data and its related information with the help of different sources & research procedures.

The data procurement stage involves in data gathering and collecting through various data sources.
This stage involves in extensive research. These data sources includes:
Purchased Database: Purchased databases play a crucial role in estimating the market sizes irrespective of the domain. Our purchased database includes:
Primary Research: The Brainy Insights interacts with leading companies and experts of the concerned domain to develop the analyst team’s market understanding and expertise. It improves and substantiates every single data presented in the market reports. Primary research mainly involves in telephonic interviews, E-mail interactions and face-to-face interviews with the raw material providers, manufacturers/producers, distributors, & independent consultants. The interviews that we conduct provides valuable data on market size and industry growth trends prevailing in the market. Our organization also conducts surveys with the various industry experts in order to gain overall insights of the industry/market. For instance, in healthcare industry we conduct surveys with the pharmacists, doctors, surgeons and nurses in order to gain insights and key information of a medical product/device/equipment which the customers are going to usage. Surveys are conducted in the form of questionnaire designed by our own analyst team. Surveys plays an important role in primary research because surveys helps us to identify the key target audiences of the market. Additionally, surveys helps to identify the key target audience engaged with the market. Our survey team conducts the survey by targeting the key audience, thus gaining insights from them. Based on the perspectives of the customers, this information is utilized to formulate market strategies. Moreover, market surveys helps us to understand the current competitive situation of the industry. To be precise, our survey process typically involve with the 360 analysis of the market. This analytical process begins by identifying the prospective customers for a product or service related to the market/industry to obtain data on how a product/service could fit into customers’ lives.

Secondary Research: The secondary data sources includes information published by the on-profit organizations such as World bank, WHO, company fillings, investor presentations, annual reports, national government documents, statistical databases, blogs, articles, white papers and others. From the annual report, we analyse a company’s revenue to understand the key segment and market share of that organization in a particular region. We analyse the company websites and adopt the product mapping technique which is important for deriving the segment revenue. In the product mapping method, we select and categorize the products offered by the companies catering to domain specific market, deduce the product revenue for each of the companies so as to get overall estimation of the market size. We also source data and analyses trends based on information received from supply side and demand side intermediaries in the value chain. The supply side denotes the data gathered from supplier, distributor, wholesaler and the demand side illustrates the data gathered from the end customers for respective market domain.

The supply side for a domain specific market is analysed by:
The demand side for the market is estimated through:
In-house Library: Apart from these third-party sources, we have our in-house library of qualitative and quantitative information. Our in-house database includes market data for various industry and domains. These data are updated on regular basis as per the changing market scenario. Our library includes, historic databases, internal audit reports and archives.
Sometimes there are instances where there is no metadata or raw data available for any domain specific market. For those cases, we use our expertise to forecast and estimate the market size in order to generate comprehensive data sets. Our analyst team adopt a robust research technique in order to produce the estimates:
Data Synthesis: This stage involves the analysis & mapping of all the information obtained from the previous step. It also involves in scrutinizing the data for any discrepancy observed while data gathering related to the market. The data is collected with consideration to the heterogeneity of sources. Robust scientific techniques are in place for synthesizing disparate data sets and provide the essential contextual information that can orient market strategies. The Brainy Insights has extensive experience in data synthesis where the data passes through various stages:


Market Deduction & Formulation: The final stage comprises of assigning data points at appropriate market spaces so as to deduce feasible conclusions. Analyst perspective & subject matter expert based holistic form of market sizing coupled with industry analysis also plays a crucial role in this stage.
This stage involves in finalization of the market size and numbers that we have collected from data integration step. With data interpolation, it is made sure that there is no gap in the market data. Successful trend analysis is done by our analysts using extrapolation techniques, which provide the best possible forecasts for the market.
Data Validation & Market Feedback: Validation is the most important step in the process. Validation & re-validation via an intricately designed process helps us finalize data-points to be used for final calculations.

The Brainy Insights interacts with leading companies and experts of the concerned domain to develop the analyst team’s market understanding and expertise. It improves and substantiates every single data presented in the market reports. The data validation interview and discussion panels are typically composed of the most experienced industry members. The participants include, however, are not limited to:
Moreover, we always validate our data and findings through primary respondents from all the major regions we are working on.


Free Customization
Fortune 500 Clients
Free Yearly Update On Purchase Of Multi/Corporate License
Companies Served Till Date