- +1-315-215-1633
- sales@thebrainyinsights.com

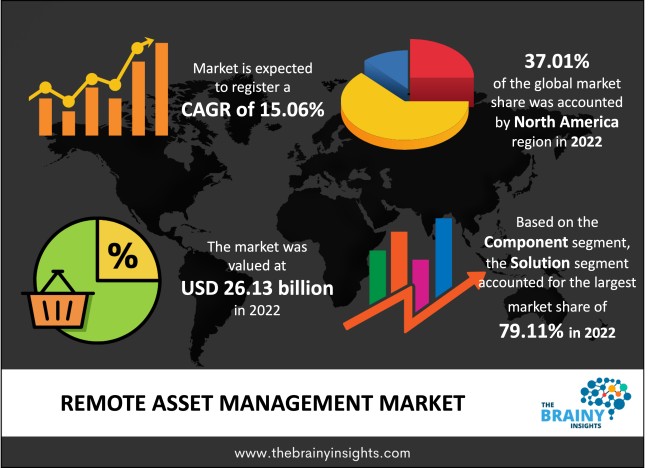
The global remote asset management market was valued at USD 26.13 Billion in 2022 and grew at a CAGR of 15.06% from 2023 to 2032. The market is expected to reach USD 106.26 Billion by 2032. The demand for remote asset management solutions and services is increasing among different end-user industries, such as manufacturing, logistics and transportation, healthcare, and retail, which is driving the use of such software. Further, increasing investment in the Internet of Things will provide lucrative opportunities to the market.
For industries with a high concentration of assets, remote asset management solutions are a combination of technologies and procedures that centrally combine monitoring, tracking, and diagnostics so that they may monitor their assets and improve operational efficiency. Maximizing asset utilization, throughput, and return on investment is the main goal of such solutions. The features of remote asset management solutions may include tracking the whereabouts of assets, getting alerts when maintenance is required, and remotely adjusting operational settings. Using remote asset management software can also aid businesses in enforcing internal compliance or ensuring that staff members follow the rules set forth by organizations to safeguard their fixed assets.
Get an overview of this study by requesting a free sample
Increasing use of remote asset management among industries: For asset-intensive businesses like oil & gas, power, transportation, supply chain, etc., it offers a consolidated asset perspective. For better asset performance, the solution enables the end-users to monitor several characteristics, including humidity, temperature, battery and power usage, and orientation. It is a one-stop shop for smart asset management that enables the user to monitor the assets' status and usage in real time. Advanced sensor-based functions are used by the real-time asset-tracking solution to deliver quick and useful insights. Even when using various assets, the IoT-based asset management system offers rapid filtering so the customer can check their status in real time and usage patterns. All of this is documented and saved on a safe cloud platform, making it simple to access the asset information.
High investment: Remote asset management with all the features is a more expensive system that costs over $15,000. The midrange ones average around $500 per month. However, it has limited features and does not serve the organization's complete requirements. In addition to this, regularly scheduled software updates are necessary, which adds to the overall cost that the company is spending.
Rising investment in the IoT industry: The Internet of Things is entering the mainstream of commercial use after years of anticipation. Business use of IoT technologies has climbed from 13% in 2014 to roughly 25%. Furthermore, it is predicted that by 2023, there will be around 43 billion IoT-based devices worldwide. The evolving technologies that support the IoT are both a cause and a motivation for this degree of adoption. The main benefit of technological development is that IoT technology will become simpler to install, allowing a wider range of businesses to take advantage of IoT applications. Remote asset management, integrated into IoT devices, will continue to become increasingly affordable, sophisticated, and accessible.
The regions analyzed for the market include North America, Europe, South America, Asia Pacific, the Middle East, and Africa. North America emerged as the most significant Remote Asset Management market, with a 37.01% market revenue share in 2022.
North America region will account for the largest market share with revenue growth. Nations such as the U.S., Canada and Mexico have a tremendous demand for remote asset management due to well-developed logistics infrastructure, transportation and manufacturing facilities. The presence of major e-commerce and logistics companies has led to a higher demand for remote asset management in the region. The regional agencies support initiatives for integrating remote asset management in several industries. Further, industries are investing in cloud-based solutions and big data analytics, providing lucrative opportunities for remote asset management.
North America region Remote Asset Management Market Share in 2022 - 37.01%
www.thebrainyinsights.com
Check the geographical analysis of this market by requesting a free sample
The component segment is divided into solutions and services. The solution segment further includes asset performance management, real-time location systems, surveillance & security, analytics & reporting and others. The solution segment dominated the market, with a share of around 79.11% in 2022. The remote asset monitoring and management solution aims to simplify remote operations and maintenance chores using IoT technologies. The IoT-based remote asset monitoring and management solution can use these sensors' data to determine whether the received figures are above or below the predetermined values.
The deployment mode segment is divided into on-premises and cloud. The on-premises segment dominated the market, with a share of around 67.29% in 2022. On-premise refers to all software, hardware, and servers inside the organization's buildings. Data security is something that the company must consider while using on-premises asset management.
The asset types segment is divided into mobile asset and fixed asset. The fixed asset segment dominated the market, with a share of around 69.35% in 2022. Organizations can keep an eye on their machinery, evaluate their state, and keep them in excellent operating order with the help of fixed asset management.
The end-users segment is divided into manufacturing, building automation, retail, healthcare, transportation & logistics, energy & utility and others. The manufacturing segment dominated the market, with a share of around 29.81% in 2022. Manufacturing businesses have made asset management their primary concern because these factors are mostly responsible for their overall productivity and performance.
| Attribute | Description |
|---|---|
| Market Size | Revenue (USD Billion) |
| Market size value in 2022 | USD 26.13 Billion |
| Market size value in 2032 | USD 106.26 Billion |
| CAGR (2023 to 2032) | 15.06% |
| Historical data | 2019-2021 |
| Base Year | 2022 |
| Forecast | 2023-2032 |
| Region | The regions analyzed for the market are Asia Pacific, Europe, South America, North America, and Middle East & Africa. Furthermore, the regions are further analyzed at the country level. |
| Segments | Component, Deployment Mode, Asset Types and End-users |
As per The Brainy Insights, the size of the remote asset management market was valued USD 26.13 billion in 2022 to USD 106.26 billion by 2032.
Global remote asset management market is growing at a CAGR of 15.06% during the forecast period 2023-2032.
North America region emerged as the largest market for the remote asset management.
The market's growth will be influenced by the rising usage of remote asset management solutions across industries.
The high cost of installation can hamper the market growth.
The rising growth of IoT industry is providing lucrative opportunities to the market.
1. Introduction
1.1. Objectives of the Study
1.2. Market Definition
1.3. Research Scope
1.4. Currency
1.5. Key Target Audience
2. Research Methodology and Assumptions
3. Executive Summary
4. Premium Insights
4.1. Porter’s Five Forces Analysis
4.2. Value Chain Analysis
4.3. Top Investment Pockets
4.3.1. Market Attractiveness Analysis by Component
4.3.2. Market Attractiveness Analysis by Deployment Mode
4.3.3. Market Attractiveness Analysis by Asset Types
4.3.4. Market Attractiveness Analysis by End-users
4.3.5. Market Attractiveness Analysis by Region
4.4. Industry Trends
5. Market Dynamics
5.1. Market Evaluation
5.2. Drivers
5.2.1. Increasing usage of remote asset management in different end-users
5.3. Restraints
5.3.1. High instalment cost
5.4. Opportunities
5.4.1. Increasing growth of IoT industry
5.5. Challenges
5.5.1. Lack of required infrastructure
6. Global Remote Asset Management Market Analysis and Forecast, By Component
6.1. Segment Overview
6.2. Solution
6.2.1. Asset Performance Management
6.2.2. Real Time Location System
6.2.3. Surveillance & Security
6.2.4. Analytics & Reporting
6.2.5. Others
6.3. Services
7. Global Remote Asset Management Market Analysis and Forecast, By Deployment Mode
7.1. Segment Overview
7.2. On-Premises
7.3. Cloud
8. Global Remote Asset Management Market Analysis and Forecast, By Asset Types
8.1. Segment Overview
8.2. Mobile Asset
8.3. Fixed Asset
9. Global Remote Asset Management Market Analysis and Forecast, By End-users
9.1. Segment Overview
9.2. Manufacturing
9.3. Building Automation
9.4. Retail
9.5. Healthcare
9.6. Transportation & Logistics
9.7. Energy & Utility
9.8. Others
10. Global Remote Asset Management Market Analysis and Forecast, By Regional Analysis
10.1. Segment Overview
10.2. North America
10.2.1. U.S.
10.2.2. Canada
10.2.3. Mexico
10.3. Europe
10.3.1. Germany
10.3.2. France
10.3.3. U.K.
10.3.4. Italy
10.3.5. Spain
10.4. Asia-Pacific
10.4.1. Japan
10.4.2. China
10.4.3. India
10.5. South America
10.5.1. Brazil
10.6. Middle East and Africa
10.6.1. UAE
10.6.2. South Africa
11. Global Remote Asset Management Market-Competitive Landscape
11.1. Overview
11.2. Market Share of Key Players in the Remote Asset Management Market
11.2.1. Global Company Market Share
11.2.2. North America Company Market Share
11.2.3. Europe Company Market Share
11.2.4. APAC Company Market Share
11.3. Competitive Situations and Trends
11.3.1. Product Launches and Developments
11.3.2. Partnerships, Collaborations, and Agreements
11.3.3. Mergers & Acquisitions
11.3.4. Expansions
12. Company Profiles
12.1. Accruent
12.1.1. Business Overview
12.1.2. Company Snapshot
12.1.3. Company Market Share Analysis
12.1.4. Company Product Portfolio
12.1.5. Recent Developments
12.1.6. SWOT Analysis
12.2. AT&T
12.2.1. Business Overview
12.2.2. Company Snapshot
12.2.3. Company Market Share Analysis
12.2.4. Company Product Portfolio
12.2.5. Recent Developments
12.2.6. SWOT Analysis
12.3. Ascent Intellimation Pvt. Ltd.
12.3.1. Business Overview
12.3.2. Company Snapshot
12.3.3. Company Market Share Analysis
12.3.4. Company Product Portfolio
12.3.5. Recent Developments
12.3.6. SWOT Analysis
12.4. Bosch.IO
12.4.1. Business Overview
12.4.2. Company Snapshot
12.4.3. Company Market Share Analysis
12.4.4. Company Product Portfolio
12.4.5. Recent Developments
12.4.6. SWOT Analysis
12.5. EAMbrace
12.5.1. Business Overview
12.5.2. Company Snapshot
12.5.3. Company Market Share Analysis
12.5.4. Company Product Portfolio
12.5.5. Recent Developments
12.5.6. SWOT Analysis
12.6. Cisco Systems, Inc.
12.6.1. Business Overview
12.6.2. Company Snapshot
12.6.3. Company Market Share Analysis
12.6.4. Company Product Portfolio
12.6.5. Recent Developments
12.6.6. SWOT Analysis
12.7. IBM Corporation
12.7.1. Business Overview
12.7.2. Company Snapshot
12.7.3. Company Market Share Analysis
12.7.4. Company Product Portfolio
12.7.5. Recent Developments
12.7.6. SWOT Analysis
12.8. Hitachi Ltd.
12.8.1. Business Overview
12.8.2. Company Snapshot
12.8.3. Company Market Share Analysis
12.8.4. Company Product Portfolio
12.8.5. Recent Developments
12.8.6. SWOT Analysis
12.9. Infosys Limited
12.9.1. Business Overview
12.9.2. Company Snapshot
12.9.3. Company Market Share Analysis
12.9.4. Company Product Portfolio
12.9.5. Recent Developments
12.9.6. SWOT Analysis
12.10. PTC
12.10.1. Business Overview
12.10.2. Company Snapshot
12.10.3. Company Market Share Analysis
12.10.4. Company Product Portfolio
12.10.5. Recent Developments
12.10.6. SWOT Analysis
12.11. Meridium Inc.
12.11.1. Business Overview
12.11.2. Company Snapshot
12.11.3. Company Market Share Analysis
12.11.4. Company Product Portfolio
12.11.5. Recent Developments
12.11.6. SWOT Analysis
12.12. RapidValue Solutions
12.12.1. Business Overview
12.12.2. Company Snapshot
12.12.3. Company Market Share Analysis
12.12.4. Company Product Portfolio
12.12.5. Recent Developments
12.12.6. SWOT Analysis
12.13. ROAMWORKS
12.13.1. Business Overview
12.13.2. Company Snapshot
12.13.3. Company Market Share Analysis
12.13.4. Company Product Portfolio
12.13.5. Recent Developments
12.13.6. SWOT Analysis
12.14. RCS Technologies
12.14.1. Business Overview
12.14.2. Company Snapshot
12.14.3. Company Market Share Analysis
12.14.4. Company Product Portfolio
12.14.5. Recent Developments
12.14.6. SWOT Analysis
12.15. Rockwell Automation, Inc.
12.15.1. Business Overview
12.15.2. Company Snapshot
12.15.3. Company Market Share Analysis
12.15.4. Company Product Portfolio
12.15.5. Recent Developments
12.15.6. SWOT Analysis
12.16. Schneider Electric
12.16.1. Business Overview
12.16.2. Company Snapshot
12.16.3. Company Market Share Analysis
12.16.4. Company Product Portfolio
12.16.5. Recent Developments
12.16.6. SWOT Analysis
12.17. SAP
12.17.1. Business Overview
12.17.2. Company Snapshot
12.17.3. Company Market Share Analysis
12.17.4. Company Product Portfolio
12.17.5. Recent Developments
12.17.6. SWOT Analysis
12.18. Siemens AG
12.18.1. Business Overview
12.18.2. Company Snapshot
12.18.3. Company Market Share Analysis
12.18.4. Company Product Portfolio
12.18.5. Recent Developments
12.18.6. SWOT Analysis
12.19. Vodafone Group
12.19.1. Business Overview
12.19.2. Company Snapshot
12.19.3. Company Market Share Analysis
12.19.4. Company Product Portfolio
12.19.5. Recent Developments
12.19.6. SWOT Analysis
12.20. Verizon
12.20.1. Business Overview
12.20.2. Company Snapshot
12.20.3. Company Market Share Analysis
12.20.4. Company Product Portfolio
12.20.5. Recent Developments
12.20.6. SWOT Analysis
List of Table
1. Global Remote Asset Management Market, By Component, 2019-2032 (USD Billion)
2. Global Solution, Remote Asset Management Market, By Region, 2019-2032 (USD Billion)
3. Global Services, Remote Asset Management Market, By Region, 2019-2032 (USD Billion)
4. Global Remote Asset Management Market, By Deployment Mode, 2019-2032 (USD Billion)
5. Global On-premises, Remote Asset Management Market, By Region, 2019-2032 (USD Billion)
6. Global Cloud, Remote Asset Management Market, By Region, 2019-2032 (USD Billion)
7. Global Remote Asset Management Market, By Asset Types, 2019-2032 (USD Billion)
8. Global Mobile Asset, Remote Asset Management Market, By Region, 2019-2032 (USD Billion)
9. Global Fixed Asset, Remote Asset Management Market, By Region, 2019-2032 (USD Billion)
10. Global Remote Asset Management Market, By End-users, 2019-2032 (USD Billion)
11. Global Manufacturing, Remote Asset Management Market, By Region, 2019-2032 (USD Billion)
12. Global Building Automation, Remote Asset Management Market, By Region, 2019-2032 (USD Billion)
13. Global Retail, Remote Asset Management Market, By Region, 2019-2032 (USD Billion)
14. Global Healthcare, Remote Asset Management Market, By Region, 2019-2032 (USD Billion)
15. Global Transportation & Logistics, Remote Asset Management Market, By Region, 2019-2032 (USD Billion)
16. Global Energy & Utility, Remote Asset Management Market, By Region, 2019-2032 (USD Billion)
17. Global Others, Remote Asset Management Market, By Region, 2019-2032 (USD Billion)
18. Global Remote Asset Management Market, By Region, 2019-2032 (USD Billion)
19. North America Remote Asset Management Market, By Component, 2019-2032 (USD Billion)
20. North America Remote Asset Management Market, By Deployment Mode, 2019-2032 (USD Billion)
21. North America Remote Asset Management Market, By Asset Types, 2019-2032 (USD Billion)
22. North America Remote Asset Management Market, By End-users, 2019-2032 (USD Billion)
23. U.S. Remote Asset Management Market, By Component, 2019-2032 (USD Billion)
24. U.S. Remote Asset Management Market, By Deployment Mode, 2019-2032 (USD Billion)
25. U.S. Remote Asset Management Market, By Asset Types, 2019-2032 (USD Billion)
26. U.S. Remote Asset Management Market, By End-users, 2019-2032 (USD Billion)
27. Canada Remote Asset Management Market, By Component, 2019-2032 (USD Billion)
28. Canada Remote Asset Management Market, By Deployment Mode, 2019-2032 (USD Billion)
29. Canada Remote Asset Management Market, By Asset Types, 2019-2032 (USD Billion)
30. Canada Remote Asset Management Market, By End-users, 2019-2032 (USD Billion)
31. Mexico Remote Asset Management Market, By Component, 2019-2032 (USD Billion)
32. Mexico Remote Asset Management Market, By Deployment Mode, 2019-2032 (USD Billion)
33. Mexico Remote Asset Management Market, By Asset Types, 2019-2032 (USD Billion)
34. Mexico Remote Asset Management Market, By End-users, 2019-2032 (USD Billion)
35. Europe Remote Asset Management Market, By Component, 2019-2032 (USD Billion)
36. Europe Remote Asset Management Market, By Deployment Mode, 2019-2032 (USD Billion)
37. Europe Remote Asset Management Market, By Asset Types, 2019-2032 (USD Billion)
38. Europe Remote Asset Management Market, By End-users, 2019-2032 (USD Billion)
39. Germany Remote Asset Management Market, By Component, 2019-2032 (USD Billion)
40. Germany Remote Asset Management Market, By Deployment Mode, 2019-2032 (USD Billion)
41. Germany Remote Asset Management Market, By Asset Types, 2019-2032 (USD Billion)
42. Germany Remote Asset Management Market, By End-users, 2019-2032 (USD Billion)
43. France Remote Asset Management Market, By Component, 2019-2032 (USD Billion)
44. France Remote Asset Management Market, By Deployment Mode, 2019-2032 (USD Billion)
45. France Remote Asset Management Market, By Asset Types, 2019-2032 (USD Billion)
46. France Remote Asset Management Market, By End-users, 2019-2032 (USD Billion)
47. U.K. Remote Asset Management Market, By Component, 2019-2032 (USD Billion)
48. U.K. Remote Asset Management Market, By Deployment Mode, 2019-2032 (USD Billion)
49. U.K. Remote Asset Management Market, By Asset Types, 2019-2032 (USD Billion)
50. U.K. Remote Asset Management Market, By End-users, 2019-2032 (USD Billion)
51. Italy Remote Asset Management Market, By Component, 2019-2032 (USD Billion)
52. Italy Remote Asset Management Market, By Deployment Mode, 2019-2032 (USD Billion)
53. Italy Remote Asset Management Market, By Asset Types, 2019-2032 (USD Billion)
54. Italy Remote Asset Management Market, By End-users, 2019-2032 (USD Billion)
55. Spain Remote Asset Management Market, By Component, 2019-2032 (USD Billion)
56. Spain Remote Asset Management Market, By Deployment Mode, 2019-2032 (USD Billion)
57. Spain Remote Asset Management Market, By Asset Types, 2019-2032 (USD Billion)
58. Spain Remote Asset Management Market, By End-users, 2019-2032 (USD Billion)
59. Asia Pacific Remote Asset Management Market, By Component, 2019-2032 (USD Billion)
60. Asia Pacific Remote Asset Management Market, By Deployment Mode, 2019-2032 (USD Billion)
61. Asia Pacific Remote Asset Management Market, By Asset Types, 2019-2032 (USD Billion)
62. Asia Pacific Remote Asset Management Market, By End-users, 2019-2032 (USD Billion)
63. Japan Remote Asset Management Market, By Component, 2019-2032 (USD Billion)
64. Japan Remote Asset Management Market, By Deployment Mode, 2019-2032 (USD Billion)
65. Japan Remote Asset Management Market, By Asset Types, 2019-2032 (USD Billion)
66. Japan Remote Asset Management Market, By End-users, 2019-2032 (USD Billion)
67. China Remote Asset Management Market, By Component, 2019-2032 (USD Billion)
68. China Remote Asset Management Market, By Deployment Mode, 2019-2032 (USD Billion)
69. China Remote Asset Management Market, By Asset Types, 2019-2032 (USD Billion)
70. China Remote Asset Management Market, By End-users, 2019-2032 (USD Billion)
71. India Remote Asset Management Market, By Component, 2019-2032 (USD Billion)
72. India Remote Asset Management Market, By Deployment Mode, 2019-2032 (USD Billion)
73. India Remote Asset Management Market, By Asset Types, 2019-2032 (USD Billion)
74. India Remote Asset Management Market, By End-users, 2019-2032 (USD Billion)
75. South America Remote Asset Management Market, By Component, 2019-2032 (USD Billion)
76. South America Remote Asset Management Market, By Deployment Mode, 2019-2032 (USD Billion)
77. South America Remote Asset Management Market, By Asset Types, 2019-2032 (USD Billion)
78. South America Remote Asset Management Market, By End-users, 2019-2032 (USD Billion)
79. Brazil Remote Asset Management Market, By Component, 2019-2032 (USD Billion)
80. Brazil Remote Asset Management Market, By Deployment Mode, 2019-2032 (USD Billion)
81. Brazil Remote Asset Management Market, By Asset Types, 2019-2032 (USD Billion)
82. BrazilRemote Asset Management Market, By End-users, 2019-2032 (USD Billion)
83. Middle East and Africa Remote Asset Management Market, By Component, 2019-2032 (USD Billion)
84. Middle East and Africa Remote Asset Management Market, By Deployment Mode, 2019-2032 (USD Billion)
85. Middle East and Africa Remote Asset Management Market, By Asset Types, 2019-2032 (USD Billion)
86. Middle East and Africa Remote Asset Management Market, By End-users, 2019-2032 (USD Billion)
87. UAE Remote Asset Management Market, By Component, 2019-2032 (USD Billion)
88. UAE Remote Asset Management Market, By Deployment Mode, 2019-2032 (USD Billion)
89. UAE Remote Asset Management Market, By Asset Types, 2019-2032 (USD Billion)
90. UAE Remote Asset Management Market, By End-users, 2019-2032 (USD Billion)
91. South Africa Remote Asset Management Market, By Component, 2019-2032 (USD Billion)
92. South Africa Remote Asset Management Market, By Deployment Mode, 2019-2032 (USD Billion)
93. South Africa Remote Asset Management Market, By Asset Types, 2019-2032 (USD Billion)
94. South Africa Remote Asset Management Market, By End-users, 2019-2032 (USD Billion)
List of Figures
1. Global Remote Asset Management Market Segmentation
2. Remote Asset Management Market: Research Methodology
3. Market Size Estimation Methodology: Bottom-Up Approach
4. Market Size Estimation Methodology: Top-Down Approach
5. Data Triangulation
6. Porter’s Five Forces Analysis
7. Value Chain Analysis
8. Global Remote Asset Management Market Attractiveness Analysis by Component
9. Global Remote Asset Management Market Attractiveness Analysis by Deployment Mode
10. Global Remote Asset Management Market Attractiveness Analysis by Asset Types
11. Global Remote Asset Management Market Attractiveness Analysis by End-users
12. Global Remote Asset Management Market Attractiveness Analysis by Region
13. Global Remote Asset Management Market: Dynamics
14. Global Remote Asset Management Market Share by Component (2022 & 2032)
15. Global Remote Asset Management Market Share by Deployment Mode (2022 & 2032)
16. Global Remote Asset Management Market Share by Asset Types (2022 & 2032)
17. Global Remote Asset Management Market Share by End-users (2022 & 2032)
18. Global Remote Asset Management Market Share by Regions (2022 & 2032)
19. Global Remote Asset Management Market Share by Company (2022)
This study forecasts revenue at global, regional, and country levels from 2019 to 2032. The Brainy Insights has segmented the global remote asset management market based on below mentioned segments:
Global Remote Asset Management Market by Component:
Global Remote Asset Management Market by Deployment Mode:
Global Remote Asset Management Market by Asset Types:
Global Remote Asset Management Market by End-users:
Global Remote Asset Management Market by Region:
Research has its special purpose to undertake marketing efficiently. In this competitive scenario, businesses need information across all industry verticals; the information about customer wants, market demand, competition, industry trends, distribution channels etc. This information needs to be updated regularly because businesses operate in a dynamic environment. Our organization, The Brainy Insights incorporates scientific and systematic research procedures in order to get proper market insights and industry analysis for overall business success. The analysis consists of studying the market from a miniscule level wherein we implement statistical tools which helps us in examining the data with accuracy and precision.
Our research reports feature both; quantitative and qualitative aspects for any market. Qualitative information for any market research process are fundamental because they reveal the customer needs and wants, usage and consumption for any product/service related to a specific industry. This in turn aids the marketers/investors in knowing certain perceptions of the customers. Qualitative research can enlighten about the different product concepts and designs along with unique service offering that in turn, helps define marketing problems and generate opportunities. On the other hand, quantitative research engages with the data collection process through interviews, e-mail interactions, surveys and pilot studies. Quantitative aspects for the market research are useful to validate the hypotheses generated during qualitative research method, explore empirical patterns in the data with the help of statistical tools, and finally make the market estimations.
The Brainy Insights offers comprehensive research and analysis, based on a wide assortment of factual insights gained through interviews with CXOs and global experts and secondary data from reliable sources. Our analysts and industry specialist assume vital roles in building up statistical tools and analysis models, which are used to analyse the data and arrive at accurate insights with exceedingly informative research discoveries. The data provided by our organization have proven precious to a diverse range of companies, facilitating them to address issues such as determining which products/services are the most appealing, whether or not customers use the product in the manner anticipated, the purchasing intentions of the market and many others.
Our research methodology encompasses an idyllic combination of primary and secondary initiatives. Key phases involved in this process are listed below:

The phase involves the gathering and collecting of market data and its related information with the help of different sources & research procedures.

The data procurement stage involves in data gathering and collecting through various data sources.
This stage involves in extensive research. These data sources includes:
Purchased Database: Purchased databases play a crucial role in estimating the market sizes irrespective of the domain. Our purchased database includes:
Primary Research: The Brainy Insights interacts with leading companies and experts of the concerned domain to develop the analyst team’s market understanding and expertise. It improves and substantiates every single data presented in the market reports. Primary research mainly involves in telephonic interviews, E-mail interactions and face-to-face interviews with the raw material providers, manufacturers/producers, distributors, & independent consultants. The interviews that we conduct provides valuable data on market size and industry growth trends prevailing in the market. Our organization also conducts surveys with the various industry experts in order to gain overall insights of the industry/market. For instance, in healthcare industry we conduct surveys with the pharmacists, doctors, surgeons and nurses in order to gain insights and key information of a medical product/device/equipment which the customers are going to usage. Surveys are conducted in the form of questionnaire designed by our own analyst team. Surveys plays an important role in primary research because surveys helps us to identify the key target audiences of the market. Additionally, surveys helps to identify the key target audience engaged with the market. Our survey team conducts the survey by targeting the key audience, thus gaining insights from them. Based on the perspectives of the customers, this information is utilized to formulate market strategies. Moreover, market surveys helps us to understand the current competitive situation of the industry. To be precise, our survey process typically involve with the 360 analysis of the market. This analytical process begins by identifying the prospective customers for a product or service related to the market/industry to obtain data on how a product/service could fit into customers’ lives.

Secondary Research: The secondary data sources includes information published by the on-profit organizations such as World bank, WHO, company fillings, investor presentations, annual reports, national government documents, statistical databases, blogs, articles, white papers and others. From the annual report, we analyse a company’s revenue to understand the key segment and market share of that organization in a particular region. We analyse the company websites and adopt the product mapping technique which is important for deriving the segment revenue. In the product mapping method, we select and categorize the products offered by the companies catering to domain specific market, deduce the product revenue for each of the companies so as to get overall estimation of the market size. We also source data and analyses trends based on information received from supply side and demand side intermediaries in the value chain. The supply side denotes the data gathered from supplier, distributor, wholesaler and the demand side illustrates the data gathered from the end customers for respective market domain.

The supply side for a domain specific market is analysed by:
The demand side for the market is estimated through:
In-house Library: Apart from these third-party sources, we have our in-house library of qualitative and quantitative information. Our in-house database includes market data for various industry and domains. These data are updated on regular basis as per the changing market scenario. Our library includes, historic databases, internal audit reports and archives.
Sometimes there are instances where there is no metadata or raw data available for any domain specific market. For those cases, we use our expertise to forecast and estimate the market size in order to generate comprehensive data sets. Our analyst team adopt a robust research technique in order to produce the estimates:
Data Synthesis: This stage involves the analysis & mapping of all the information obtained from the previous step. It also involves in scrutinizing the data for any discrepancy observed while data gathering related to the market. The data is collected with consideration to the heterogeneity of sources. Robust scientific techniques are in place for synthesizing disparate data sets and provide the essential contextual information that can orient market strategies. The Brainy Insights has extensive experience in data synthesis where the data passes through various stages:


Market Deduction & Formulation: The final stage comprises of assigning data points at appropriate market spaces so as to deduce feasible conclusions. Analyst perspective & subject matter expert based holistic form of market sizing coupled with industry analysis also plays a crucial role in this stage.
This stage involves in finalization of the market size and numbers that we have collected from data integration step. With data interpolation, it is made sure that there is no gap in the market data. Successful trend analysis is done by our analysts using extrapolation techniques, which provide the best possible forecasts for the market.
Data Validation & Market Feedback: Validation is the most important step in the process. Validation & re-validation via an intricately designed process helps us finalize data-points to be used for final calculations.

The Brainy Insights interacts with leading companies and experts of the concerned domain to develop the analyst team’s market understanding and expertise. It improves and substantiates every single data presented in the market reports. The data validation interview and discussion panels are typically composed of the most experienced industry members. The participants include, however, are not limited to:
Moreover, we always validate our data and findings through primary respondents from all the major regions we are working on.


Free Customization
Fortune 500 Clients
Free Yearly Update On Purchase Of Multi/Corporate License
Companies Served Till Date