- +1-315-215-1633
- sales@thebrainyinsights.com

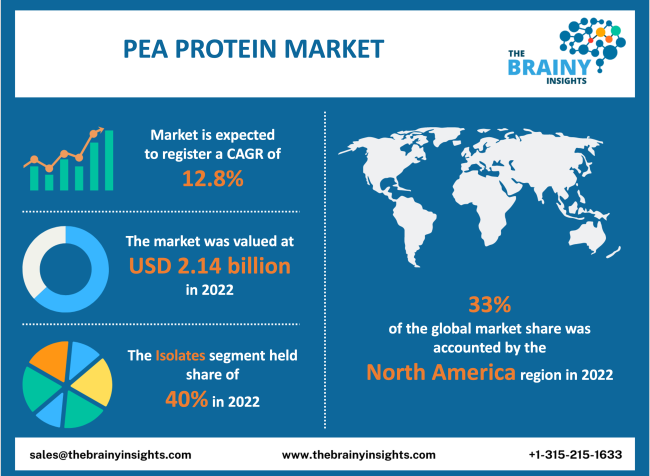
The global pea protein market was valued at USD 2.14 billion in 2022 and is anticipated to grow at a CAGR of 12.8% from 2022 to 2030. The global pea protein market is expected to reach USD 5.6 billion by 2030. The Asia Pacific is expected to grow the fastest during the forecast period.
Yellow and green split peas, also known as Pisum sativum, are a source of food products and protein supplements. It can be used in place of other food items or as a dietary supplement to help people consume more protein or other nutrients (e.g., the substitution of dairy milk for pea milk). It is utilized in food production as a powdered ingredient, such as a thickening, foaming agent, or emulsifier. A healthy diet and an active lifestyle are becoming increasingly popular among consumers, fuelling pea protein growth. Additionally, there is a huge market opportunity due to developing more products with targeted purposes, such as energy balancing, weight loss, muscle restoration, and satiety. Other peas, such as dry, green, and chickpeas, extract the protein. These peas are accessible as concentrates, textured foods, and isolates. Because they are produced using plant-based materials, these products are ideal for people who choose vegan diets. They are non-toxic, non-allergic, and easily digestive, and have numerous uses in beverages, meat substitutes, dietary supplements, and baked foods. The growing importance of a flexitarian diet due to growing worries about the cardiological effects of red meat consumption is anticipated to continue to be a positive factor for market expansion. Additionally, throughout the forecast period, it is expected that growing public awareness of the harmful consequences of foods containing both gluten and lactose will play a significant influence in boosting product demand. Over the forecast period, it is also anticipated that increasing consumer awareness of the benefits of consuming protein powder for supporting bone health and muscle growth would drive market expansion. Alternative components, including hemp, soy, and whey, threaten pea protein's dominance in the food industry. Another ingredient that has been gaining popularity around the world is rice protein. When compared nutritionally, rice and pea proteins have a similar amount of protein (15–22 grams, on average, grams calories), are free of gluten, and are suitable for people with allergies. Pea protein utilization has increased due to its advantages, including simple digestion and muscle-building stimulation.
Get an overview of this study by requesting a free sample
Growing vegan population – The increasing awareness among consumers for health-related issues and increasing demand for nutritious, food-rich, and high proteins drive the market's growth. Furthermore, the growing need for vegan food products and flexitarian populations adds impetus to the market's growth.
Rise in social media marketing- Pea protein supplements will experience growth over the forecast period due to several factors, including the expanding millennial demographic and more social media marketing. Promoting plant-based diets by budding social media artists and their endorsements will further fuel industry expansion.
Availability of low substitutes- The growth of the pea protein market gets hindered by the presence of inexpensive alternatives, bad press, and side effects of cheap quality products. Several local manufacturers do not use proper raw materials, which causes allergies among users consuming them. This hinders the market's growth as consumers' trust is broken.
Growing number of fitness centres – The rise in female participation and the expansion of fitness centre facilities are anticipated to drive market expansion over the forecast period. Environmentally safe pea proteins are available. Consumers prefer ecologically friendly and allergen-free products as they become more aware of the benefits of pea proteins. During the forecast period, there will be chances for growth due to rising demand for allergen-free pea protein products.
High cost- With the increased demand for pea protein, the cost is also rising. Most of the branded pea proteins available in the market are costly, which several consumers need help to afford. This challenges the market's growth.
The regions analyzed for the market include North America, Europe, South America, Asia Pacific, the Middle East, and Africa. North America emerged as the largest market for the global pea protein market, with a 33% market revenue share in 2022.
North America currently dominates the pea protein market. Over the forecast period, the market for pea protein in the North American region is anticipated to be driven by rising demand for gluten-free goods, increasing concerns about cardiovascular diseases (CVDs), and robust expansion in the sports nutrition sector. Furthermore, it is anticipated that the presence of significant meat product producers such as JBF, Tyson, National Foods, and Cargill in the U.S. will increase demand for the product as a texturizing agent in meat manufacturing. Furthermore, it is anticipated that the availability of grains like canola and soy as protein components will decrease due to rising grain use for bio-based chemicals.
The Asia Pacific is expected to be the fastest-growing region. Growing consumer demand for allergen-friendly sports & fitness supplements and meat alternatives is also anticipated to boost market expansion. An abundant supply of raw materials for the manufacturers will be produced due to favorable regulatory dispositions in China and India geared toward developing the agriculture industry. Because of easy access to raw materials and rising domestic consumption, China's food and beverage industry have a strong manufacturing base that is anticipated to drive regional market expansion. In addition, the evolution of the hotel and restaurant sector and the growth of retail chains, mainly supermarkets, are likely to be crucial in fostering the development of the food and beverage business and boosting product demand.
North America Region Pea Protein Market Share in 2022 - 33%
www.thebrainyinsights.com
Check the geographical analysis of this market by requesting a free sample
The product type segment is divided into isolates, concentrates, and textured. The isolates segment dominated, with a market share of around 40% in 2022. Because they have superior emulsification and are non-allergic, isolates are frequently utilized as nutritional supplements in meat products, energy drinks, fruit mixes, and bakery goods. Given the recent product introductions by Cadbury and Amway in the energy mix market, the sports nutrition sector is anticipated to grow in industrialized nations, including the U.S., Germany, and the U.K.
The application segment is divided into the bakery, meat extender and substitute, nutritional supplements, beverage, dietary supplements, and others. Over the forecast period, the meat extender and substitute segment is expected to grow at the fastest CAGR of 21%. Pea protein is added to nutritious syrups, tablets, energy powders, cereal bars, and soups because it has several health advantages, including improved bone health, muscle growth, and blood sugar control.
| Attribute | Description |
|---|---|
| Market Size | Revenue (USD Billion) |
| Market size value in 2022 | USD 2.14 Billion |
| Market size value in 2030 | USD 5.6 Billion |
| CAGR (2022 to 2030) | 12.8% |
| Historical data | 2019-2020 |
| Base Year | 2021 |
| Forecast | 2022-2030 |
| Regional Segments | North America, Asia Pacific, Europe, Latin America, Middle East and Africa |
| Segments | Product Type, Application |
As per The Brainy Insights, the size of the pea protein market was valued at USD 2.14 billion in 2022 to USD 5.6 billion by 2030.
The global pea protein market is growing at a CAGR of 12.8% during the forecast period 2022-2030.
North America emerged as the largest market for pea protein.
1. Introduction
1.1. Objectives of the Study
1.2. Market Definition
1.3. Research Scope
1.4. Currency
1.5. Key Target Audience
2. Research Methodology and Assumptions
3. Executive Summary
4. Premium Insights
4.1. Porter’s Five Forces Analysis
4.2. Value Chain Analysis
4.3. Top Investment Pockets
4.3.1. Market Attractiveness Analysis By Product Type
4.3.2. Market Attractiveness Analysis By Application
4.3.3. Market Attractiveness Analysis By Region
4.4. Industry Trends
5. Market Dynamics
5.1. Market Evaluation
5.2. Drivers
5.2.1. Growing vegan population
5.2.2. Rise in social media marketing
5.3. Restraints
5.3.1. Availability of low substitutes
5.4. Opportunities
5.4.1. Growing number of fitness centres
5.5. Challenges
5.5.1. High cost
1. Global Pea Protein Market Analysis and Forecast, By Product Type
1.1. Segment Overview
1.2. Isolates
1.3. Concentrates
1.4. Textured
2. Global Pea Protein Market Analysis and Forecast, By Application
2.1. Segment Overview
2.2. Bakery
2.3. Meat Extender and Substitute
2.4. Nutritional Supplement
2.5. Beverage
2.6. Dietary Supplements
2.7. Other
3. Global Pea Protein Market Analysis and Forecast, By Regional Analysis
3.1. Segment Overview
3.2. North America
3.2.1. U.S.
3.2.2. Canada
3.2.3. Mexico
3.3. Europe
3.3.1. Germany
3.3.2. France
3.3.3. U.K.
3.3.4. Italy
3.3.5. Spain
3.4. Asia-Pacific
3.4.1. Japan
3.4.2. China
3.4.3. India
3.5. South America
3.5.1. Brazil
3.6. Middle East and Africa
3.6.1. UAE
3.6.2. South Africa
4. Global Pea Protein Market-Competitive Landscape
4.1. Overview
4.2. Market Share of Key Players in Global Pea Protein Market
4.2.1. Global Company Market Share
4.2.2. North America Company Market Share
4.2.3. Europe Company Market Share
4.2.4. APAC Company Market Share
4.3. Competitive Situations and Trends
4.3.1. Product Launches and Developments
4.3.2. Partnerships, Collaborations, and Agreements
4.3.3. Mergers & Acquisitions
4.3.4. Expansions
5. Company Profiles
5.1. Burcon Nutrascience
5.1.1. Business Overview
5.1.2. Company Snapshot
5.1.3. Company Market Share Analysis
5.1.4. Company Product Portfolio
5.1.5. Recent Developments
5.1.6. SWOT Analysis
5.2. Roquette Freres
5.2.1. Business Overview
5.2.2. Company Snapshot
5.2.3. Company Market Share Analysis
5.2.4. Company Product Portfolio
5.2.5. Recent Developments
5.2.6. SWOT Analysis
5.3. The Scoular Company
5.3.1. Business Overview
5.3.2. Company Snapshot
5.3.3. Company Market Share Analysis
5.3.4. Company Product Portfolio
5.3.5. Recent Developments
5.3.6. SWOT Analysis
5.4. DuPont
5.4.1. Business Overview
5.4.2. Company Snapshot
5.4.3. Company Market Share Analysis
5.4.4. Company Product Portfolio
5.4.5. Recent Developments
5.4.6. SWOT Analysis
5.5. Cosucra Groupe Warcoing SA
5.5.1. Business Overview
5.5.2. Company Snapshot
5.5.3. Company Market Share Analysis
5.5.4. Company Product Portfolio
5.5.5. Recent Developments
5.5.6. SWOT Analysis
5.6. Nutri-Pea Ltd.
5.6.1. Business Overview
5.6.2. Company Snapshot
5.6.3. Company Market Share Analysis
5.6.4. Company Product Portfolio
5.6.5. Recent Developments
5.6.6. SWOT Analysis
5.7. Shandong Jianyuan Group
5.7.1. Business Overview
5.7.2. Company Snapshot
5.7.3. Company Market Share Analysis
5.7.4. Company Product Portfolio
5.7.5. Recent Developments
5.7.6. SWOT Analysis
5.8. Sotexpro SA
5.8.1. Business Overview
5.8.2. Company Snapshot
5.8.3. Company Market Share Analysis
5.8.4. Company Product Portfolio
5.8.5. Recent Developments
5.8.6. SWOT Analysis
5.9. Ingredion, Inc.
5.9.1. Business Overview
5.9.2. Company Snapshot
5.9.3. Company Market Share Analysis
5.9.4. Company Product Portfolio
5.9.5. Recent Developments
5.9.6. SWOT Analysis
5.10. Axiom Foods, Inc.
5.10.1. Business Overview
5.10.2. Company Snapshot
5.10.3. Company Market Share Analysis
5.10.4. Company Product Portfolio
5.10.5. Recent Developments
5.10.6. SWOT Analysis
List of Table
1. Global Pea Protein Market, Product Type, 2019-2030 (USD Billion)
2. Global Isolates, Pea Protein Market, By Region, 2019-2030 (USD Billion)
3. Global Concentrates, Pea Protein Market, By Region, 2019-2030 (USD Billion)
4. Global Textured, Pea Protein Market, By Region, 2019-2030 (USD Billion)
5. Global Pea Protein Market, By Application, 2019-2030 (USD Billion)
6. Global Bakery, Pea Protein Market, By Region, 2019-2030 (USD Billion)
7. Global Meat Extender and Substitute, Pea Protein Market, By Region, 2019-2030 (USD Billion)
8. Global Nutritional Supplement, Pea Protein Market, By Region, 2019-2030 (USD Billion)
9. Global Beverage, Pea Protein Market, By Region, 2019-2030 (USD Billion)
10. Global Dietary Supplements, Pea Protein Market, By Region, 2019-2030 (USD Billion)
11. Global Other, Pea Protein Market, By Region, 2019-2030 (USD Billion)
12. North America Pea Protein Market, Product Type, 2019-2030 (USD Billion)
13. North America Pea Protein Market, By Application, 2019-2030 (USD Billion)
14. U.S. Pea Protein Market, Product Type, 2019-2030 (USD Billion)
15. U.S. Pea Protein Market, By Application, 2019-2030 (USD Billion)
16. Canada Pea Protein Market, Product Type, 2019-2030 (USD Billion)
17. Canada Pea Protein Market, By Application, 2019-2030 (USD Billion)
18. Mexico Pea Protein Market, Product Type, 2019-2030 (USD Billion)
19. Mexico Pea Protein Market, By Application, 2019-2030 (USD Billion)
20. Europe Pea Protein Market, Product Type, 2019-2030 (USD Billion)
21. Europe Pea Protein Market, By Application, 2019-2030 (USD Billion)
22. Germany Pea Protein Market, Product Type, 2019-2030 (USD Billion)
23. Germany Pea Protein Market, By Application, 2019-2030 (USD Billion)
24. France Pea Protein Market, Product Type, 2019-2030 (USD Billion)
25. France Pea Protein Market, By Application, 2019-2030 (USD Billion)
26. U.K. Pea Protein Market, Product Type, 2019-2030 (USD Billion)
27. U.K. Pea Protein Market, By Application, 2019-2030 (USD Billion)
28. Italy Pea Protein Market, Product Type, 2019-2030 (USD Billion)
29. Italy Pea Protein Market, By Application, 2019-2030 (USD Billion)
30. Spain Pea Protein Market, Product Type, 2019-2030 (USD Billion)
31. Spain Pea Protein Market, By Application, 2019-2030 (USD Billion)
32. Asia Pacific Pea Protein Market, Product Type, 2019-2030 (USD Billion)
33. Asia Pacific Pea Protein Market, By Application, 2019-2030 (USD Billion)
34. Japan Pea Protein Market, Product Type, 2019-2030 (USD Billion)
35. Japan Pea Protein Market, By Application, 2019-2030 (USD Billion)
36. China Pea Protein Market, Product Type, 2019-2030 (USD Billion)
37. China Pea Protein Market, By Application, 2019-2030 (USD Billion)
38. India Pea Protein Market, Product Type, 2019-2030 (USD Billion)
39. India Pea Protein Market, By Application, 2019-2030 (USD Billion)
40. South America Pea Protein Market, Product Type, 2019-2030 (USD Billion)
41. South America Pea Protein Market, By Application, 2019-2030 (USD Billion)
42. Brazil Pea Protein Market, Product Type, 2019-2030 (USD Billion)
43. Brazil Pea Protein Market, By Application, 2019-2030 (USD Billion)
44. Middle East and Africa Pea Protein Market, Product Type, 2019-2030 (USD Billion)
45. Middle East and Africa Pea Protein Market, By Application, 2019-2030 (USD Billion)
46. UAE Pea Protein Market, Product Type, 2019-2030 (USD Billion)
47. UAE Pea Protein Market, By Application, 2019-2030 (USD Billion)
48. South Africa Pea Protein Market, Product Type, 2019-2030 (USD Billion)
49. South Africa Pea Protein Market, By Application, 2019-2030 (USD Billion)
List of Figures
1. Global Pea Protein Market Segmentation
2. Global Pea Protein Market: Research Methodology
3. Market Size Estimation Methodology: Bottom-Up Approach
4. Market Size Estimation Methodology: Top-Down Approach
5. Data Triangulation
6. Porter’s Five Forces Analysis
7. Value Chain Analysis
8. Global Pea Protein Market Attractiveness Analysis Product Type
9. Global Pea Protein Market Attractiveness Analysis By Application
10. Global Pea Protein Market Attractiveness Analysis By Region
11. Global Pea Protein Market: Dynamics
12. Global Pea Protein Market Share Product Type (2022 & 2030)
13. Global Pea Protein Market Share By Application (2022 & 2030)
14. Global Pea Protein Market Share By Regions (2022 & 2030)
15. Global Pea Protein Market Share By Company (2021)
This study forecasts global, regional, and country revenue from 2019 to 2030. Brainy Insights has segmented the global pea protein market based on the below-mentioned segments:
Global Pea Protein Market by Product Type:
Global Pea Protein Market by Application:
Global Pea Protein Market by Region:
Research has its special purpose to undertake marketing efficiently. In this competitive scenario, businesses need information across all industry verticals; the information about customer wants, market demand, competition, industry trends, distribution channels etc. This information needs to be updated regularly because businesses operate in a dynamic environment. Our organization, The Brainy Insights incorporates scientific and systematic research procedures in order to get proper market insights and industry analysis for overall business success. The analysis consists of studying the market from a miniscule level wherein we implement statistical tools which helps us in examining the data with accuracy and precision.
Our research reports feature both; quantitative and qualitative aspects for any market. Qualitative information for any market research process are fundamental because they reveal the customer needs and wants, usage and consumption for any product/service related to a specific industry. This in turn aids the marketers/investors in knowing certain perceptions of the customers. Qualitative research can enlighten about the different product concepts and designs along with unique service offering that in turn, helps define marketing problems and generate opportunities. On the other hand, quantitative research engages with the data collection process through interviews, e-mail interactions, surveys and pilot studies. Quantitative aspects for the market research are useful to validate the hypotheses generated during qualitative research method, explore empirical patterns in the data with the help of statistical tools, and finally make the market estimations.
The Brainy Insights offers comprehensive research and analysis, based on a wide assortment of factual insights gained through interviews with CXOs and global experts and secondary data from reliable sources. Our analysts and industry specialist assume vital roles in building up statistical tools and analysis models, which are used to analyse the data and arrive at accurate insights with exceedingly informative research discoveries. The data provided by our organization have proven precious to a diverse range of companies, facilitating them to address issues such as determining which products/services are the most appealing, whether or not customers use the product in the manner anticipated, the purchasing intentions of the market and many others.
Our research methodology encompasses an idyllic combination of primary and secondary initiatives. Key phases involved in this process are listed below:

The phase involves the gathering and collecting of market data and its related information with the help of different sources & research procedures.

The data procurement stage involves in data gathering and collecting through various data sources.
This stage involves in extensive research. These data sources includes:
Purchased Database: Purchased databases play a crucial role in estimating the market sizes irrespective of the domain. Our purchased database includes:
Primary Research: The Brainy Insights interacts with leading companies and experts of the concerned domain to develop the analyst team’s market understanding and expertise. It improves and substantiates every single data presented in the market reports. Primary research mainly involves in telephonic interviews, E-mail interactions and face-to-face interviews with the raw material providers, manufacturers/producers, distributors, & independent consultants. The interviews that we conduct provides valuable data on market size and industry growth trends prevailing in the market. Our organization also conducts surveys with the various industry experts in order to gain overall insights of the industry/market. For instance, in healthcare industry we conduct surveys with the pharmacists, doctors, surgeons and nurses in order to gain insights and key information of a medical product/device/equipment which the customers are going to usage. Surveys are conducted in the form of questionnaire designed by our own analyst team. Surveys plays an important role in primary research because surveys helps us to identify the key target audiences of the market. Additionally, surveys helps to identify the key target audience engaged with the market. Our survey team conducts the survey by targeting the key audience, thus gaining insights from them. Based on the perspectives of the customers, this information is utilized to formulate market strategies. Moreover, market surveys helps us to understand the current competitive situation of the industry. To be precise, our survey process typically involve with the 360 analysis of the market. This analytical process begins by identifying the prospective customers for a product or service related to the market/industry to obtain data on how a product/service could fit into customers’ lives.

Secondary Research: The secondary data sources includes information published by the on-profit organizations such as World bank, WHO, company fillings, investor presentations, annual reports, national government documents, statistical databases, blogs, articles, white papers and others. From the annual report, we analyse a company’s revenue to understand the key segment and market share of that organization in a particular region. We analyse the company websites and adopt the product mapping technique which is important for deriving the segment revenue. In the product mapping method, we select and categorize the products offered by the companies catering to domain specific market, deduce the product revenue for each of the companies so as to get overall estimation of the market size. We also source data and analyses trends based on information received from supply side and demand side intermediaries in the value chain. The supply side denotes the data gathered from supplier, distributor, wholesaler and the demand side illustrates the data gathered from the end customers for respective market domain.

The supply side for a domain specific market is analysed by:
The demand side for the market is estimated through:
In-house Library: Apart from these third-party sources, we have our in-house library of qualitative and quantitative information. Our in-house database includes market data for various industry and domains. These data are updated on regular basis as per the changing market scenario. Our library includes, historic databases, internal audit reports and archives.
Sometimes there are instances where there is no metadata or raw data available for any domain specific market. For those cases, we use our expertise to forecast and estimate the market size in order to generate comprehensive data sets. Our analyst team adopt a robust research technique in order to produce the estimates:
Data Synthesis: This stage involves the analysis & mapping of all the information obtained from the previous step. It also involves in scrutinizing the data for any discrepancy observed while data gathering related to the market. The data is collected with consideration to the heterogeneity of sources. Robust scientific techniques are in place for synthesizing disparate data sets and provide the essential contextual information that can orient market strategies. The Brainy Insights has extensive experience in data synthesis where the data passes through various stages:


Market Deduction & Formulation: The final stage comprises of assigning data points at appropriate market spaces so as to deduce feasible conclusions. Analyst perspective & subject matter expert based holistic form of market sizing coupled with industry analysis also plays a crucial role in this stage.
This stage involves in finalization of the market size and numbers that we have collected from data integration step. With data interpolation, it is made sure that there is no gap in the market data. Successful trend analysis is done by our analysts using extrapolation techniques, which provide the best possible forecasts for the market.
Data Validation & Market Feedback: Validation is the most important step in the process. Validation & re-validation via an intricately designed process helps us finalize data-points to be used for final calculations.

The Brainy Insights interacts with leading companies and experts of the concerned domain to develop the analyst team’s market understanding and expertise. It improves and substantiates every single data presented in the market reports. The data validation interview and discussion panels are typically composed of the most experienced industry members. The participants include, however, are not limited to:
Moreover, we always validate our data and findings through primary respondents from all the major regions we are working on.


Free Customization
Fortune 500 Clients
Free Yearly Update On Purchase Of Multi/Corporate License
Companies Served Till Date