- +1-315-215-1633
- sales@thebrainyinsights.com

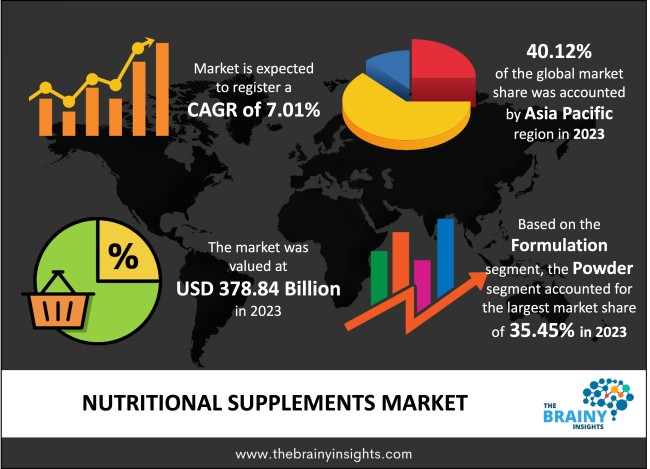
The global nutritional supplements market was valued at USD 378.84 billion in 2023 and grew at a CAGR of 7.01% from 2024 to 2033. The market is expected to reach USD 745.94 billion by 2033. Global health awareness is rising, which has significantly aided market growth. People are more conscious of the effects of an unhealthy lifestyle now than they were before the pandemic. The frequency of non-communicable diseases, or NCDs, is rising, which has led to a larger usage of nutritional supplements to improve general health. According to the WHO, NCDs cause 41 million deaths annually, and the market for immunity-boosting supplements increased throughout the pandemic. The general health and well-being of people are now a top priority.
The basic forms of these supplements include capsules, pills, tablets, powders, liquids, or gummies. They often contain a mix of minerals, vitamins, amino acids, medicinal plants, or other botanical ingredients. Depending on their intended application, nutritional supplements can be divided into many sorts, including minerals and vitamins, sports nutrition, botanical and herbal nutrients, meal replacements, and specialized supplements. Each kind targets particular customer requirements and fulfills various functions.
Get an overview of this study by requesting a free sample
Global awareness of and focus on wellness and good health is rising. Customers are taking an active role in maintaining their health and looking for methods to enhance their general well-being. Supplemental nutrition is viewed as a practical and accessible strategy to support and improve health. Stressful schedules, little time for food preparation, and increased dependence on processed or quick meals are common features of contemporary living. Supplemental nutrition is a handy way to fill in deficiencies in nutrition and provide people access to vital nutrients that might be missing from normal meals.
The regulatory environment for dietary supplements differs between nations, and in particular regions, rules may be less strict than those for prescription pharmaceuticals. Quality control, production standards, and product safety may become inconsistent as a result. Concerns regarding product effectiveness, false advertising, and possible hazards linked with certain components could occur due to the lack of consistent rules.
More and more consumers are looking for natural and organic alternatives in a variety of consumer items, including nutritional supplements. Supplements devoid of chemical additives, derived from organic or natural components, and produced sustainably are seeing increased demand. By providing healthy and environmentally sustainable supplement choices, manufacturers may profit from this trend. The growing acceptance of exercise and athletic pursuits is fueling the growth of the sports nutrition market. Supplements that boost energy, endurance, muscle recovery, and general fitness are sought after by athletes, fitness buffs, and those wishing to enhance their physical performance. To serve this expanding market, specialist sports nutrition solutions can be created.
Asia Pacific led the market in 2023 with the largest market share of 40.12%. The ability to produce functional meals, the affordability of raw materials, and the high level of public knowledge regarding the advantages of nutritional supplements have all contributed to the expansion of the industry in this region. Leading nations in the field of enhanced products with significant nutritional value are China and Japan. The region produces a large number of items that are exported to other regions of the world, which is helping the market expand. The China Chamber of Commerce published figures on the import and export of nutritional supplements, which showed that as of June 2020, exports of nutritional products were close to $ 990 million, a rise of 10.4% from 2019.
The functional foods & beverages segment dominated the global market in 2023 with a market share of 56.13%. Functional beverages & foods are made to treat certain health issues or offer unique health advantages. They could concentrate on things like improving energy levels, bone health, immunological support, cognitive function, digestive health, and heart health. These goods try to fill up nutritional deficiencies or offer certain nutrients that promote the best health and fitness.
The powder segment dominated the global market in 2023 with a market share of 35.45% and is anticipated to expand significantly in the upcoming years. The market has been taken over by powder formulations, which are now preferred over soft chews and soft gels. The market has grown as a result of rising demand for goods including protein powders, food flavorings, and vitamin supplements.
The adult segment dominated the global market in 2023 with a market share of 24.89%. Adults are most likely to use nutritional supplements, and they are becoming more and more conscious of the value of well-being. The expansion of the market is due to a rise in general fitness as well. The danger of contracting illnesses like obesity, and diabetes is another important consideration for this customer base, fueling the market's expansion.
The Supermarkets/hypermarkets segment dominated the global market in 2023 with a market share of 42.37%. Customers may purchase conveniently in one location in supermarkets and hypermarkets, which carry a variety of nutritional supplements from different manufacturers. These retail establishments frequently designate aisles or sections, particularly for wellness and health-related items, including nutritional supplements. Customers may pick from a wide variety of supplements, compare them, and select the ones that best suit their individual requirements.
| Attribute | Description |
|---|---|
| Market Size | Revenue (USD Billion) |
| Market size value in 2023 | USD 378.84 Billion |
| Market size value in 2033 | USD 745.94 Billion |
| CAGR (2024 to 2033) | 7.01% |
| Historical data | 2020-2022 |
| Base Year | 2023 |
| Forecast | 2024-2033 |
| Region | The regions analyzed for the market are Asia Pacific, Europe, South America, North America, and Middle East & Africa. Furthermore, the regions are further analyzed at the country level. |
| Segments | Product, Formulation, Consumer Group, Distribution Channel |
As per The Brainy Insights, the size of the nutritional supplements market was valued at USD 378.84 billion in 2023 to USD 745.94 billion by 2033.
The global nutritional supplements market is growing at a CAGR of 7.01% during the forecast period 2024-2033.
The Asia Pacific region emerged as the largest market for the nutritional supplements.
The rising focus on wellness and good health will influence the market's growth.
1. Introduction
1.1. Objectives of the Study
1.2. Market Definition
1.3. Research Scope
1.4. Currency
1.5. Key Target Audience
2. Research Methodology and Assumptions
3. Executive Summary
4. Premium Insights
4.1. Porter’s Five Forces Analysis
4.2. Value Chain Analysis
4.3. Top Investment Pockets
4.3.1. Market Attractiveness Analysis by Product
4.3.2. Market Attractiveness Analysis by Formulation
4.3.3. Market Attractiveness Analysis by Consumer Group
4.3.4. Market Attractiveness Analysis by Distribution Channel
4.3.5. Market Attractiveness Analysis by Region
4.4. Industry Trends
5. Market Dynamics
5.1. Market Evaluation
5.2. Drivers
5.2.1. Rising focus on wellness and good health
5.3. Restraints
5.3.1. Different regulatory environment
5.4. Opportunities
5.4.1. Rise in demand for natural and organic alternatives
5.5. Challenges
5.5.1. Quality issues
6. Global Nutritional Supplements Market Analysis and Forecast, By Product
6.1. Segment Overview
6.2. Sports Nutrition
6.3. Fat Burners
6.4. Dietary Supplements
6.5. Functional Food & Beverages
7. Global Nutritional Supplements Market Analysis and Forecast, By Formulation
7.1. Segment Overview
7.2. Tablets
7.3. Capsules
7.4. Powder
7.5. Soft gels
7.6. Liquid
7.7. Others
8. Global Nutritional Supplements Market Analysis and Forecast, By Consumer Group
8.1. Segment Overview
8.2. Infants
8.3. Children
8.4. Adults
8.5. Pregnant
8.6. Geriatric
9. Global Nutritional Supplements Market Analysis and Forecast, By Distribution Channel
9.1. Segment Overview
9.2. Supermarkets/Hypermarkets
9.3. Specialty Stores
9.4. Online
9.5. Others
10. Global Nutritional Supplements Market Analysis and Forecast, By Regional Analysis
10.1. Segment Overview
10.2. North America
10.2.1. U.S.
10.2.2. Canada
10.2.3. Mexico
10.3. Europe
10.3.1. Germany
10.3.2. France
10.3.3. U.K.
10.3.4. Italy
10.3.5. Spain
10.4. Asia-Pacific
10.4.1. Japan
10.4.2. China
10.4.3. India
10.5. South America
10.5.1. Brazil
10.6. Middle East and Africa
10.6.1. UAE
10.6.2. South Africa
11. Global Nutritional Supplements Market-Competitive Landscape
11.1. Overview
11.2. Market Share of Key Players in the Nutritional Supplements Market
11.2.1. Global Company Market Share
11.2.2. North America Company Market Share
11.2.3. Europe Company Market Share
11.2.4. APAC Company Market Share
11.3. Competitive Situations and Trends
11.3.1. Product Launches and Developments
11.3.2. Partnerships, Collaborations, and Agreements
11.3.3. Mergers & Acquisitions
11.3.4. Expansions
12. Company Profiles
12.1. TheHut.com Ltd.
12.1.1. Business Overview
12.1.2. Company Snapshot
12.1.3. Company Market Share Analysis
12.1.4. Company Product Portfolio
12.1.5. Recent Developments
12.1.6. SWOT Analysis
12.2. Science in Sports
12.2.1. Business Overview
12.2.2. Company Snapshot
12.2.3. Company Market Share Analysis
12.2.4. Company Product Portfolio
12.2.5. Recent Developments
12.2.6. SWOT Analysis
12.3. PepsiCo
12.3.1. Business Overview
12.3.2. Company Snapshot
12.3.3. Company Market Share Analysis
12.3.4. Company Product Portfolio
12.3.5. Recent Developments
12.3.6. SWOT Analysis
12.4. Glanbia plc
12.4.1. Business Overview
12.4.2. Company Snapshot
12.4.3. Company Market Share Analysis
12.4.4. Company Product Portfolio
12.4.5. Recent Developments
12.4.6. SWOT Analysis
12.5. Cliff Bar & Company
12.5.1. Business Overview
12.5.2. Company Snapshot
12.5.3. Company Market Share Analysis
12.5.4. Company Product Portfolio
12.5.5. Recent Developments
12.5.6. SWOT Analysis
12.6. Cardiff Sports Nutrition Ltd
12.6.1. Business Overview
12.6.2. Company Snapshot
12.6.3. Company Market Share Analysis
12.6.4. Company Product Portfolio
12.6.5. Recent Developments
12.6.6. SWOT Analysis
12.7. Amway
12.7.1. Business Overview
12.7.2. Company Snapshot
12.7.3. Company Market Share Analysis
12.7.4. Company Product Portfolio
12.7.5. Recent Developments
12.7.6. SWOT Analysis
12.8. Abbott Nutrition
12.8.1. Business Overview
12.8.2. Company Snapshot
12.8.3. Company Market Share Analysis
12.8.4. Company Product Portfolio
12.8.5. Recent Developments
12.8.6. SWOT Analysis
12.9. Nestle
12.9.1. Business Overview
12.9.2. Company Snapshot
12.9.3. Company Market Share Analysis
12.9.4. Company Product Portfolio
12.9.5. Recent Developments
12.9.6. SWOT Analysis
12.10. Herbalife International of America, Inc.
12.10.1. Business Overview
12.10.2. Company Snapshot
12.10.3. Company Market Share Analysis
12.10.4. Company Product Portfolio
12.10.5. Recent Developments
12.10.6. SWOT Analysis
List of Table
1. Global Nutritional Supplements Market, By Product, 2020-2033 (USD Billion)
2. Global Sports Nutrition, Nutritional Supplements Market, By Region, 2020-2033 (USD Billion)
3. Global Fat Burners, Nutritional Supplements Market, By Region, 2020-2033 (USD Billion)
4. Global Dietary Supplements, Nutritional Supplements Market, By Region, 2020-2033 (USD Billion)
5. Global Functional Food & Beverages, Nutritional Supplements Market, By Region, 2020-2033 (USD Billion)
6. Global Nutritional Supplements Market, By Formulation, 2020-2033 (USD Billion)
7. Global Tablets, Nutritional Supplements Market, By Region, 2020-2033 (USD Billion)
8. Global Capsules, Nutritional Supplements Market, By Region, 2020-2033 (USD Billion)
9. Global Powder, Nutritional Supplements Market, By Region, 2020-2033 (USD Billion)
10. Global Soft Gels, Nutritional Supplements Market, By Region, 2020-2033 (USD Billion)
11. Global Liquid, Nutritional Supplements Market, By Region, 2020-2033 (USD Billion)
12. Global Others, Nutritional Supplements Market, By Region, 2020-2033 (USD Billion)
13. Global Nutritional Supplements Market, By Consumer Group, 2020-2033 (USD Billion)
14. Global Infants, Nutritional Supplements Market, By Region, 2020-2033 (USD Billion)
15. Global Children, Nutritional Supplements Market, By Region, 2020-2033 (USD Billion)
16. Global Adults, Nutritional Supplements Market, By Region, 2020-2033 (USD Billion)
17. Global Pregnant, Nutritional Supplements Market, By Region, 2020-2033 (USD Billion)
18. Global Geriatric, Nutritional Supplements Market, By Region, 2020-2033 (USD Billion)
19. Global Nutritional Supplements Market, By Distribution Channel, 2020-2033 (USD Billion)
20. Global Supermarkets/Hypermarkets, Nutritional Supplements Market, By Region, 2020-2033 (USD Billion)
21. Global Specialty Stores, Nutritional Supplements Market, By Region, 2020-2033 (USD Billion)
22. Global Online, Nutritional Supplements Market, By Region, 2020-2033 (USD Billion)
23. Global Others, Nutritional Supplements Market, By Region, 2020-2033 (USD Billion)
24. Global Nutritional Supplements Market, By Region, 2020-2033 (USD Billion)
25. North America Nutritional Supplements Market, By Product, 2020-2033 (USD Billion)
26. North America Nutritional Supplements Market, By Formulation, 2020-2033 (USD Billion)
27. North America Nutritional Supplements Market, By Consumer Group, 2020-2033 (USD Billion)
28. North America Nutritional Supplements Market, By Distribution Channel, 2020-2033 (USD Billion)
29. U.S. Nutritional Supplements Market, By Product, 2020-2033 (USD Billion)
30. U.S. Nutritional Supplements Market, By Formulation, 2020-2033 (USD Billion)
31. U.S. Nutritional Supplements Market, By Consumer Group, 2020-2033 (USD Billion)
32. U.S. Nutritional Supplements Market, By Distribution Channel, 2020-2033 (USD Billion)
33. Canada Nutritional Supplements Market, By Product, 2020-2033 (USD Billion)
34. Canada Nutritional Supplements Market, By Formulation, 2020-2033 (USD Billion)
35. Canada Nutritional Supplements Market, By Consumer Group, 2020-2033 (USD Billion)
36. Canada Nutritional Supplements Market, By Distribution Channel, 2020-2033 (USD Billion)
37. Mexico Nutritional Supplements Market, By Product, 2020-2033 (USD Billion)
38. Mexico Nutritional Supplements Market, By Formulation, 2020-2033 (USD Billion)
39. Mexico Nutritional Supplements Market, By Consumer Group, 2020-2033 (USD Billion)
40. Mexico Nutritional Supplements Market, By Distribution Channel, 2020-2033 (USD Billion)
41. Europe Nutritional Supplements Market, By Product, 2020-2033 (USD Billion)
42. Europe Nutritional Supplements Market, By Formulation, 2020-2033 (USD Billion)
43. Europe Nutritional Supplements Market, By Consumer Group, 2020-2033 (USD Billion)
44. Europe Nutritional Supplements Market, By Distribution Channel, 2020-2033 (USD Billion)
45. Germany Nutritional Supplements Market, By Product, 2020-2033 (USD Billion)
46. Germany Nutritional Supplements Market, By Formulation, 2020-2033 (USD Billion)
47. Germany Nutritional Supplements Market, By Consumer Group, 2020-2033 (USD Billion)
48. Germany Nutritional Supplements Market, By Distribution Channel, 2020-2033 (USD Billion)
49. France Nutritional Supplements Market, By Product, 2020-2033 (USD Billion)
50. France Nutritional Supplements Market, By Formulation, 2020-2033 (USD Billion)
51. France Nutritional Supplements Market, By Consumer Group, 2020-2033 (USD Billion)
52. France Nutritional Supplements Market, By Distribution Channel, 2020-2033 (USD Billion)
53. U.K. Nutritional Supplements Market, By Product, 2020-2033 (USD Billion)
54. U.K. Nutritional Supplements Market, By Formulation, 2020-2033 (USD Billion)
55. U.K. Nutritional Supplements Market, By Consumer Group, 2020-2033 (USD Billion)
56. U.K. Nutritional Supplements Market, By Distribution Channel, 2020-2033 (USD Billion)
57. Italy Nutritional Supplements Market, By Product, 2020-2033 (USD Billion)
58. Italy Nutritional Supplements Market, By Formulation, 2020-2033 (USD Billion)
59. Italy Nutritional Supplements Market, By Consumer Group, 2020-2033 (USD Billion)
60. Italy Nutritional Supplements Market, By Distribution Channel, 2020-2033 (USD Billion)
61. Spain Nutritional Supplements Market, By Product, 2020-2033 (USD Billion)
62. Spain Nutritional Supplements Market, By Formulation, 2020-2033 (USD Billion)
63. Spain Nutritional Supplements Market, By Consumer Group, 2020-2033 (USD Billion)
64. Spain Nutritional Supplements Market, By Distribution Channel, 2020-2033 (USD Billion)
65. Asia Pacific Nutritional Supplements Market, By Product, 2020-2033 (USD Billion)
66. Asia Pacific Nutritional Supplements Market, By Formulation, 2020-2033 (USD Billion)
67. Asia Pacific Nutritional Supplements Market, By Consumer Group, 2020-2033 (USD Billion)
68. Asia Pacific Nutritional Supplements Market, By Distribution Channel, 2020-2033 (USD Billion)
69. Japan Nutritional Supplements Market, By Product, 2020-2033 (USD Billion)
70. Japan Nutritional Supplements Market, By Formulation, 2020-2033 (USD Billion)
71. Japan Nutritional Supplements Market, By Consumer Group, 2020-2033 (USD Billion)
72. Japan Nutritional Supplements Market, By Distribution Channel, 2020-2033 (USD Billion)
73. China Nutritional Supplements Market, By Product, 2020-2033 (USD Billion)
74. China Nutritional Supplements Market, By Formulation, 2020-2033 (USD Billion)
75. China Nutritional Supplements Market, By Consumer Group, 2020-2033 (USD Billion)
76. China Nutritional Supplements Market, By Distribution Channel, 2020-2033 (USD Billion)
77. India Nutritional Supplements Market, By Product, 2020-2033 (USD Billion)
78. India Nutritional Supplements Market, By Formulation, 2020-2033 (USD Billion)
79. India Nutritional Supplements Market, By Consumer Group, 2020-2033 (USD Billion)
80. India Nutritional Supplements Market, By Distribution Channel, 2020-2033 (USD Billion)
81. South America Nutritional Supplements Market, By Product, 2020-2033 (USD Billion)
82. South America Nutritional Supplements Market, By Formulation, 2020-2033 (USD Billion)
83. South America Nutritional Supplements Market, By Consumer Group, 2020-2033 (USD Billion)
84. South America Nutritional Supplements Market, By Distribution Channel, 2020-2033 (USD Billion)
85. Brazil Nutritional Supplements Market, By Product, 2020-2033 (USD Billion)
86. Brazil Nutritional Supplements Market, By Formulation, 2020-2033 (USD Billion)
87. Brazil Nutritional Supplements Market, By Consumer Group, 2020-2033 (USD Billion)
88. Brazil Nutritional Supplements Market, By Distribution Channel, 2020-2033 (USD Billion)
89. Middle East and Africa Nutritional Supplements Market, By Product, 2020-2033 (USD Billion)
90. Middle East and Africa Nutritional Supplements Market, By Formulation, 2020-2033 (USD Billion)
91. Middle East and Africa Nutritional Supplements Market, By Consumer Group, 2020-2033 (USD Billion)
92. Middle East and Africa Nutritional Supplements Market, By Distribution Channel, 2020-2033 (USD Billion)
93. UAE Nutritional Supplements Market, By Product, 2020-2033 (USD Billion)
94. UAE Nutritional Supplements Market, By Formulation, 2020-2033 (USD Billion)
95. UAE Nutritional Supplements Market, By Consumer Group, 2020-2033 (USD Billion)
96. UAE Nutritional Supplements Market, By Distribution Channel, 2020-2033 (USD Billion)
97. South Africa Nutritional Supplements Market, By Product, 2020-2033 (USD Billion)
98. South Africa Nutritional Supplements Market, By Formulation, 2020-2033 (USD Billion)
99. South Africa Nutritional Supplements Market, By Consumer Group, 2020-2033 (USD Billion)
100. South Africa Nutritional Supplements Market, By Distribution Channel, 2020-2033 (USD Billion)
List of Figures
1. Global Nutritional Supplements Market Segmentation
2. Nutritional Supplements Market: Research Methodology
3. Market Size Estimation Methodology: Bottom-Up Approach
4. Market Size Estimation Methodology: Top-Down Approach
5. Data Triangulation
6. Porter’s Five Forces Analysis
7. Value Chain Analysis
8. Global Nutritional Supplements Market Attractiveness Analysis by Product
9. Global Nutritional Supplements Market Attractiveness Analysis by Formulation
10. Global Nutritional Supplements Market Attractiveness Analysis by Consumer Group
11. Global Nutritional Supplements Market Attractiveness Analysis by Distribution Channel
12. Global Nutritional Supplements Market Attractiveness Analysis by Region
13. Global Nutritional Supplements Market: Dynamics
14. Global Nutritional Supplements Market Share by Product (2023 & 2033)
15. Global Nutritional Supplements Market Share by Formulation (2023 & 2033)
16. Global Nutritional Supplements Market Share by Consumer Group (2023 & 2033)
17. Global Nutritional Supplements Market Share by Distribution Channel (2023 & 2033)
18. Global Nutritional Supplements Market Share by Regions (2023 & 2033)
19. Global Nutritional Supplements Market Share by Company (2023)
This study forecasts revenue at global, regional, and country levels from 2020 to 2033. The Brainy Insights has segmented the global nutritional supplements market based on below-mentioned segments:
Global Nutritional Supplements Market by Product:
Global Nutritional Supplements Market by Formulation:
Global Nutritional Supplements Market by Consumer Group:
Global Nutritional Supplements Market by Distribution Channel:
Global Nutritional Supplements Market by Region:
Research has its special purpose to undertake marketing efficiently. In this competitive scenario, businesses need information across all industry verticals; the information about customer wants, market demand, competition, industry trends, distribution channels etc. This information needs to be updated regularly because businesses operate in a dynamic environment. Our organization, The Brainy Insights incorporates scientific and systematic research procedures in order to get proper market insights and industry analysis for overall business success. The analysis consists of studying the market from a miniscule level wherein we implement statistical tools which helps us in examining the data with accuracy and precision.
Our research reports feature both; quantitative and qualitative aspects for any market. Qualitative information for any market research process are fundamental because they reveal the customer needs and wants, usage and consumption for any product/service related to a specific industry. This in turn aids the marketers/investors in knowing certain perceptions of the customers. Qualitative research can enlighten about the different product concepts and designs along with unique service offering that in turn, helps define marketing problems and generate opportunities. On the other hand, quantitative research engages with the data collection process through interviews, e-mail interactions, surveys and pilot studies. Quantitative aspects for the market research are useful to validate the hypotheses generated during qualitative research method, explore empirical patterns in the data with the help of statistical tools, and finally make the market estimations.
The Brainy Insights offers comprehensive research and analysis, based on a wide assortment of factual insights gained through interviews with CXOs and global experts and secondary data from reliable sources. Our analysts and industry specialist assume vital roles in building up statistical tools and analysis models, which are used to analyse the data and arrive at accurate insights with exceedingly informative research discoveries. The data provided by our organization have proven precious to a diverse range of companies, facilitating them to address issues such as determining which products/services are the most appealing, whether or not customers use the product in the manner anticipated, the purchasing intentions of the market and many others.
Our research methodology encompasses an idyllic combination of primary and secondary initiatives. Key phases involved in this process are listed below:

The phase involves the gathering and collecting of market data and its related information with the help of different sources & research procedures.

The data procurement stage involves in data gathering and collecting through various data sources.
This stage involves in extensive research. These data sources includes:
Purchased Database: Purchased databases play a crucial role in estimating the market sizes irrespective of the domain. Our purchased database includes:
Primary Research: The Brainy Insights interacts with leading companies and experts of the concerned domain to develop the analyst team’s market understanding and expertise. It improves and substantiates every single data presented in the market reports. Primary research mainly involves in telephonic interviews, E-mail interactions and face-to-face interviews with the raw material providers, manufacturers/producers, distributors, & independent consultants. The interviews that we conduct provides valuable data on market size and industry growth trends prevailing in the market. Our organization also conducts surveys with the various industry experts in order to gain overall insights of the industry/market. For instance, in healthcare industry we conduct surveys with the pharmacists, doctors, surgeons and nurses in order to gain insights and key information of a medical product/device/equipment which the customers are going to usage. Surveys are conducted in the form of questionnaire designed by our own analyst team. Surveys plays an important role in primary research because surveys helps us to identify the key target audiences of the market. Additionally, surveys helps to identify the key target audience engaged with the market. Our survey team conducts the survey by targeting the key audience, thus gaining insights from them. Based on the perspectives of the customers, this information is utilized to formulate market strategies. Moreover, market surveys helps us to understand the current competitive situation of the industry. To be precise, our survey process typically involve with the 360 analysis of the market. This analytical process begins by identifying the prospective customers for a product or service related to the market/industry to obtain data on how a product/service could fit into customers’ lives.

Secondary Research: The secondary data sources includes information published by the on-profit organizations such as World bank, WHO, company fillings, investor presentations, annual reports, national government documents, statistical databases, blogs, articles, white papers and others. From the annual report, we analyse a company’s revenue to understand the key segment and market share of that organization in a particular region. We analyse the company websites and adopt the product mapping technique which is important for deriving the segment revenue. In the product mapping method, we select and categorize the products offered by the companies catering to domain specific market, deduce the product revenue for each of the companies so as to get overall estimation of the market size. We also source data and analyses trends based on information received from supply side and demand side intermediaries in the value chain. The supply side denotes the data gathered from supplier, distributor, wholesaler and the demand side illustrates the data gathered from the end customers for respective market domain.

The supply side for a domain specific market is analysed by:
The demand side for the market is estimated through:
In-house Library: Apart from these third-party sources, we have our in-house library of qualitative and quantitative information. Our in-house database includes market data for various industry and domains. These data are updated on regular basis as per the changing market scenario. Our library includes, historic databases, internal audit reports and archives.
Sometimes there are instances where there is no metadata or raw data available for any domain specific market. For those cases, we use our expertise to forecast and estimate the market size in order to generate comprehensive data sets. Our analyst team adopt a robust research technique in order to produce the estimates:
Data Synthesis: This stage involves the analysis & mapping of all the information obtained from the previous step. It also involves in scrutinizing the data for any discrepancy observed while data gathering related to the market. The data is collected with consideration to the heterogeneity of sources. Robust scientific techniques are in place for synthesizing disparate data sets and provide the essential contextual information that can orient market strategies. The Brainy Insights has extensive experience in data synthesis where the data passes through various stages:


Market Deduction & Formulation: The final stage comprises of assigning data points at appropriate market spaces so as to deduce feasible conclusions. Analyst perspective & subject matter expert based holistic form of market sizing coupled with industry analysis also plays a crucial role in this stage.
This stage involves in finalization of the market size and numbers that we have collected from data integration step. With data interpolation, it is made sure that there is no gap in the market data. Successful trend analysis is done by our analysts using extrapolation techniques, which provide the best possible forecasts for the market.
Data Validation & Market Feedback: Validation is the most important step in the process. Validation & re-validation via an intricately designed process helps us finalize data-points to be used for final calculations.

The Brainy Insights interacts with leading companies and experts of the concerned domain to develop the analyst team’s market understanding and expertise. It improves and substantiates every single data presented in the market reports. The data validation interview and discussion panels are typically composed of the most experienced industry members. The participants include, however, are not limited to:
Moreover, we always validate our data and findings through primary respondents from all the major regions we are working on.


Free Customization
Fortune 500 Clients
Free Yearly Update On Purchase Of Multi/Corporate License
Companies Served Till Date