- +1-315-215-1633
- sales@thebrainyinsights.com

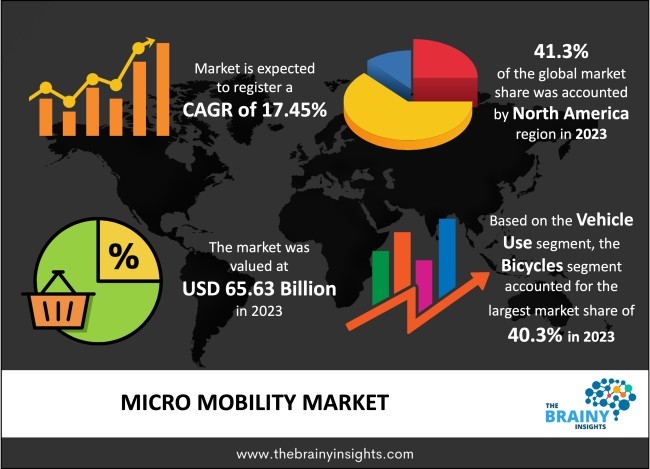
The global micromobility market is expected to reach USD 327.84 billion by 2033, at a CAGR of 17.45% from 2024 to 2033. At present, the micro-mobility market consists of varied options like e-scooters, e-bikes, electric skateboards, and many more, thus propelling the growth of the market. Another factor driving the market is the quest for more sustainability. Transportation generally accounts for a substantial portion of the global carbon footprint; hence the new micro-mobility solutions are helping to reduce the carbon footprint, and this is eventually fuelling the micro-mobility market. In recent years there has been an increase in the number of micro-mobility companies with companies such as Ofo and Mobike in China and Citi Bike and Jump Bikes in the US, which offer consumers suitable options for last-mile transportation. These companies are raising venture capital, showcasing both the consumer and investor demand for such last-mile transportation solutions.
Micro-mobility devices could be privately owned, but these are generally shared-use vehicles that are maintained by the municipal government or private organizations. These devices are attracting the residents of densely populated areas because it is offering quick and convenient transportation to the close by destinations like shops, grocery stores, or entertainment venues. Vehicles, which include eScooters, Vespas, Segways, standard bikes, eBikes, etc., are available in the major cities for touring and guided tours. The demand for micro-mobility solutions has increased as owning a vehicle in many urban areas could be impractical and depending upon schedule-based transportation cannot always be very convenient. Moreover, the cost of vehicle ownership, the surge in insurance costs, and the shortage of proper parking spaces have led many residents to not purchase traditional cars. Some of the cities that have already observed significant growth in the micro-mobility market are Barcelona, Chicago, Los Angeles, Minneapolis, and Montreal, among others. Leading edge technologies like IoT devices are helping organizations implement complex micro-mobility transportation networks. It is making the life of the people better and also benefiting the municipality by decreasing the congestion and vehicle emissions. Micro-mobility vehicles, such as bicycles and electric transportation options, are commonly used for short distances as light transport. These miniature modes of transit have proven useful in various environments, including commercial use, and their popularity continues to grow over time.
Get an overview of this study by requesting a free sample
The micro-mobility space is growing, but in that, the electric scooter demand has increased. Based on one of the studies, the electric scooter organization has expanded significantly in recent years. The demand for the e-bikes and e-scooters is anticipated to rise at an exponential rate in the upcoming years. Another source suggested that 2021 was the year of e-bikes having a growth rate in sales of around 240% in 12 months. Similarly, the future of the bike and scooter rental market economy is anticipated to reach USD 11,040 Million by 2028. One of the studies, known as The Promise of Low Carbon Freight, observed in three month period that the cargo bikes help in saving a total of around 3,896 kilograms of CO2 and 5.5 kilograms of nitrogen oxide. Micro-mobility is becoming the growing trend in smart cities which focus on improving the air quality and reducing the traffic congestion.
There are certain risks like the city infrastructure, hardware health, weather, etc. The cutthroat competition between the micro-mobility startups has led to several dockless bicycles across the streets of the major cities, which is resulting in a big problem; if the bike breaks, the companies do not have enough manpower in place to fix them in a timely manner. Also, in cities with a harsher climate, such as in northern Europe, the adoption of shared bikes and scooters is not viable as in the rain and snow, the condition becomes dangerous, and the number of accidents increases. Also, the demand generally decreases significantly when it is too cold to use such vehicles. Moreover, many cities lack the proper infrastructure, like the proper bike lanes, etc. All these factors are acting as a restraint for the market to grow.
Many experts predict that the micro nobility market will grow further. Most experts project that the micro-mobility market will continue to experience this growth. For these projections, many of the factors are taken into account, like the residents of the densely populated areas requiring convenient, affordable transportation options. Also, the recovery of global tourism in the post-pandemic world is driving the demand for micro-mobility and economical touring options. IoT devices, asset management platforms, and green technologies like the solar charging infrastructure seem to be in high demand as the cities would continue to adopt micro-mobility solutions. In the years to come, one can expect to see micro-mobility services spread up in all the major cities of the world.
One of the major challenges that are faced by the developers and the micro-mobility markets is logistics. There is a requirement that every device, along with the charging stations or docks, must be carefully tracked and maintained. Otherwise, the total cost of doing the business would not be sustainable. To overcome such challenges, technologies are adopted that support remote monitoring and integrate with an IoT platform. Another challenge is the damaged and stolen equipment. Thus, the micro-mobility stakeholders should take steps to mitigate these issues if they are planning to get a return on their investment. The city infrastructure, like many of Africa’s cities, is not bike-friendly as it lacks the proper bike-specific infrastructure for people to cycle safely. Presently riding bikes and scooters across African cities could be too dangerous. These are some of the challenges which are affecting the micro-mobility market.
The global micro mobility market has been segmented based on propulsion type, vehicle use, sharing type, age group and region.
The regions analyzed for the market include North America, Europe, South America, Asia Pacific, the Middle East, and Africa. The North America region emerged as the largest market for the global micro mobility market, with a 41.3% share of the market revenue in 2021.
North America Region Micro Mobility Market Share in 2023 - 41.3%
www.thebrainyinsights.com
Check the geographical analysis of this market by requesting a free sample
The key players are now concentrating on implementing strategies such as adopting new technology, product innovations, mergers & acquisitions, joint venture, alliances, and partnerships to improve their market position in the global micro mobility industry.
For instance, the electric scooter organization Voi Technology has raised more than USD 400 Million in its fundraising rounds to date since its launching in 2018. This Sweden-based startup had secured investment from venture funds like Balderton Capital, Vostok New Ventures, Project A, and Creandum. Very recently, Voi raised USD 45 million Series C extension at a USD 808 Million valuations in August 2021. Voi provides its e-scooters in the cities like Sweden, Denmark, Spain, Portugal, Finland, and France. The organization is recently partnered with France-based ridesharing startup BlaBlaCar to give BlaBla Ride scooters in France.
As per The Brainy Insights, the size of the micro mobility market was valued at USD 65.63 billion in 2023 to USD 327.84 billion by 2033.
Global micro mobility market is growing at a CAGR of 17.45% during the forecast period 2024-2033.
North America region emerged as the largest market for the micro mobility.
The market's growth will be influenced by the growing demand of e-scooter and e-bikes.
Risk involves in investing into the micro-mobility sector could hamper the market growth.
The recovery of global tourism post-pandemic will provide huge opportunities to the market.
Key players are Electricfeel, Floatility GmbH, Beam Mobility Holdings PTE. Ltd, Bird Rides, DOTT, Yulu Bikes Pvt. Ltd, Zagster, Lime, Neuron and VOI among others.
1. Introduction
1.1. Objectives of the Study
1.2. Market Definition
1.3. Research Scope
1.4. Currency
1.5. Key Target Audience
2. Research Methodology and Assumptions
3. Executive Summary
4. Premium Insights
4.1. Porter’s Five Forces Analysis
4.2. Value Chain Analysis
4.3. Top Investment Pockets
4.3.1. Market Attractiveness Analysis by Propulsion Type
4.3.2. Market Attractiveness Analysis by Vehicle Use
4.3.3. Market Attractiveness Analysis by Sharing Type
4.3.4. Market Attractiveness Analysis by Age Group
4.3.5. Market Attractiveness Analysis by Region
4.4. Industry Trends
5. Market Dynamics
5.1. Market Evaluation
5.2. Drivers
5.2.1. Growing demand of electric scooter
5.3. Restraints
5.3.1. Risk involves in investing into the micro-mobility
5.4. Opportunities
5.4.1. The recovery of global tourism post-pandemic
5.5. Challenges
5.5.1. Logistics and asset management along with theft and misuse
6. Global Micro Mobility Market Analysis and Forecast, By Propulsion Type
6.1. Segment Overview
6.2. Human Powered
6.3. Electrically Powered
7. Global Micro Mobility Market Analysis and Forecast, By Vehicle Use
7.1. Segment Overview
7.2. E-Kick Scooters
7.3. Bicycles
7.4. SkateBoards
7.5. HoverBoard
7.6. Low Speed Evs
7.7. Segway
7.8. Mopeds & Scooters
8. Global Micro Mobility Market Analysis and Forecast, By Sharing Type
8.1. Segment Overview
8.2. Docked
8.3. Dock-less
9. Global Micro Mobility Market Analysis and Forecast, By Age Group
9.1. Segment Overview
9.2. 15-34
9.3. 35-54
9.4. 55 and Above
10. Global Micro Mobility Market Analysis and Forecast, By Regional Analysis
10.1. Segment Overview
10.2. North America
10.2.1. U.S.
10.2.2. Canada
10.2.3. Mexico
10.3. Europe
10.3.1. Germany
10.3.2. France
10.3.3. U.K.
10.3.4. Italy
10.3.5. Spain
10.4. Asia-Pacific
10.4.1. Japan
10.4.2. China
10.4.3. India
10.5. South America
10.5.1. Brazil
10.6. Middle East and Africa
10.6.1. UAE
10.6.2. South Africa
11. Global Micro Mobility Market-Competitive Landscape
11.1. Overview
11.2. Market Share of Key Players in the Micro Mobility Market
11.2.1. Global Company Market Share
11.2.2. North America Company Market Share
11.2.3. Europe Company Market Share
11.2.4. APAC Company Market Share
11.3. Competitive Situations and Trends
11.3.1. Product Launches and Developments
11.3.2. Partnerships, Collaborations, and Agreements
11.3.3. Mergers & Acquisitions
11.3.4. Expansions
12. Company Profiles
12.1. Electricfeel
12.1.1. Business Overview
12.1.2. Company Snapshot
12.1.3. Company Market Share Analysis
12.1.4. Company Product Portfolio
12.1.5. Recent Developments
12.1.6. SWOT Analysis
12.2. Floatility GmbH
12.2.1. Business Overview
12.2.2. Company Snapshot
12.2.3. Company Market Share Analysis
12.2.4. Company Product Portfolio
12.2.5. Recent Developments
12.2.6. SWOT Analysis
12.3. Beam Mobility Holdings PTE. Ltd
12.3.1. Business Overview
12.3.2. Company Snapshot
12.3.3. Company Market Share Analysis
12.3.4. Company Product Portfolio
12.3.5. Recent Developments
12.3.6. SWOT Analysis
12.4. Bird Rides
12.4.1. Business Overview
12.4.2. Company Snapshot
12.4.3. Company Market Share Analysis
12.4.4. Company Product Portfolio
12.4.5. Recent Developments
12.4.6. SWOT Analysis
12.5. DOTT
12.5.1. Business Overview
12.5.2. Company Snapshot
12.5.3. Company Market Share Analysis
12.5.4. Company Product Portfolio
12.5.5. Recent Developments
12.5.6. SWOT Analysis
12.6. Yulu Bikes Pvt. Ltd
12.6.1. Business Overview
12.6.2. Company Snapshot
12.6.3. Company Market Share Analysis
12.6.4. Company Product Portfolio
12.6.5. Recent Developments
12.6.6. SWOT Analysis
12.7. Zagster
12.7.1. Business Overview
12.7.2. Company Snapshot
12.7.3. Company Market Share Analysis
12.7.4. Company Product Portfolio
12.7.5. Recent Developments
12.7.6. SWOT Analysis
12.8. Lime
12.8.1. Business Overview
12.8.2. Company Snapshot
12.8.3. Company Market Share Analysis
12.8.4. Company Product Portfolio
12.8.5. Recent Developments
12.8.6. SWOT Analysis
12.9. Neuron
12.9.1. Business Overview
12.9.2. Company Snapshot
12.9.3. Company Market Share Analysis
12.9.4. Company Product Portfolio
12.9.5. Recent Developments
12.9.6. SWOT Analysis
12.10. VOI
12.10.1. Business Overview
12.10.2. Company Snapshot
12.10.3. Company Market Share Analysis
12.10.4. Company Product Portfolio
12.10.5. Recent Developments
12.10.6. SWOT Analysis
List of Table
1. Global Micro Mobility Market, By Propulsion Type, 2020-2033 (USD Billion)
2. Global Human Powered Micro Mobility Market, By Region, 2020-2033 (USD Billion)
3. Global Electrically Powered Micro Mobility Market, By Region, 2020-2033 (USD Billion)
4. Global Micro Mobility Market, By Vehicle Use, 2020-2033 (USD Billion)
5. Global E-Kick Scooters Micro Mobility Market, By Region, 2020-2033 (USD Billion)
6. Global Bicycles Micro Mobility Market, By Region, 2020-2033 (USD Billion)
7. Global SkateBoards Micro Mobility Market, By Region, 2020-2033 (USD Billion)
8. Global HoverBoard Micro Mobility Market, By Region, 2020-2033 (USD Billion)
9. Global Low Speed Evs Micro Mobility Market, By Region, 2020-2033 (USD Billion)
10. Global Segway Micro Mobility Market, By Region, 2020-2033 (USD Billion)
11. Global Mopeds & Scooters Micro Mobility Market, By Region, 2020-2033 (USD Billion)
12. Global Micro Mobility Market, By Sharing Type, 2020-2033 (USD Billion)
13. Global Docked Micro Mobility Market, By Region, 2020-2033 (USD Billion)
14. Global Dock-less Micro Mobility Market, By Region, 2020-2033 (USD Billion)
15. Global Micro Mobility Market, By Age Group, 2020-2033 (USD Billion)
16. Global 15-34 Micro Mobility Market, By Region, 2020-2033 (USD Billion)
17. Global 35-54 Micro Mobility Market, By Region, 2020-2033 (USD Billion)
18. Global 55 and Above Micro Mobility Market, By Region, 2020-2033 (USD Billion)
19. Global Micro Mobility Market, By Region, 2020-2033 (USD Billion)
20. North America Micro Mobility Market, By Propulsion Type, 2020-2033 (USD Billion)
21. North America Micro Mobility Market, By Vehicle Use, 2020-2033 (USD Billion)
22. North America Micro Mobility Market, By Sharing Type, 2020-2033 (USD Billion)
23. North America Micro Mobility Market, By Age Group, 2020-2033 (USD Billion)
24. U.S. Micro Mobility Market, By Propulsion Type, 2020-2033 (USD Billion)
25. U.S. Micro Mobility Market, By Vehicle Use, 2020-2033 (USD Billion)
26. U.S. Micro Mobility Market, By Sharing Type, 2020-2033 (USD Billion)
27. U.S. Micro Mobility Market, By Age Group, 2020-2033 (USD Billion)
28. Canada Micro Mobility Market, By Propulsion Type, 2020-2033 (USD Billion)
29. Canada Micro Mobility Market, By Vehicle Use, 2020-2033 (USD Billion)
30. Canada Micro Mobility Market, By Sharing Type, 2020-2033 (USD Billion)
31. Canada Micro Mobility Market, By Age Group, 2020-2033 (USD Billion)
32. Mexico Micro Mobility Market, By Propulsion Type, 2020-2033 (USD Billion)
33. Mexico Micro Mobility Market, By Vehicle Use, 2020-2033 (USD Billion)
34. Mexico Micro Mobility Market, By Sharing Type, 2020-2033 (USD Billion)
35. Mexico Micro Mobility Market, By Age Group, 2020-2033 (USD Billion)
36. Europe Micro Mobility Market, By Propulsion Type, 2020-2033 (USD Billion)
37. Europe Micro Mobility Market, By Vehicle Use, 2020-2033 (USD Billion)
38. Europe Micro Mobility Market, By Sharing Type, 2020-2033 (USD Billion)
39. Europe Micro Mobility Market, By Age Group, 2020-2033 (USD Billion)
40. Germany Micro Mobility Market, By Propulsion Type, 2020-2033 (USD Billion)
41. Germany Micro Mobility Market, By Vehicle Use, 2020-2033 (USD Billion)
42. Germany Micro Mobility Market, By Sharing Type, 2020-2033 (USD Billion)
43. Germany Micro Mobility Market, By Age Group, 2020-2033 (USD Billion)
44. France Micro Mobility Market, By Propulsion Type, 2020-2033 (USD Billion)
45. France Micro Mobility Market, By Vehicle Use, 2020-2033 (USD Billion)
46. France Micro Mobility Market, By Sharing Type, 2020-2033 (USD Billion)
47. France Micro Mobility Market, By Age Group, 2020-2033 (USD Billion)
48. U.K. Micro Mobility Market, By Propulsion Type, 2020-2033 (USD Billion)
49. U.K. Micro Mobility Market, By Vehicle Use, 2020-2033 (USD Billion)
50. U.K. Micro Mobility Market, By Sharing Type, 2020-2033 (USD Billion)
51. U.K. Micro Mobility Market, By Age Group, 2020-2033 (USD Billion)
52. Italy Micro Mobility Market, By Propulsion Type, 2020-2033 (USD Billion)
53. Italy Micro Mobility Market, By Vehicle Use, 2020-2033 (USD Billion)
54. Italy Micro Mobility Market, By Sharing Type, 2020-2033 (USD Billion)
55. Italy Micro Mobility Market, By Age Group, 2020-2033 (USD Billion)
56. Spain Micro Mobility Market, By Propulsion Type, 2020-2033 (USD Billion)
57. Spain Micro Mobility Market, By Vehicle Use, 2020-2033 (USD Billion)
58. Spain Micro Mobility Market, By Sharing Type, 2020-2033 (USD Billion)
59. Spain Micro Mobility Market, By Age Group, 2020-2033 (USD Billion)
60. Asia Pacific Micro Mobility Market, By Propulsion Type, 2020-2033 (USD Billion)
61. Asia Pacific Micro Mobility Market, By Vehicle Use, 2020-2033 (USD Billion)
62. Asia Pacific Micro Mobility Market, By Sharing Type, 2020-2033 (USD Billion)
63. Asia Pacific Micro Mobility Market, By Age Group, 2020-2033 (USD Billion)
64. Japan Micro Mobility Market, By Propulsion Type, 2020-2033 (USD Billion)
65. Japan Micro Mobility Market, By Vehicle Use, 2020-2033 (USD Billion)
66. Japan Micro Mobility Market, By Sharing Type, 2020-2033 (USD Billion)
67. Japan Micro Mobility Market, By Age Group, 2020-2033 (USD Billion)
68. China Micro Mobility Market, By Propulsion Type, 2020-2033 (USD Billion)
69. China Micro Mobility Market, By Vehicle Use, 2020-2033 (USD Billion)
70. China Micro Mobility Market, By Sharing Type, 2020-2033 (USD Billion)
71. China Micro Mobility Market, By Age Group, 2020-2033 (USD Billion)
72. India Micro Mobility Market, By Propulsion Type, 2020-2033 (USD Billion)
73. India Micro Mobility Market, By Vehicle Use, 2020-2033 (USD Billion)
74. India Micro Mobility Market, By Sharing Type, 2020-2033 (USD Billion)
75. India Micro Mobility Market, By Age Group, 2020-2033 (USD Billion)
76. South America Micro Mobility Market, By Propulsion Type, 2020-2033 (USD Billion)
77. South America Micro Mobility Market, By Vehicle Use, 2020-2033 (USD Billion)
78. South America Micro Mobility Market, By Sharing Type, 2020-2033 (USD Billion)
79. South America Micro Mobility Market, By Age Group, 2020-2033 (USD Billion)
80. Brazil Micro Mobility Market, By Propulsion Type, 2020-2033 (USD Billion)
81. Brazil Micro Mobility Market, By Vehicle Use, 2020-2033 (USD Billion)
82. Brazil Micro Mobility Market, By Sharing Type, 2020-2033 (USD Billion)
83. Brazil Micro Mobility Market, By Age Group, 2020-2033 (USD Billion)
84. Middle East and Africa Micro Mobility Market, By Propulsion Type, 2020-2033 (USD Billion)
85. Middle East and Africa Micro Mobility Market, By Vehicle Use, 2020-2033 (USD Billion)
86. Middle East and Africa Micro Mobility Market, By Sharing Type, 2020-2033 (USD Billion)
87. Middle East and Africa Micro Mobility Market, By Age Group, 2020-2033 (USD Billion)
88. UAE Micro Mobility Market, By Propulsion Type, 2020-2033 (USD Billion)
89. UAE Micro Mobility Market, By Vehicle Use, 2020-2033 (USD Billion)
90. UAE Micro Mobility Market, By Sharing Type, 2020-2033 (USD Billion)
91. UAE Micro Mobility Market, By Age Group, 2020-2033 (USD Billion)
92. South Africa Micro Mobility Market, By Propulsion Type, 2020-2033 (USD Billion)
93. South Africa Micro Mobility Market, By Vehicle Use, 2020-2033 (USD Billion)
94. South Africa Micro Mobility Market, By Sharing Type, 2020-2033 (USD Billion)
95. South Africa Micro Mobility Market, By Age Group, 2020-2033 (USD Billion)
List of Figures
1. Global Micro Mobility Market Segmentation
2. Micro Mobility Market: Research Methodology
3. Market Size Estimation Methodology: Bottom-Up Approach
4. Market Size Estimation Methodology: Top-Down Approach
5. Data Triangulation
6. Porter’s Five Forces Analysis
7. Value Chain Analysis
8. Global Micro Mobility Market Attractiveness Analysis by Propulsion Type
9. Global Micro Mobility Market Attractiveness Analysis by Vehicle Use
10. Global Micro Mobility Market Attractiveness Analysis by Sharing Type
11. Global Micro Mobility Market Attractiveness Analysis by Age Group
12. Global Micro Mobility Market Attractiveness Analysis by Region
13. Global Micro Mobility Market: Dynamics
14. Global Micro Mobility Market Share by Propulsion Type (2023 & 2033)
15. Global Micro Mobility Market Share by Vehicle Use (2023 & 2033)
16. Global Micro Mobility Market Share by Sharing Type (2023 & 2033)
17. Global Micro Mobility Market Share by Age Group (2023 & 2033)
18. Global Micro Mobility Market Share by Regions (2023 & 2033)
19. Global Micro Mobility Market Share by Company (2023)
This study forecasts revenue at global, regional, and country levels from 2020 to 2033. The Brainy Insights has segmented the global micro mobility market based on below mentioned segments:
Global Micro Mobility Market by Propulsion Type:
Global Micro Mobility Market by Vehicle Use:
Global Micro Mobility Market by Sharing Type:
Global Micro Mobility Market by Age Group:
Global Micro Mobility Market by Region:
Research has its special purpose to undertake marketing efficiently. In this competitive scenario, businesses need information across all industry verticals; the information about customer wants, market demand, competition, industry trends, distribution channels etc. This information needs to be updated regularly because businesses operate in a dynamic environment. Our organization, The Brainy Insights incorporates scientific and systematic research procedures in order to get proper market insights and industry analysis for overall business success. The analysis consists of studying the market from a miniscule level wherein we implement statistical tools which helps us in examining the data with accuracy and precision.
Our research reports feature both; quantitative and qualitative aspects for any market. Qualitative information for any market research process are fundamental because they reveal the customer needs and wants, usage and consumption for any product/service related to a specific industry. This in turn aids the marketers/investors in knowing certain perceptions of the customers. Qualitative research can enlighten about the different product concepts and designs along with unique service offering that in turn, helps define marketing problems and generate opportunities. On the other hand, quantitative research engages with the data collection process through interviews, e-mail interactions, surveys and pilot studies. Quantitative aspects for the market research are useful to validate the hypotheses generated during qualitative research method, explore empirical patterns in the data with the help of statistical tools, and finally make the market estimations.
The Brainy Insights offers comprehensive research and analysis, based on a wide assortment of factual insights gained through interviews with CXOs and global experts and secondary data from reliable sources. Our analysts and industry specialist assume vital roles in building up statistical tools and analysis models, which are used to analyse the data and arrive at accurate insights with exceedingly informative research discoveries. The data provided by our organization have proven precious to a diverse range of companies, facilitating them to address issues such as determining which products/services are the most appealing, whether or not customers use the product in the manner anticipated, the purchasing intentions of the market and many others.
Our research methodology encompasses an idyllic combination of primary and secondary initiatives. Key phases involved in this process are listed below:

The phase involves the gathering and collecting of market data and its related information with the help of different sources & research procedures.

The data procurement stage involves in data gathering and collecting through various data sources.
This stage involves in extensive research. These data sources includes:
Purchased Database: Purchased databases play a crucial role in estimating the market sizes irrespective of the domain. Our purchased database includes:
Primary Research: The Brainy Insights interacts with leading companies and experts of the concerned domain to develop the analyst team’s market understanding and expertise. It improves and substantiates every single data presented in the market reports. Primary research mainly involves in telephonic interviews, E-mail interactions and face-to-face interviews with the raw material providers, manufacturers/producers, distributors, & independent consultants. The interviews that we conduct provides valuable data on market size and industry growth trends prevailing in the market. Our organization also conducts surveys with the various industry experts in order to gain overall insights of the industry/market. For instance, in healthcare industry we conduct surveys with the pharmacists, doctors, surgeons and nurses in order to gain insights and key information of a medical product/device/equipment which the customers are going to usage. Surveys are conducted in the form of questionnaire designed by our own analyst team. Surveys plays an important role in primary research because surveys helps us to identify the key target audiences of the market. Additionally, surveys helps to identify the key target audience engaged with the market. Our survey team conducts the survey by targeting the key audience, thus gaining insights from them. Based on the perspectives of the customers, this information is utilized to formulate market strategies. Moreover, market surveys helps us to understand the current competitive situation of the industry. To be precise, our survey process typically involve with the 360 analysis of the market. This analytical process begins by identifying the prospective customers for a product or service related to the market/industry to obtain data on how a product/service could fit into customers’ lives.

Secondary Research: The secondary data sources includes information published by the on-profit organizations such as World bank, WHO, company fillings, investor presentations, annual reports, national government documents, statistical databases, blogs, articles, white papers and others. From the annual report, we analyse a company’s revenue to understand the key segment and market share of that organization in a particular region. We analyse the company websites and adopt the product mapping technique which is important for deriving the segment revenue. In the product mapping method, we select and categorize the products offered by the companies catering to domain specific market, deduce the product revenue for each of the companies so as to get overall estimation of the market size. We also source data and analyses trends based on information received from supply side and demand side intermediaries in the value chain. The supply side denotes the data gathered from supplier, distributor, wholesaler and the demand side illustrates the data gathered from the end customers for respective market domain.

The supply side for a domain specific market is analysed by:
The demand side for the market is estimated through:
In-house Library: Apart from these third-party sources, we have our in-house library of qualitative and quantitative information. Our in-house database includes market data for various industry and domains. These data are updated on regular basis as per the changing market scenario. Our library includes, historic databases, internal audit reports and archives.
Sometimes there are instances where there is no metadata or raw data available for any domain specific market. For those cases, we use our expertise to forecast and estimate the market size in order to generate comprehensive data sets. Our analyst team adopt a robust research technique in order to produce the estimates:
Data Synthesis: This stage involves the analysis & mapping of all the information obtained from the previous step. It also involves in scrutinizing the data for any discrepancy observed while data gathering related to the market. The data is collected with consideration to the heterogeneity of sources. Robust scientific techniques are in place for synthesizing disparate data sets and provide the essential contextual information that can orient market strategies. The Brainy Insights has extensive experience in data synthesis where the data passes through various stages:


Market Deduction & Formulation: The final stage comprises of assigning data points at appropriate market spaces so as to deduce feasible conclusions. Analyst perspective & subject matter expert based holistic form of market sizing coupled with industry analysis also plays a crucial role in this stage.
This stage involves in finalization of the market size and numbers that we have collected from data integration step. With data interpolation, it is made sure that there is no gap in the market data. Successful trend analysis is done by our analysts using extrapolation techniques, which provide the best possible forecasts for the market.
Data Validation & Market Feedback: Validation is the most important step in the process. Validation & re-validation via an intricately designed process helps us finalize data-points to be used for final calculations.

The Brainy Insights interacts with leading companies and experts of the concerned domain to develop the analyst team’s market understanding and expertise. It improves and substantiates every single data presented in the market reports. The data validation interview and discussion panels are typically composed of the most experienced industry members. The participants include, however, are not limited to:
Moreover, we always validate our data and findings through primary respondents from all the major regions we are working on.


Free Customization
Fortune 500 Clients
Free Yearly Update On Purchase Of Multi/Corporate License
Companies Served Till Date