- +1-315-215-1633
- sales@thebrainyinsights.com

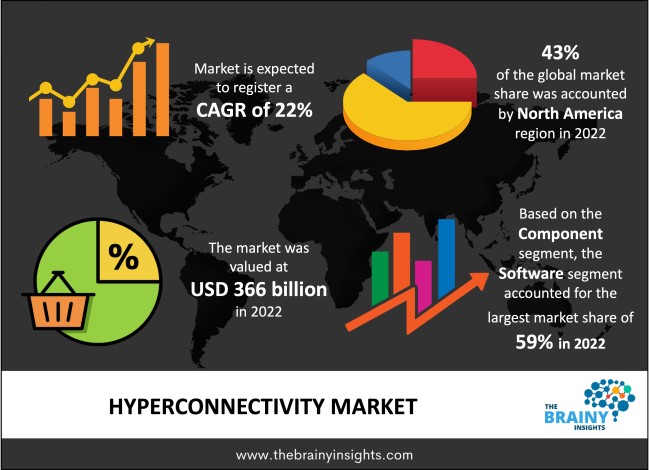
The global hyperconnectivity market is expected to grow from USD 366 billion in 2022 to USD 2673.49 billion by 2032, at a CAGR of 22% from 2023-2032. The fourth industrial revolution, or industry 4.0, will augment the growth of the global hyperconnectivity market.
The advent of the internet changed the global economic landscape. It made things efficient, accessible, optimal and faster. The internet formed the basis of communication, trade, information exchange and entertainment. Further technological advancements led to a complete domination of the internet over all aspects of individual life. Industrialization 4.0 drives the automation and digitization of all economical sectors and promotes social well-being through innovative devices and systems. The success of automation and digitization is based on a robust data connectivity network. For instance, using all the amenities like operating banking services through mobile apps, controlling home utilities remotely, faster communication, and safe digital payment getaways depend on uninterrupted, secure and fast data connectivity. Hyperconnectivity can be defined as the uninterrupted, secure, fast and efficient network of connection between smart connected devices, automated utilities and digitized data and information. The common thread between all the networks is the internet which facilitates the operation of previously mentioned utilities. Hyperconnectivity will improve real-time data dissipation, processing, monitoring and control, enhancing decision-making and delivering results. The seamless hyperconnectivity will ensure the smooth functioning of supply chains, information transfer, and uninterrupted communication. Hyperconnectivity entails seamless connection between machines, devices, human-machine interaction and the internet of things. Hyperconnectivity can improve governance and social well-being by building a robust infrastructure that allows government authorities to communicate important information without wasting time to deliver timely results. For instance, it can send cyclone and heatwave alerts that prevent damage and reduce loss of life and property. Therefore, hyperconnectivity will play a significant and central role in global sustainable development.
Get an overview of this study by requesting a free sample
July 2022 – Hanwha Systems are developing the OneWeb low Earth orbit (LEO) satellite communications system as part of a 5G-based tactical communications system. It will have an integrated, flexible terminal powered by a smartphone and revolutionary Hanwha Phasor satcom antenna technology (IVT). The development program's goal is to deliver "hyperconnectivity for multidomain operations. In addition to the IVT, other devices connected to the terrestrial layer include high-capacity large base stations, small cell base stations, and multilayer network controllers (MLNC). The MLNC manages the routing of messages across the various communication channels, and it chooses the best medium for each communication type and priority.
The fourth industrial revolution – The world has undergone three industrial revolutions, each defined by a different driving force. The present industrial revolution, or industry 4.0, is characterized by automation, digitization and smart connected technologies. Cloud computing, the internet of things, digital twins, robotics, Artificial intelligence, cyber security and machine learning are the fundamental components of industry 4.0. the increasing adoption of automation and digitization in economic sectors can be attributed to the ability of smart technologies to offer real-time data, which aids in informed decision-making, increases productivity, and provides flexibility and agility to operations. These devices and systems optimize supply chain logistics, customer management, delivery downtime, operations, maintenance, assembly and production lines. These automated smart manufacturing technologies facilitate real-time data acquisition, processing, visibility, monitoring, and control of company assets. The multiple benefits offered by industry 4.0 to the several economic sectors are enabled by hyperconnectivity. The robust network of machines, devices, systems, data and information with seamless interconnectivity, fast dissipation, transfer and security form the fundamental basis of adopting industry 4.0 and exploiting its potential benefits. Therefore, the fourth industrial revolution will bode well for the hyperconnectivity market and drive its growth and development in the forecast period.
The lack of infrastructure – Hyperconnectivity integrates information technology with operational technology to facilitate faster communications. Several components, like devices, equipment, software, data and transmission lines, facilitate hyperconnectivity. The developed world has the necessary infrastructure to enable hyperconnectivity. However, the developing and under-developed are struggling to build the infrastructure to enable hyperconnectivity. For instance, a developed country like Japan has optic fibre infrastructure which covers most of its country, offering 5G connectivity to its citizens.
In contrast, developed countries are struggling to provide last-mile energy delivery. The developing countries have the necessary infrastructure for hyperconnectivity restricted to their urban clusters, and the partial coverage limit's the potential applications of hyperconnectivity. Therefore, the lack of infrastructure, awareness, access to resources, capital and politics will limit the market's growth in first-world countries.
The development of smart cities – A smart city is a technologically advanced metropolitan area that uses daily automation, digitization, IoT, artificial intelligence, and IT. The foundation of a smart city is built on data gathering, processing, disseminating information, seamless communication, real-time monitoring, and control of operations. They enable the government to manage the city sustainably and effectively. To put it another way, a smart city uses information technology and operational technology to optimize administrative services, improve public services and raise its citizens' quality of life and well-being. A smart city must have sufficient water, reliable energy, and sanitary facilities. The objective is to employ ICT to provide efficient urban mobility, cheap housing, and public transportation. The foundation of a smart city is robust IT connectivity and digitization that will enable good governance. The global market for hyperconnectivity will benefit significantly from the increased focus on creating smart cities, particularly in emerging nations.
The lack of robust cybersecurity infrastructure – Hyperconnectivity in defence, education, health and government institutions is fraught with risks without safe and secure cybersecurity infrastructure. The data and information storage, processing, exchange and transmission are prone to cyber-attacks. The data and information of these critical sectors are vital to national security or are sensitive personal information, the attack on which can compromise national interests and privacy. There is a lack of robust cyber security infrastructure in several nations, including developed countries. Therefore, the lack of robust cybersecurity infrastructure will challenge the expansion of the global hyperconnectivity market.
The regions analyzed for the market include North America, Europe, South America, Asia Pacific, the Middle East, and Africa. North America emerged as the most significant global hyperconnectivity market, with a 43% market revenue share in 2022. The United States of America dominates the North American market. The region's well-established information technology and operational technology infrastructure facilitates their seamless and faster integration driving the regional hyperconnectivity market's growth. Access to the latest devices, technologies, software, and systems will aid in the market's development. The high penetration of internet connectivity facilitated by the presence of significant private market players will augment the market's growth. The government's push towards automation and digitization of the economic sector to improve productivity, and efficiency, reduce errors, product optimization, and cost savings will drive the market's expansion.
North America region Hyperconnectivity Market Share in 2022 - 43%
www.thebrainyinsights.com
Check the geographical analysis of this market by requesting a free sample
The product type segment is divided into enterprise wearable devices, cloud platforms, network and communications, middleware software, business solutions, and others. The cloud platforms segment dominated the market with a market share of around 32% in 2022. Cloud computing is one of the fundamental drivers of industry 4.0. It can be defined as a platform that offers a range of IT and business services through the interest. It enables the users to store, process, monitor, control, enter, edit and delete data or information remotely, safely and securely. It is cost-efficient, safe, secure, flexible, and easy to use. It improves quality control, collaboration, and integration reduces data loss and prevents the waste of resources. It offers advanced services like real-time, quick and affordable data processing and analysis. It can be customized according to the company's requirements and upgraded more often without heavy investments or excessive delays. Hyperconnectivity is the basis of cloud platforms as it is offered on the internet, work through the internet and needs the internet for their operations. Therefore, cloud platforms will dominate the global hyperconnectivity market.
The component is divided into software and services. The software segment dominated the market with a market share of around 59% in 2022. Software is a set of data, instructions, and programs developed to carry out specific tasks or operations. In layman's words, it can be described as the reverse of a computer's hardware. For instance, the programmes, scripts, and apps collectively incorporated into a mobile phone or other smart devices are defined as software. The software comes in various forms, including word processing, graphic design, spreadsheets, etc. The software makes optimization possible and increases productivity, accuracy, results, and flexibility. It allows for customization, hassle-free upgradeability, easy applications and integration and high levels of safety and security. Software's advantages in terms of cost-effectiveness, optimization, flexibility, choice, and other features account for the segment's dominance in the market.
The organization size is divided into small and medium enterprises and large enterprises. The large enterprises' segment dominated the market with a market share of around 64% in 2022. The pre-requisite infrastructure for hyperconnectivity involves substantial capital investment. Large enterprises can undertake the requirements given the extensive resources under them. The range of operations, vast amounts of data and a large network of large enterprises make hyperconnectivity a fundamental necessity for optimization, efficiency and productivity. Hyperconnectivity improves production output, quality, customer management and supply chain logistics, which is essential for large enterprises given their area of operation. The infrastructural requirements of establishing robust hyperconnectivity entail vast resources and capital, which large enterprises can invest in, thereby driving the segment's growth.
The end user is divided into BFSI, IT and telecommunications, manufacturing, media and entertainment, healthcare and life sciences, government, retail and E-commerce, and others. The IT and telecommunications segment dominated the market with a market share of around 34% in 2022. Information technology is the creation, processing, storage, and transmission of all forms of electronic data. IT includes using computers, networking, storage, and other physical devices. Various technologies transmit information over wire, radio, optical, or other electromagnetic channels, and these communication channels define the telecommunications sector. IT and telecommunications are foundational structures of the contemporary world, gravitating towards automation and digitization. They support multiple economic and social sectors like banking, finance, health, education, manufacturing and governance. IT and telecommunications have the necessary infrastructure to facilitate hyperconnectivity. They are the driving force of hyperconnectivity in the global economy. Therefore, the presence of well-established storage, networking and transmission infrastructure, the integration and upgradation to achieve hyperconnectivity in the IT and telecommunications segment is the fastest, explaining its dominance in the market.
| Attribute | Description |
|---|---|
| Market Size | Revenue (USD Billion) |
| Market size value in 2022 | USD 366 Billion |
| Market size value in 2032 | USD 2673.49 Billion |
| CAGR (2023 to 2032) | 22% |
| Historical data | 2019-2021 |
| Base Year | 2022 |
| Forecast | 2023-2032 |
| Regional Segments | The regions examined for the market are Europe, Asia Pacific, North America, South America, and Middle East & Africa. |
| Segments | The research segment is based on product type, component, organization size and end user. |
As per The Brainy Insights, the size of the global hyperconnectivity market was valued at USD 366 billion in 2022 to USD 2673.49 billion by 2032.
Global hyperconnectivity market is growing at a CAGR of 22% during the forecast period 2023-2032.
The market's growth will be influenced by the fourth industrial revolution.
The lack of infrastructure could hamper the market growth.
List of Table
1. Global Hyperconnectivity Market, By Product Type, 2019-2032 (USD Billion)
2. Global Enterprise Wearable Devices Hyperconnectivity Market, By Region, 2019-2032 (USD Billion)
3. Global Cloud Platforms Hyperconnectivity Market, By Region, 2019-2032 (USD Billion)
4. Global Network and Communications Hyperconnectivity Market, By Region, 2019-2032 (USD Billion)
5. Global Middleware Software Hyperconnectivity Market, By Region, 2019-2032 (USD Billion)
6. Global Business Solutions Hyperconnectivity Market, By Region, 2019-2032 (USD Billion)
7. Global Others Hyperconnectivity Market, By Region, 2019-2032 (USD Billion)
8. Global Hyperconnectivity Market, By Component, 2019-2032 (USD Billion)
9. Global Software Hyperconnectivity Market, By Region, 2019-2032 (USD Billion)
10. Global Services Hyperconnectivity Market, By Region, 2019-2032 (USD Billion)
11. Global Hyperconnectivity Market, By Organization Size, 2019-2032 (USD Billion)
12. Global Small and Medium Enterprises Hyperconnectivity Market, By Region, 2019-2032 (USD Billion)
13. Global Large Enterprises Hyperconnectivity Market, By Region, 2019-2032 (USD Billion)
14. Global Hyperconnectivity Market, By End User, 2019-2032 (USD Billion)
15. Global BFSI Hyperconnectivity Market, By Region, 2019-2032 (USD Billion)
16. Global IT Hyperconnectivity Market, By Region, 2019-2032 (USD Billion)
17. Global Telecommunications Hyperconnectivity Market, By Region, 2019-2032 (USD Billion)
18. Global Manufacturing Hyperconnectivity Market, By Region, 2019-2032 (USD Billion)
19. Global Media and Entertainment Hyperconnectivity Market, By Region, 2019-2032 (USD Billion)
20. Global Healthcare and Life Sciences Hyperconnectivity Market, By Region, 2019-2032 (USD Billion)
21. Global Government Hyperconnectivity Market, By Region, 2019-2032 (USD Billion)
22. Global Retail and E-Commerce Hyperconnectivity Market, By Region, 2019-2032 (USD Billion)
23. Global Others Hyperconnectivity Market, By Region, 2019-2032 (USD Billion)
24. Global Hyperconnectivity Market, By Region, 2019-2032 (USD Billion)
25. North America Hyperconnectivity Market, By Product Type, 2019-2032 (USD Billion)
26. North America Hyperconnectivity Market, By Component, 2019-2032 (USD Billion)
27. North America Hyperconnectivity Market, By Organization Size, 2019-2032 (USD Billion)
28. North America Hyperconnectivity Market, By End User, 2019-2032 (USD Billion)
29. U.S. Hyperconnectivity Market, By Product Type, 2019-2032 (USD Billion)
30. U.S. Hyperconnectivity Market, By Component, 2019-2032 (USD Billion)
31. U.S. Hyperconnectivity Market, By Organization Size, 2019-2032 (USD Billion)
32. U.S. Hyperconnectivity Market, By End User, 2019-2032 (USD Billion)
33. Canada Hyperconnectivity Market, By Product Type, 2019-2032 (USD Billion)
34. Canada Hyperconnectivity Market, By Component, 2019-2032 (USD Billion)
35. Canada Hyperconnectivity Market, By Organization Size, 2019-2032 (USD Billion)
36. Canada Hyperconnectivity Market, By End User, 2019-2032 (USD Billion)
37. Mexico Hyperconnectivity Market, By Product Type, 2019-2032 (USD Billion)
38. Mexico Hyperconnectivity Market, By Component, 2019-2032 (USD Billion)
39. Mexico Hyperconnectivity Market, By Organization Size, 2019-2032 (USD Billion)
40. Mexico Hyperconnectivity Market, By End User, 2019-2032 (USD Billion)
41. Europe Hyperconnectivity Market, By Product Type, 2019-2032 (USD Billion)
42. Europe Hyperconnectivity Market, By Component, 2019-2032 (USD Billion)
43. Europe Hyperconnectivity Market, By Organization Size, 2019-2032 (USD Billion)
44. Europe Hyperconnectivity Market, By End User, 2019-2032 (USD Billion)
45. Germany Hyperconnectivity Market, By Product Type, 2019-2032 (USD Billion)
46. Germany Hyperconnectivity Market, By Component, 2019-2032 (USD Billion)
47. Germany Hyperconnectivity Market, By Organization Size, 2019-2032 (USD Billion)
48. Germany Hyperconnectivity Market, By End User, 2019-2032 (USD Billion)
49. France Hyperconnectivity Market, By Product Type, 2019-2032 (USD Billion)
50. France Hyperconnectivity Market, By Component, 2019-2032 (USD Billion)
51. France Hyperconnectivity Market, By Organization Size, 2019-2032 (USD Billion)
52. France Hyperconnectivity Market, By End User, 2019-2032 (USD Billion)
53. U.K. Hyperconnectivity Market, By Product Type, 2019-2032 (USD Billion)
54. U.K. Hyperconnectivity Market, By Component, 2019-2032 (USD Billion)
55. U.K. Hyperconnectivity Market, By Organization Size, 2019-2032 (USD Billion)
56. U.K. Hyperconnectivity Market, By End User, 2019-2032 (USD Billion)
57. Italy Hyperconnectivity Market, By Product Type, 2019-2032 (USD Billion)
58. Italy Hyperconnectivity Market, By Component, 2019-2032 (USD Billion)
59. Italy Hyperconnectivity Market, By Organization Size, 2019-2032 (USD Billion)
60. Italy Hyperconnectivity Market, By End User, 2019-2032 (USD Billion)
61. Spain Hyperconnectivity Market, By Product Type, 2019-2032 (USD Billion)
62. Spain Hyperconnectivity Market, By Component, 2019-2032 (USD Billion)
63. Spain Hyperconnectivity Market, By Organization Size, 2019-2032 (USD Billion)
64. Spain Hyperconnectivity Market, By End User, 2019-2032 (USD Billion)
65. Asia Pacific Hyperconnectivity Market, By Product Type, 2019-2032 (USD Billion)
66. Asia Pacific Hyperconnectivity Market, By Component, 2019-2032 (USD Billion)
67. Asia Pacific Hyperconnectivity Market, By Organization Size, 2019-2032 (USD Billion)
68. Asia Pacific Hyperconnectivity Market, By End User, 2019-2032 (USD Billion)
69. Japan Hyperconnectivity Market, By Product Type, 2019-2032 (USD Billion)
70. Japan Hyperconnectivity Market, By Component, 2019-2032 (USD Billion)
71. Japan Hyperconnectivity Market, By Organization Size, 2019-2032 (USD Billion)
72. Japan Hyperconnectivity Market, By End User, 2019-2032 (USD Billion)
73. China Hyperconnectivity Market, By Product Type, 2019-2032 (USD Billion)
74. China Hyperconnectivity Market, By Component, 2019-2032 (USD Billion)
75. China Hyperconnectivity Market, By Organization Size, 2019-2032 (USD Billion)
76. China Hyperconnectivity Market, By End User, 2019-2032 (USD Billion)
77. India Hyperconnectivity Market, By Product Type, 2019-2032 (USD Billion)
78. India Hyperconnectivity Market, By Component, 2019-2032 (USD Billion)
79. India Hyperconnectivity Market, By Organization Size, 2019-2032 (USD Billion)
80. India Hyperconnectivity Market, By End User, 2019-2032 (USD Billion)
81. South America Hyperconnectivity Market, By Product Type, 2019-2032 (USD Billion)
82. South America Hyperconnectivity Market, By Component, 2019-2032 (USD Billion)
83. South America Hyperconnectivity Market, By Organization Size, 2019-2032 (USD Billion)
84. South America Hyperconnectivity Market, By End User, 2019-2032 (USD Billion)
85. Brazil Hyperconnectivity Market, By Product Type, 2019-2032 (USD Billion)
86. Brazil Hyperconnectivity Market, By Component, 2019-2032 (USD Billion)
87. Brazil Hyperconnectivity Market, By Organization Size, 2019-2032 (USD Billion)
88. Brazil Hyperconnectivity Market, By End User, 2019-2032 (USD Billion)
89. Middle East and Africa Hyperconnectivity Market, By Product Type, 2019-2032 (USD Billion)
90. Middle East and Africa Hyperconnectivity Market, By Component, 2019-2032 (USD Billion)
91. Middle East and Africa Hyperconnectivity Market, By Organization Size, 2019-2032 (USD Billion)
92. Middle East and Africa Hyperconnectivity Market, By End User, 2019-2032 (USD Billion)
93. UAE Hyperconnectivity Market, By Product Type, 2019-2032 (USD Billion)
94. UAE Hyperconnectivity Market, By Component, 2019-2032 (USD Billion)
95. UAE Hyperconnectivity Market, By Organization Size, 2019-2032 (USD Billion)
96. UAE Hyperconnectivity Market, By End User, 2019-2032 (USD Billion)
97. South Africa Hyperconnectivity Market, By Product Type, 2019-2032 (USD Billion)
98. South Africa Hyperconnectivity Market, By Component, 2019-2032 (USD Billion)
99. South Africa Hyperconnectivity Market, By Organization Size, 2019-2032 (USD Billion)
100. South Africa Hyperconnectivity Market, By End User, 2019-2032 (USD Billion)
List of Figures
1. Global Hyperconnectivity Market Segmentation
2. Hyperconnectivity Market: Research Methodology
3. Market Size Estimation Methodology: Bottom-Up Approach
4. Market Size Estimation Methodology: Top-Down Approach
5. Data Triangulation
6. Porter’s Five Forces Analysis
7. Value Chain Analysis
8. Global Hyperconnectivity Market Attractiveness Analysis by Product Type
9. Global Hyperconnectivity Market Attractiveness Analysis by Component
10. Global Hyperconnectivity Market Attractiveness Analysis by Organization Size
11. Global Hyperconnectivity Market Attractiveness Analysis by End User
12. Global Hyperconnectivity Market Attractiveness Analysis by Region
13. Global Hyperconnectivity Market: Dynamics
14. Global Hyperconnectivity Market Share by Product Type (2022 & 2032)
15. Global Hyperconnectivity Market Share by Component (2022 & 2032)
16. Global Hyperconnectivity Market Share by Organization Size (2022 & 2032)
17. Global Hyperconnectivity Market Share by End User (2022 & 2032)
18. Global Hyperconnectivity Market Share by Regions (2022 & 2032)
19. Global Hyperconnectivity Market Share by Company (2022)
This study forecasts revenue at global, regional, and country levels from 2019 to 2032. The Brainy Insights has segmented the global hyperconnectivity market based on below mentioned segments:
Global Hyperconnectivity Market by Product Type:
Global Hyperconnectivity Market by Component:
Global Hyperconnectivity Market by Organization Size:
Global Hyperconnectivity Market by End User:
Global Hyperconnectivity Market by Region:
Research has its special purpose to undertake marketing efficiently. In this competitive scenario, businesses need information across all industry verticals; the information about customer wants, market demand, competition, industry trends, distribution channels etc. This information needs to be updated regularly because businesses operate in a dynamic environment. Our organization, The Brainy Insights incorporates scientific and systematic research procedures in order to get proper market insights and industry analysis for overall business success. The analysis consists of studying the market from a miniscule level wherein we implement statistical tools which helps us in examining the data with accuracy and precision.
Our research reports feature both; quantitative and qualitative aspects for any market. Qualitative information for any market research process are fundamental because they reveal the customer needs and wants, usage and consumption for any product/service related to a specific industry. This in turn aids the marketers/investors in knowing certain perceptions of the customers. Qualitative research can enlighten about the different product concepts and designs along with unique service offering that in turn, helps define marketing problems and generate opportunities. On the other hand, quantitative research engages with the data collection process through interviews, e-mail interactions, surveys and pilot studies. Quantitative aspects for the market research are useful to validate the hypotheses generated during qualitative research method, explore empirical patterns in the data with the help of statistical tools, and finally make the market estimations.
The Brainy Insights offers comprehensive research and analysis, based on a wide assortment of factual insights gained through interviews with CXOs and global experts and secondary data from reliable sources. Our analysts and industry specialist assume vital roles in building up statistical tools and analysis models, which are used to analyse the data and arrive at accurate insights with exceedingly informative research discoveries. The data provided by our organization have proven precious to a diverse range of companies, facilitating them to address issues such as determining which products/services are the most appealing, whether or not customers use the product in the manner anticipated, the purchasing intentions of the market and many others.
Our research methodology encompasses an idyllic combination of primary and secondary initiatives. Key phases involved in this process are listed below:

The phase involves the gathering and collecting of market data and its related information with the help of different sources & research procedures.

The data procurement stage involves in data gathering and collecting through various data sources.
This stage involves in extensive research. These data sources includes:
Purchased Database: Purchased databases play a crucial role in estimating the market sizes irrespective of the domain. Our purchased database includes:
Primary Research: The Brainy Insights interacts with leading companies and experts of the concerned domain to develop the analyst team’s market understanding and expertise. It improves and substantiates every single data presented in the market reports. Primary research mainly involves in telephonic interviews, E-mail interactions and face-to-face interviews with the raw material providers, manufacturers/producers, distributors, & independent consultants. The interviews that we conduct provides valuable data on market size and industry growth trends prevailing in the market. Our organization also conducts surveys with the various industry experts in order to gain overall insights of the industry/market. For instance, in healthcare industry we conduct surveys with the pharmacists, doctors, surgeons and nurses in order to gain insights and key information of a medical product/device/equipment which the customers are going to usage. Surveys are conducted in the form of questionnaire designed by our own analyst team. Surveys plays an important role in primary research because surveys helps us to identify the key target audiences of the market. Additionally, surveys helps to identify the key target audience engaged with the market. Our survey team conducts the survey by targeting the key audience, thus gaining insights from them. Based on the perspectives of the customers, this information is utilized to formulate market strategies. Moreover, market surveys helps us to understand the current competitive situation of the industry. To be precise, our survey process typically involve with the 360 analysis of the market. This analytical process begins by identifying the prospective customers for a product or service related to the market/industry to obtain data on how a product/service could fit into customers’ lives.

Secondary Research: The secondary data sources includes information published by the on-profit organizations such as World bank, WHO, company fillings, investor presentations, annual reports, national government documents, statistical databases, blogs, articles, white papers and others. From the annual report, we analyse a company’s revenue to understand the key segment and market share of that organization in a particular region. We analyse the company websites and adopt the product mapping technique which is important for deriving the segment revenue. In the product mapping method, we select and categorize the products offered by the companies catering to domain specific market, deduce the product revenue for each of the companies so as to get overall estimation of the market size. We also source data and analyses trends based on information received from supply side and demand side intermediaries in the value chain. The supply side denotes the data gathered from supplier, distributor, wholesaler and the demand side illustrates the data gathered from the end customers for respective market domain.

The supply side for a domain specific market is analysed by:
The demand side for the market is estimated through:
In-house Library: Apart from these third-party sources, we have our in-house library of qualitative and quantitative information. Our in-house database includes market data for various industry and domains. These data are updated on regular basis as per the changing market scenario. Our library includes, historic databases, internal audit reports and archives.
Sometimes there are instances where there is no metadata or raw data available for any domain specific market. For those cases, we use our expertise to forecast and estimate the market size in order to generate comprehensive data sets. Our analyst team adopt a robust research technique in order to produce the estimates:
Data Synthesis: This stage involves the analysis & mapping of all the information obtained from the previous step. It also involves in scrutinizing the data for any discrepancy observed while data gathering related to the market. The data is collected with consideration to the heterogeneity of sources. Robust scientific techniques are in place for synthesizing disparate data sets and provide the essential contextual information that can orient market strategies. The Brainy Insights has extensive experience in data synthesis where the data passes through various stages:


Market Deduction & Formulation: The final stage comprises of assigning data points at appropriate market spaces so as to deduce feasible conclusions. Analyst perspective & subject matter expert based holistic form of market sizing coupled with industry analysis also plays a crucial role in this stage.
This stage involves in finalization of the market size and numbers that we have collected from data integration step. With data interpolation, it is made sure that there is no gap in the market data. Successful trend analysis is done by our analysts using extrapolation techniques, which provide the best possible forecasts for the market.
Data Validation & Market Feedback: Validation is the most important step in the process. Validation & re-validation via an intricately designed process helps us finalize data-points to be used for final calculations.

The Brainy Insights interacts with leading companies and experts of the concerned domain to develop the analyst team’s market understanding and expertise. It improves and substantiates every single data presented in the market reports. The data validation interview and discussion panels are typically composed of the most experienced industry members. The participants include, however, are not limited to:
Moreover, we always validate our data and findings through primary respondents from all the major regions we are working on.


Free Customization
Fortune 500 Clients
Free Yearly Update On Purchase Of Multi/Corporate License
Companies Served Till Date