- +1-315-215-1633
- sales@thebrainyinsights.com

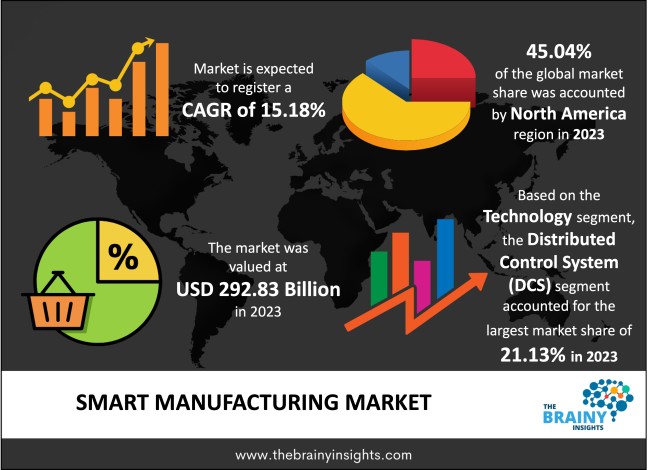
The global smart manufacturing market was valued at USD 292.83 billion in 2023, growing at a CAGR of 15.18% from 2024 to 2033. The market is expected to reach USD 1,203.38 billion by 2033. The increasing demand for automation to achieve quality & efficiency, coupled with the proliferation of the Internet of Things, is propelling market growth. The COVID-19 outbreak particularly influenced the manufacturing industry by reducing its dependency on manual labour & highlighted the importance of adopting advanced technologies like IoT, AI, and machine learning. Therefore, smart factory technologies are increasingly adopted by various industries in their production processes. Smart manufacturing is a growing sub-category in several sectors. The surge in technology like AI, ML, automation, and robotics offers good opportunities for the smart manufacturing industries to grow.
Smart manufacturing is a broad manufacturing type that employs computer-integrated manufacturing, rapid design changes, high adaptability, digital information technology, and more flexible technical workforce training. Smart manufacturing is a method that optimizes manufacturing processes via artificial intelligence (AI), Big Data analytics, automation, the Internet of Things (IoT), cloud computing, and automated controls that minimize costs & maximize productivity. It also includes using sensors & data collection instruments that help optimize the manufacturing method by providing real-time data, improving quality, predictive maintenance, reducing downtime, and growing the agility of the systems. Smart factory also facilitates a sustainable & eco-friendly production method by energy consumption, reducing waste and emissions.
Get an overview of this study by requesting a free sample
The rising number of investments in Industry 4.0: The increased adoption of Industry 4.0 technologies has primarily raised efficiency, productivity, and quality in the manufacturing industry, which is the driving factor of the market growth. Additionally, the expanding emphasis on regulatory compliance & increasing government participation in supporting industrial automation is expected to propel market growth over the forecast period. Moreover, the surging effectiveness of production processes is also helping to boost market growth.
The high capital & operating expenses: The high capital and operating expenses are the restraining factor of the market growth. Moreover, implementing smart manufacturing technologies can be expensive, particularly for small and medium-sized enterprises (SMEs) with limited resources. Additionally, the high expenses associated with smart manufacturing technology in developing areas will hinder market growth during the forecast period.
The rising demand for industrial automation: The increasing adoption of cloud computing and the Internet of Things (IoT) are enabling manufacturers to collect & analyze vast amounts of data in real time, providing insights that can be utilized to optimize production methods and improve product quality. These factors are driving the growth of the smart manufacturing market, creating vast opportunities for companies that provide smart manufacturing solutions. Moreover, the rising number of government initiatives for technological advancement and increasing spending by the leading players for smart manufacturing development is also helping to boost the market growth.
The regions analyzed for the market include North America, Europe, South America, Asia Pacific, the Middle East, and Africa. North America emerged as the largest global smart manufacturing market, with a 45.04% market revenue share in 2023. The presence of prominent key players and the advent of Industry 4.0 is expected to propel market growth in this region. Moreover, the presence of international firms sponsoring industrial technology research & development, industrial Internet of Things (IoT), and cloud technology are expected to propel market growth. The Asia-Pacific region will account for the largest market share with revenue growth. This growth is attributed to rising government initiatives to adopt industrial robots. Moreover, increasing investments by companies in the intelligent manufacturing industry are also helping to boost market growth. Additionally, the increasing demand for IoT for advanced automation processes in the manufacturing industry is anticipated to propel market growth over the forecast period. Apart from this, the rapid industrialization in emerging economies, such as China, India, Africa, Brazil, Indonesia, and Mexico, has resulted in substantial investments in infrastructure development, which in turn is attracting global firms to these economies to set up manufacturing plants.
North America Region Smart Manufacturing Market Share in 2023 - 45.04%
www.thebrainyinsights.com
Check the geographical analysis of this market by requesting a free sample
The component segment is divided into robotics, machine vision systems, communication segments, control devices, and sensors. The machine vision system segment dominated the market, with a share of around 26.18% in 2023. This growth is attributed to the massive demand for automation in industrial & commercial applications.
The technology segment is divided into supervisory controller and data acquisition (SCADA), programmable logic controller (PLC), distributed control system (DCS), enterprise resource and planning (ERP), human-machine interface (HMI), manufacturing execution system (MES), and product lifecycle management (PLM). The distributed control system (DCS) segment dominated the market, with a share of around 21.13% in 2023. This growth is attributed to features such as visualization, flexibility, scalability, ease of use in processes like controlling, monitoring, and reporting, and help in improving system availability and reliability.
The end-user industry segment is divided into semiconductors, automotive, chemical and petrochemical, oil and gas, pharmaceutical, food and beverage, aerospace and defense, and metals and mining. The automotive segment dominated the market, with a market share of around 23.12% in 2023. This growth is attributed to numerous benefits such as sustainability, premium quality, raised asset competence, and reduced operational costs.
| Attribute | Description |
|---|---|
| Market Size | Revenue (USD Billion) |
| Market size value in 2023 | USD 292.83 Billion |
| Market size value in 2033 | USD 1,203.38 Billion |
| CAGR (2024 to 2033) | 15.18% |
| Historical data | 2020-2022 |
| Base Year | 2023 |
| Forecast | 2024-2033 |
| Region | The regions analyzed for the market are Asia Pacific, Europe, South America, North America, and Middle East & Africa. Furthermore, the regions are further analyzed at the country level. |
| Segments | Component, Technology, End-User Industry |
As per The Brainy Insights, the size of the smart manufacturing market was valued at USD 292.83 Billion in 2023 to USD 1,203.38 Billion by 2033.
The global smart manufacturing market is growing at a CAGR of 15.18% during the forecast period 2024-2033.
North American region emerged as the largest market for the smart manufacturing.
1. Introduction
1.1. Objectives of the Study
1.2. Market Definition
1.3. Research Scope
1.4. Currency
1.5. Key Target Audience
2. Research Methodology and Assumptions
3. Executive Summary
4. Premium Insights
4.1. Porter’s Five Forces Analysis
4.2. Value Chain Analysis
4.3. Top Investment Pockets
4.3.1. Market Attractiveness Analysis By Component
4.3.2. Market Attractiveness Analysis By Technology
4.3.3. Market Attractiveness Analysis By End-User Industry
4.3.4. Market Attractiveness Analysis By Region
4.4. Industry Trends
5. Market Dynamics
5.1. Market Evaluation
5.2. Drivers
5.2.1. The increasing miniaturization of the sensor
5.2.2. The rising emphasis on industrial automation in manufacturing processes
5.3. Restraints
5.3.1. The rising lack of standardization among equipment manufacturers and in connectivity protocols
5.3.2. The rising low adoption of technologies due to technical issues
5.4. Opportunities
5.4.1. The proliferation of smart manufacturing in developing countries
5.4.2. The advent of 5G connectivity in smart manufacturing
6. Global Smart Manufacturing Market Analysis and Forecast, By Component
6.1. Segment Overview
6.2. Robotics
6.3. Machine Vision System
6.4. Communication Segment
6.5. Control Devices
6.6. Sensor
7. Global Smart Manufacturing Market Analysis and Forecast, By Technology
7.1. Segment Overview
7.2. Supervisory Controller and Data Acquisition (SCADA)
7.3. Programmable Logic Controller (PLC)
7.4. Distributed Control System (DCS)
7.5. Enterprise Resource and Planning (ERP)
7.6. Human Machine Interface (HMI)
7.7. Manufacturing Execution System (MES)
7.8. Product Lifecycle Management (PLM)
8. Global Smart Manufacturing Market Analysis and Forecast, By End-User Industry
8.1. Segment Overview
8.2. Semiconductors
8.3. Automotive
8.4. Chemical and Petrochemical
8.5. Oil and Gas
8.6. Pharmaceutical
8.7. Food and Beverage
8.8. Aerospace and Defense
8.9. Metals and Mining
9. Global Smart Manufacturing Market Analysis and Forecast, By Regional Analysis
9.1. Segment Overview
9.2. North America
9.2.1. U.S.
9.2.2. Canada
9.2.3. Mexico
9.3. Europe
9.3.1. Germany
9.3.2. France
9.3.3. U.K.
9.3.4. Italy
9.3.5. Spain
9.4. Asia-Pacific
9.4.1. Japan
9.4.2. China
9.4.3. India
9.5. South America
9.5.1. Brazil
9.6. Middle East and Africa
9.6.1. UAE
9.6.2. South Africa
10. Global Smart Manufacturing Market-Competitive Landscape
10.1. Overview
10.2. Market Share of Key Players in Global Smart Manufacturing Market
10.2.1. Global Company Market Share
10.2.2. North America Company Market Share
10.2.3. Europe Company Market Share
10.2.4. APAC Company Market Share
10.3. Competitive Situations and Trends
10.3.1. Product Launches and Developments
10.3.2. Partnerships, Collaborations, and Agreements
10.3.3. Mergers & Acquisitions
10.3.4. Expansions
11. Company Profiles
11.1. Robert Bosch Manufacturing Solutions GmbH
11.1.1. Business Overview
11.1.2. Company Snapshot
11.1.3. Company Market Share Analysis
11.1.4. Company Product Portfolio
11.1.5. Recent Developments
11.1.6. SWOT Analysis
11.2. Amazon Web Services, Inc.
11.2.1. Business Overview
11.2.2. Company Snapshot
11.2.3. Company Market Share Analysis
11.2.4. Company Product Portfolio
11.2.5. Recent Developments
11.2.6. SWOT Analysis
11.3. FANUC CORPORATION
11.3.1. Business Overview
11.3.2. Company Snapshot
11.3.3. Company Market Share Analysis
11.3.4. Company Product Portfolio
11.3.5. Recent Developments
11.3.6. SWOT Analysis
11.4. 3D Systems Corporation
11.4.1. Business Overview
11.4.2. Company Snapshot
11.4.3. Company Market Share Analysis
11.4.4. Company Product Portfolio
11.4.5. Recent Developments
11.4.6. SWOT Analysis
11.5. Cisco Systems, Inc.
11.5.1. Business Overview
11.5.2. Company Snapshot
11.5.3. Company Market Share Analysis
11.5.4. Company Product Portfolio
11.5.5. Recent Developments
11.5.6. SWOT Analysis
11.6. Cognex Corporation, PTC Inc.
11.6.1. Business Overview
11.6.2. Company Snapshot
11.6.3. Company Market Share Analysis
11.6.4. Company Product Portfolio
11.6.5. Recent Developments
11.6.6. SWOT Analysis
11.7. Plex Systems, Inc.
11.7.1. Business Overview
11.7.2. Company Snapshot
11.7.3. Company Market Share Analysis
11.7.4. Company Product Portfolio
11.7.5. Recent Developments
11.7.6. SWOT Analysis
11.8. SAP SE
11.8.1. Business Overview
11.8.2. Company Snapshot
11.8.3. Company Market Share Analysis
11.8.4. Company Product Portfolio
11.8.5. Recent Developments
11.8.6. SWOT Analysis
11.9. ABB Ltd
11.9.1. Business Overview
11.9.2. Company Snapshot
11.9.3. Company Market Share Analysis
11.9.4. Company Product Portfolio
11.9.5. Recent Developments
11.9.6. SWOT Analysis
11.10. Mitsubishi Electric Automation, Inc.
11.10.1. Business Overview
11.10.2. Company Snapshot
11.10.3. Company Market Share Analysis
11.10.4. Company Product Portfolio
11.10.5. Recent Developments
11.10.6. SWOT Analysis
11.11. Siemens AG
11.11.1. Business Overview
11.11.2. Company Snapshot
11.11.3. Company Market Share Analysis
11.11.4. Company Product Portfolio
11.11.5. Recent Developments
11.11.6. SWOT Analysis
11.12. Emerson Electric Co.
11.12.1. Business Overview
11.12.2. Company Snapshot
11.12.3. Company Market Share Analysis
11.12.4. Company Product Portfolio
11.12.5. Recent Developments
11.12.6. SWOT Analysis
11.13. Hitachi, Ltd.
11.13.1. Business Overview
11.13.2. Company Snapshot
11.13.3. Company Market Share Analysis
11.13.4. Company Product Portfolio
11.13.5. Recent Developments
11.13.6. SWOT Analysis
11.14. Intel Corporation
11.14.1. Business Overview
11.14.2. Company Snapshot
11.14.3. Company Market Share Analysis
11.14.4. Company Product Portfolio
11.14.5. Recent Developments
11.14.6. SWOT Analysis
11.15. Schneider Electric SE
11.15.1. Business Overview
11.15.2. Company Snapshot
11.15.3. Company Market Share Analysis
11.15.4. Company Product Portfolio
11.15.5. Recent Developments
11.15.6. SWOT Analysis
List of Table
1. Global Smart Manufacturing Market, By Component, 2020-2033 (USD Billion)
2. Global Robotics, Smart Manufacturing Market, By Region, 2020-2033 (USD Billion)
3. Global Machine Vision System, Smart Manufacturing Market, By Region, 2020-2033 (USD Billion)
4. Global Communication Segment, Smart Manufacturing Market, By Region, 2020-2033 (USD Billion)
5. Global Control Devices, Smart Manufacturing Market, By Region, 2020-2033 (USD Billion)
6. Global Sensor, Smart Manufacturing Market, By Region, 2020-2033 (USD Billion)
7. Global Smart Manufacturing Market, By Technology, 2020-2033 (USD Billion)
8. Global Supervisory Controller and Data Acquisition (SCADA), Smart Manufacturing Market, By Region, 2020-2033 (USD Billion)
9. Global Programmable Logic Controller (PLC), Smart Manufacturing Market, By Region, 2020-2033 (USD Billion)
10. Global Distributed Control System (DCS), Smart Manufacturing Market, By Region, 2020-2033 (USD Billion)
11. Global Enterprise Resource and Planning (ERP), Smart Manufacturing Market, By Region, 2020-2033 (USD Billion)
12. Global Human Machine Interface (HMI), Smart Manufacturing Market, By Region, 2020-2033 (USD Billion)
13. Global Manufacturing Execution System (MES), Smart Manufacturing Market, By Region, 2020-2033 (USD Billion)
14. Global Product Lifecycle Management (PLM), Smart Manufacturing Market, By Region, 2020-2033 (USD Billion)
15. Global Smart Manufacturing Market, By End-User Industry, 2020-2033 (USD Billion)
16. Global Semiconductors, Smart Manufacturing Market, By Region, 2020-2033 (USD Billion)
17. Global Automotive, Smart Manufacturing Market, By Region, 2020-2033 (USD Billion)
18. Global Chemical and Petrochemical, Smart Manufacturing Market, By Region, 2020-2033 (USD Billion)
19. Global Oil and Gas, Smart Manufacturing Market, By Region, 2020-2033 (USD Billion)
20. Global Pharmaceutical, Smart Manufacturing Market, By Region, 2020-2033 (USD Billion)
21. Global Food and Beverage, Smart Manufacturing Market, By Region, 2020-2033 (USD Billion)
22. Global Aerospace and Defense, Smart Manufacturing Market, By Region, 2020-2033 (USD Billion)
23. Global Metals and Mining, Smart Manufacturing Market, By Region, 2020-2033 (USD Billion)
24. North America Smart Manufacturing Market, By Component, 2020-2033 (USD Billion)
25. North America Smart Manufacturing Market, By Technology, 2020-2033 (USD Billion)
26. North America Smart Manufacturing Market, By End-User Industry, 2020-2033 (USD Billion)
27. U.S. Smart Manufacturing Market, By Component, 2020-2033 (USD Billion)
28. U.S. Smart Manufacturing Market, By Technology, 2020-2033 (USD Billion)
29. U.S. Smart Manufacturing Market, By End-User Industry, 2020-2033 (USD Billion)
30. Canada Smart Manufacturing Market, By Component, 2020-2033 (USD Billion)
31. Canada Smart Manufacturing Market, By Technology, 2020-2033 (USD Billion)
32. Canada Smart Manufacturing Market, By End-User Industry, 2020-2033 (USD Billion)
33. Mexico Smart Manufacturing Market, By Component, 2020-2033 (USD Billion)
34. Mexico Smart Manufacturing Market, By Technology, 2020-2033 (USD Billion)
35. Mexico Smart Manufacturing Market, By End-User Industry, 2020-2033 (USD Billion)
36. Europe Smart Manufacturing Market, By Component, 2020-2033 (USD Billion)
37. Europe Smart Manufacturing Market, By Technology, 2020-2033 (USD Billion)
38. Europe Smart Manufacturing Market, By End-User Industry, 2020-2033 (USD Billion)
39. Germany Smart Manufacturing Market, By Component, 2020-2033 (USD Billion)
40. Germany Smart Manufacturing Market, By Technology, 2020-2033 (USD Billion)
41. Germany Smart Manufacturing Market, By End-User Industry, 2020-2033 (USD Billion)
42. France Smart Manufacturing Market, By Component, 2020-2033 (USD Billion)
43. France Smart Manufacturing Market, By Technology, 2020-2033 (USD Billion)
44. France Smart Manufacturing Market, By End-User Industry, 2020-2033 (USD Billion)
45. U.K. Smart Manufacturing Market, By Component, 2020-2033 (USD Billion)
46. U.K. Smart Manufacturing Market, By Technology, 2020-2033 (USD Billion)
47. U.K. Smart Manufacturing Market, By End-User Industry, 2020-2033 (USD Billion)
48. Italy Smart Manufacturing Market, By Component, 2020-2033 (USD Billion)
49. Italy Smart Manufacturing Market, By Technology, 2020-2033 (USD Billion)
50. Italy Smart Manufacturing Market, By End-User Industry, 2020-2033 (USD Billion)
51. Spain Smart Manufacturing Market, By Component, 2020-2033 (USD Billion)
52. Spain Smart Manufacturing Market, By Technology, 2020-2033 (USD Billion)
53. Spain Smart Manufacturing Market, By End-User Industry, 2020-2033 (USD Billion)
54. Asia Pacific Smart Manufacturing Market, By Component, 2020-2033 (USD Billion)
55. Asia Pacific Smart Manufacturing Market, By Technology, 2020-2033 (USD Billion)
56. Asia Pacific Smart Manufacturing Market, By End-User Industry, 2020-2033 (USD Billion)
57. Japan Smart Manufacturing Market, By Component, 2020-2033 (USD Billion)
58. Japan Smart Manufacturing Market, By Technology, 2020-2033 (USD Billion)
59. Japan Smart Manufacturing Market, By End-User Industry, 2020-2033 (USD Billion)
60. China Smart Manufacturing Market, By Component, 2020-2033 (USD Billion)
61. China Smart Manufacturing Market, By Technology, 2020-2033 (USD Billion)
62. China Smart Manufacturing Market, By End-User Industry, 2020-2033 (USD Billion)
63. India Smart Manufacturing Market, By Component, 2020-2033 (USD Billion)
64. India Smart Manufacturing Market, By Technology, 2020-2033 (USD Billion)
65. India Smart Manufacturing Market, By End-User Industry, 2020-2033 (USD Billion)
66. South America Smart Manufacturing Market, By Component, 2020-2033 (USD Billion)
67. South America Smart Manufacturing Market, By Technology, 2020-2033 (USD Billion)
68. South America Smart Manufacturing Market, By End-User Industry, 2020-2033 (USD Billion)
69. Brazil Smart Manufacturing Market, By Component, 2020-2033 (USD Billion)
70. Brazil Smart Manufacturing Market, By Technology, 2020-2033 (USD Billion)
71. Brazil Smart Manufacturing Market, By End-User Industry, 2020-2033 (USD Billion)
72. Middle East and Africa Smart Manufacturing Market, By Component, 2020-2033 (USD Billion)
73. Middle East and Africa Smart Manufacturing Market, By Technology, 2020-2033 (USD Billion)
74. Middle East and Africa Smart Manufacturing Market, By End-User Industry, 2020-2033 (USD Billion)
75. UAE Smart Manufacturing Market, By Component, 2020-2033 (USD Billion)
76. UAE Smart Manufacturing Market, By Technology, 2020-2033 (USD Billion)
77. UAE Smart Manufacturing Market, By End-User Industry, 2020-2033 (USD Billion)
78. South Africa Smart Manufacturing Market, By Component, 2020-2033 (USD Billion)
79. South Africa Smart Manufacturing Market, By Technology, 2020-2033 (USD Billion)
80. South Africa Smart Manufacturing Market, By End-User Industry, 2020-2033 (USD Billion)
List of Figures
1. Global Smart Manufacturing Market Segmentation
2. Global Smart Manufacturing Market: Research Methodology
3. Market Size Estimation Methodology: Bottom-Up Approach
4. Market Size Estimation Methodology: Top- Approach
5. Data Triangulation
6. Porter’s Five Forces Analysis
7. Value Chain Analysis
8. Global Smart Manufacturing Market Attractiveness Analysis By Component
9. Global Smart Manufacturing Market Attractiveness Analysis By Technology
10. Global Smart Manufacturing Market Attractiveness Analysis By End-User Industry
11. Global Smart Manufacturing Market Attractiveness Analysis By Region
12. Global Smart Manufacturing Market: Dynamics
13. Global Smart Manufacturing Market Share By Component (2023 & 2033)
14. Global Smart Manufacturing Market Share By Technology (2023 & 2033)
15. Global Smart Manufacturing Market Share By End-User Industry (2023 & 2033)
16. Global Smart Manufacturing Market Share By Regions (2023 & 2033)
17. Global Smart Manufacturing Market Share By Company (2023)
This study forecasts revenue at global, regional, and country levels from 2020 to 2033. The Brainy Insights has segmented the global smart manufacturing based on below mentioned segments:
Global Smart Manufacturing Market by Component:
Global Smart Manufacturing Market by Technology:
Global Smart Manufacturing Market by End-User Industry:
Global Smart Manufacturing by Region:
Research has its special purpose to undertake marketing efficiently. In this competitive scenario, businesses need information across all industry verticals; the information about customer wants, market demand, competition, industry trends, distribution channels etc. This information needs to be updated regularly because businesses operate in a dynamic environment. Our organization, The Brainy Insights incorporates scientific and systematic research procedures in order to get proper market insights and industry analysis for overall business success. The analysis consists of studying the market from a miniscule level wherein we implement statistical tools which helps us in examining the data with accuracy and precision.
Our research reports feature both; quantitative and qualitative aspects for any market. Qualitative information for any market research process are fundamental because they reveal the customer needs and wants, usage and consumption for any product/service related to a specific industry. This in turn aids the marketers/investors in knowing certain perceptions of the customers. Qualitative research can enlighten about the different product concepts and designs along with unique service offering that in turn, helps define marketing problems and generate opportunities. On the other hand, quantitative research engages with the data collection process through interviews, e-mail interactions, surveys and pilot studies. Quantitative aspects for the market research are useful to validate the hypotheses generated during qualitative research method, explore empirical patterns in the data with the help of statistical tools, and finally make the market estimations.
The Brainy Insights offers comprehensive research and analysis, based on a wide assortment of factual insights gained through interviews with CXOs and global experts and secondary data from reliable sources. Our analysts and industry specialist assume vital roles in building up statistical tools and analysis models, which are used to analyse the data and arrive at accurate insights with exceedingly informative research discoveries. The data provided by our organization have proven precious to a diverse range of companies, facilitating them to address issues such as determining which products/services are the most appealing, whether or not customers use the product in the manner anticipated, the purchasing intentions of the market and many others.
Our research methodology encompasses an idyllic combination of primary and secondary initiatives. Key phases involved in this process are listed below:

The phase involves the gathering and collecting of market data and its related information with the help of different sources & research procedures.

The data procurement stage involves in data gathering and collecting through various data sources.
This stage involves in extensive research. These data sources includes:
Purchased Database: Purchased databases play a crucial role in estimating the market sizes irrespective of the domain. Our purchased database includes:
Primary Research: The Brainy Insights interacts with leading companies and experts of the concerned domain to develop the analyst team’s market understanding and expertise. It improves and substantiates every single data presented in the market reports. Primary research mainly involves in telephonic interviews, E-mail interactions and face-to-face interviews with the raw material providers, manufacturers/producers, distributors, & independent consultants. The interviews that we conduct provides valuable data on market size and industry growth trends prevailing in the market. Our organization also conducts surveys with the various industry experts in order to gain overall insights of the industry/market. For instance, in healthcare industry we conduct surveys with the pharmacists, doctors, surgeons and nurses in order to gain insights and key information of a medical product/device/equipment which the customers are going to usage. Surveys are conducted in the form of questionnaire designed by our own analyst team. Surveys plays an important role in primary research because surveys helps us to identify the key target audiences of the market. Additionally, surveys helps to identify the key target audience engaged with the market. Our survey team conducts the survey by targeting the key audience, thus gaining insights from them. Based on the perspectives of the customers, this information is utilized to formulate market strategies. Moreover, market surveys helps us to understand the current competitive situation of the industry. To be precise, our survey process typically involve with the 360 analysis of the market. This analytical process begins by identifying the prospective customers for a product or service related to the market/industry to obtain data on how a product/service could fit into customers’ lives.

Secondary Research: The secondary data sources includes information published by the on-profit organizations such as World bank, WHO, company fillings, investor presentations, annual reports, national government documents, statistical databases, blogs, articles, white papers and others. From the annual report, we analyse a company’s revenue to understand the key segment and market share of that organization in a particular region. We analyse the company websites and adopt the product mapping technique which is important for deriving the segment revenue. In the product mapping method, we select and categorize the products offered by the companies catering to domain specific market, deduce the product revenue for each of the companies so as to get overall estimation of the market size. We also source data and analyses trends based on information received from supply side and demand side intermediaries in the value chain. The supply side denotes the data gathered from supplier, distributor, wholesaler and the demand side illustrates the data gathered from the end customers for respective market domain.

The supply side for a domain specific market is analysed by:
The demand side for the market is estimated through:
In-house Library: Apart from these third-party sources, we have our in-house library of qualitative and quantitative information. Our in-house database includes market data for various industry and domains. These data are updated on regular basis as per the changing market scenario. Our library includes, historic databases, internal audit reports and archives.
Sometimes there are instances where there is no metadata or raw data available for any domain specific market. For those cases, we use our expertise to forecast and estimate the market size in order to generate comprehensive data sets. Our analyst team adopt a robust research technique in order to produce the estimates:
Data Synthesis: This stage involves the analysis & mapping of all the information obtained from the previous step. It also involves in scrutinizing the data for any discrepancy observed while data gathering related to the market. The data is collected with consideration to the heterogeneity of sources. Robust scientific techniques are in place for synthesizing disparate data sets and provide the essential contextual information that can orient market strategies. The Brainy Insights has extensive experience in data synthesis where the data passes through various stages:


Market Deduction & Formulation: The final stage comprises of assigning data points at appropriate market spaces so as to deduce feasible conclusions. Analyst perspective & subject matter expert based holistic form of market sizing coupled with industry analysis also plays a crucial role in this stage.
This stage involves in finalization of the market size and numbers that we have collected from data integration step. With data interpolation, it is made sure that there is no gap in the market data. Successful trend analysis is done by our analysts using extrapolation techniques, which provide the best possible forecasts for the market.
Data Validation & Market Feedback: Validation is the most important step in the process. Validation & re-validation via an intricately designed process helps us finalize data-points to be used for final calculations.

The Brainy Insights interacts with leading companies and experts of the concerned domain to develop the analyst team’s market understanding and expertise. It improves and substantiates every single data presented in the market reports. The data validation interview and discussion panels are typically composed of the most experienced industry members. The participants include, however, are not limited to:
Moreover, we always validate our data and findings through primary respondents from all the major regions we are working on.


Free Customization
Fortune 500 Clients
Free Yearly Update On Purchase Of Multi/Corporate License
Companies Served Till Date