- +1-315-215-1633
- sales@thebrainyinsights.com

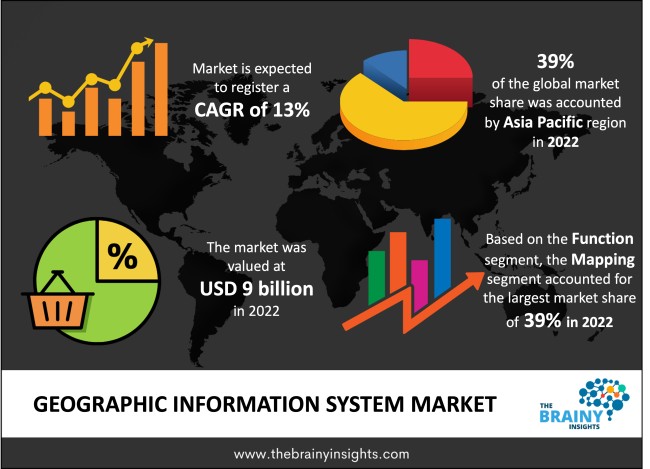
The global geographic information system market was valued at USD 9 billion in 2022 and grew at a CAGR of 13% from 2023 to 2032. The market is expected to reach USD 30.55 billion by 2032. Rapid urbanization will drive the growth of the global geographic information system market.
Geography is the study of the Earth. Information about geography would contain the various structures on Earth like mountains, roads, beaches, water bodies, people and buildings, among many other things. A geographic information system enables the collection, storage, modification and use of geographical information for efficient administration, effective policy decision making and spreading awareness and knowledge about the spatial distribution of the Earth. A geographic information system requires seamless integration of hardware, software, people, data and methods to deliver objectives of efficient decision-making. A geographic information system has two categories of data, one being spatial data which includes the location, boundaries and route, among other things. The second isis non-spatial data, attributes like the geographical area, distance, or population within a territory. Better spatial information enables better decision-making, which ensures optimal use of resources, reduces costs, and prevents unnecessary waste of time, money and effort. It also paves the way for better project development which is sustainable and environmentally friendly. It enables recording and analysing the changes in land use patterns, which creates transparent, accountable and efficient resource management. Information management. GIS is a crucial tool for managing disaster recovery and emergency response. GIS has applications in agriculture, urban planning, disaster management, mobility planning, tourism and the energy sector.
Get an overview of this study by requesting a free sample
Rapid urbanization – the rapid urbanization driven by the rising population, increasing disposable income and growing fiscal infrastructural expenditure has increased the need for efficient urban planning. The growth of unplanned urban clusters has led to several problems like congestion, pollution, overcrowding, and a high cost of living, which is why planning new cities and revamping old ones for a better quality of life is important. The introduction of smart cities with efficient urban mobility and transportation, digital infrastructure, and sustainable land distribution with easy access to urban utilities has become a priority for governments globally. Geographic information systems enable better decision-making for planning urban cities by offering spatial information. They cost-effectively enable informed decisions. They prevent the wastage of resources by enabling optimum utilization of available land. Using GIS to design urban mobility solutions based on population density, office spaces, distances, and topography enables authorities to deliver a seamless transport network for the citizens while ensuring minimal damage to the surrounding environment. GIS enables proactive planning by predicting growth status and changes that may take place in the future. Therefore, rapid urbanization will grow the global geographic information system market.
The high costs of geographic information systems – the extensive geographical data is collected through satellites or drones, and it takes hours of surveying, mapping, and locating to create a GIS database. The non-spatial information requires research, data collection, processing and verification to integrate authentic information for consumer use. The hardware, software and methods used for geographic information systems are sophisticated, thereby, costly. Small businesses or other stakeholders with limited finance cannot afford GIS systems. Therefore, the high cost of geographic information systems will restrict the market's growth.
The increasing applications of GIS – the advancement in technology and the growing automation and digitization of global economies have increased the adoption of GIS. It is now used in agriculture, business, disaster management, forest and environment, tourism, healthcare, energy, education, etc. GIS enables land and soil analysis in agriculture, significantly impacting yields. It enables identifying high-risk zones around fault lines, which helps predict the impact of seismic activity and prevent loss of life, property and capital. It helps business identify their target markets. Therefore, the increasing applications of GIS will offer lucrative opportunities for the market players in the forecast period.
The regions analysed for the market include North America, Europe, South America, Asia Pacific, the Middle East, and Africa. Asia Pacific emerged as the most significant global geographic information system market, with a 39% market revenue share in 2022.
The rapidly growing pace of the Asian economies has led to rapid industrialization and urbanization. The rapid growth of agriculture, construction, tourism, manufacturing, and urban agglomerates has contributed to the growing need for GIS to better plan the economies for efficient use of resources for maximum gain. The growing population with limited land resources facilitates innovative developmental ideas that need GIS. The use of GIS for agriculture land mapping to improve yield and its use by environmental institutions to study changing weather events to predict natural disasters are a few examples driving the regional market’s growth.
Asia Pacific Region Geographic Information System Market Share in 2022 - 39%
www.thebrainyinsights.com
Check the geographical analysis of this market by requesting a free sample
The component type segment is divided into hardware, software, and services. The software segment dominated the market, with a market share of around 48% in 2022. A GIS software stores spatial and non-spatial information that can be used according to the users' needs and requirements. The software enables the users to create maps or visualize topographical and any other information for study, analysing, research and presentation. Multiple industry players in the market offer GIS software for use by stakeholders from various sectors like government, academics, agriculture, tourism and other minor private players. The introduction of cloud-based GIS mapping has enabled greater application of GIS software efficiently and cost-effectively.
The function segment is divided into mapping, surveying, location-based services, telematics and navigation and others. The mapping segment dominated, with a market share of around 39% in 2022. GIS enables information exchange by integrating non-spatial data with maps. The combination of places or objects, or locations with their attributes helps users in their everyday lives. It helps them locate stores, parks, hospitals, streets, parking spaces etc. They also offer information on other attributes like GIS mapping is used in almost all sectors of the economy. For instance, it allows us to analyse the change in land use patterns. It also enables companies to analyse their geographical customer reach. The significantly growing applications of mapping will drive the segment’s growth.
The end-user segment is divided into agriculture, architecture, building and construction, utilities, retail, energy, transportation, mining, urban planning, healthcare, and others. The urban planning segment dominated, with a market share of around 29% in 2022. The rapid urbanization of global economies will drive the segment's growth as GIS enables optimal resource management and sustainable and informed decision-making. It offers a comprehensive, exhaustive and varied database to plan, modify and create best land use practices for efficient optimization of resources cost-effectively.
| Attribute | Description |
|---|---|
| Market Size | Revenue (USD Billion) |
| Market size value in 2022 | USD 9 Billion |
| Market size value in 2032 | USD 30.55 Billion |
| CAGR (2023 to 2032) | 13% |
| Historical data | 2019-2021 |
| Base Year | 2022 |
| Forecast | 2023-2032 |
| Region | The regions analysed for the market are Asia Pacific, Europe, South America, North America, and Middle East & Africa. Furthermore, the regions are further analyzed at the country level. |
| Segments | Component Type, Function and End-User |
As per The Brainy Insights, the size of the global geographic information system market was valued at USD 9 billion in 2022 to USD 30.55 billion by 2032.
Global geographic information system market is growing at a CAGR of 13% during the forecast period 2023-2032.
The market's growth will be influenced by the rapid urbanization.
The high-costs of geographic information system could hamper the market growth.
1. Introduction
1.1. Objectives of the Study
1.2. Market Definition
1.3. Research Scope
1.4. Currency
1.5. Key Target Audience
2. Research Methodology and Assumptions
3. Executive Summary
4. Premium Insights
4.1. Porter’s Five Forces Analysis
4.2. Value Chain Analysis
4.3. Top Investment Pockets
4.3.1. Market Attractiveness Analysis by Component
4.3.2. Market Attractiveness Analysis by Function
4.3.3. Market Attractiveness Analysis by End User
4.3.4. Market Attractiveness Analysis by Region
4.4. Industry Trends
5. Market Dynamics
5.1. Market Evaluation
5.2. Drivers
5.2.1. Rapid urbanization
5.3. Restraints
5.3.1. The high costs of geographic information system
5.4. Opportunities
5.4.1. The increasing applications of GIS
5.5. Challenges
5.5.1. complex integration mechanism
6. Global Geographic Information System Market Analysis and Forecast, By Component
6.1. Segment Overview
6.2. Hardware
6.3. Software
6.4. Services
7. Global Geographic Information System Market Analysis and Forecast, By Function
7.1. Segment Overview
7.2. Mapping
7.3. Surveying
7.4. Location-Based Services
7.5. Telematics and Navigation
7.6. Others
8. Global Geographic Information System Market Analysis and Forecast, By End User
8.1. Segment Overview
8.2. Agriculture
8.3. Architecture
8.4. Building and Construction
8.5. Utilities
8.6. Retail
8.7. Energy
8.8. Transportation
8.9. Mining
8.10. Urban Planning
8.11. Healthcare
8.12. Others
9. Global Geographic Information System Market Analysis and Forecast, By Regional Analysis
9.1. Segment Overview
9.2. North America
9.2.1. U.S.
9.2.2. Canada
9.2.3. Mexico
9.3. Europe
9.3.1. Germany
9.3.2. France
9.3.3. U.K.
9.3.4. Italy
9.3.5. Spain
9.4. Asia-Pacific
9.4.1. Japan
9.4.2. China
9.4.3. India
9.5. South America
9.5.1. Brazil
9.6. Middle East and Africa
9.6.1. UAE
9.6.2. South Africa
10. Global Geographic Information System Market-Competitive Landscape
10.1. Overview
10.2. Market Share of Key Players in the Geographic Information System Market
10.2.1. Global Company Market Share
10.2.2. North America Company Market Share
10.2.3. Europe Company Market Share
10.2.4. APAC Company Market Share
10.3. Competitive Situations and Trends
10.3.1. Product Launches and Developments
10.3.2. Partnerships, Collaborations, and Agreements
10.3.3. Mergers & Acquisitions
10.3.4. Expansions
11. Company Profiles
11.1. Autodesk, Inc.
11.1.1. Business Overview
11.1.2. Company Snapshot
11.1.3. Company Market Share Analysis
11.1.4. Company Product Portfolio
11.1.5. Recent Developments
11.1.6. SWOT Analysis
11.2. Bentley Systems
11.2.1. Business Overview
11.2.2. Company Snapshot
11.2.3. Company Market Share Analysis
11.2.4. Company Product Portfolio
11.2.5. Recent Developments
11.2.6. SWOT Analysis
11.3. Caliper Corporation
11.3.1. Business Overview
11.3.2. Company Snapshot
11.3.3. Company Market Share Analysis
11.3.4. Company Product Portfolio
11.3.5. Recent Developments
11.3.6. SWOT Analysis
11.4. Computer Aided Development Corporation Ltd.
11.4.1. Business Overview
11.4.2. Company Snapshot
11.4.3. Company Market Share Analysis
11.4.4. Company Product Portfolio
11.4.5. Recent Developments
11.4.6. SWOT Analysis
11.5. Esri
11.5.1. Business Overview
11.5.2. Company Snapshot
11.5.3. Company Market Share Analysis
11.5.4. Company Product Portfolio
11.5.5. Recent Developments
11.5.6. SWOT Analysis
11.6. General Electric Co.
11.6.1. Business Overview
11.6.2. Company Snapshot
11.6.3. Company Market Share Analysis
11.6.4. Company Product Portfolio
11.6.5. Recent Developments
11.6.6. SWOT Analysis
11.7. Hexagon AB
11.7.1. Business Overview
11.7.2. Company Snapshot
11.7.3. Company Market Share Analysis
11.7.4. Company Product Portfolio
11.7.5. Recent Developments
11.7.6. SWOT Analysis
11.8. L3Harris Technologies
11.8.1. Business Overview
11.8.2. Company Snapshot
11.8.3. Company Market Share Analysis
11.8.4. Company Product Portfolio
11.8.5. Recent Developments
11.8.6. SWOT Analysis
11.9. Pitney Bowes Inc.
11.9.1. Business Overview
11.9.2. Company Snapshot
11.9.3. Company Market Share Analysis
11.9.4. Company Product Portfolio
11.9.5. Recent Developments
11.9.6. SWOT Analysis
11.10. Trimble Inc.
11.10.1. Business Overview
11.10.2. Company Snapshot
11.10.3. Company Market Share Analysis
11.10.4. Company Product Portfolio
11.10.5. Recent Developments
11.10.6. SWOT Analysis
List of Table
1. Global Geographic Information System Market, By Component, 2019-2032 (USD Billion)
2. Global Hardware Geographic Information System Market, By Region, 2019-2032 (USD Billion)
3. Global Software Geographic Information System Market, By Region, 2019-2032 (USD Billion)
4. Global Services Geographic Information System Market, By Region, 2019-2032 (USD Billion)
5. Global Geographic Information System Market, By Function, 2019-2032 (USD Billion)
6. Global Mapping Geographic Information System Market, By Region, 2019-2032 (USD Billion)
7. Global Surveying Geographic Information System Market, By Region, 2019-2032 (USD Billion)
8. Global Location-Based Services Geographic Information System Market, By Region, 2019-2032 (USD Billion)
9. Global Telematics and Navigation Geographic Information System Market, By Region, 2019-2032 (USD Billion)
10. Global Others Geographic Information System Market, By Region, 2019-2032 (USD Billion)
11. Global Geographic Information System Market, By End User, 2019-2032 (USD Billion)
12. Global Agriculture Geographic Information System Market, By Region, 2019-2032 (USD Billion)
13. Global Architecture Geographic Information System Market, By Region, 2019-2032 (USD Billion)
14. Global Building and Construction Geographic Information System Market, By Region, 2019-2032 (USD Billion)
15. Global Utilities Geographic Information System Market, By Region, 2019-2032 (USD Billion)
16. Global Retail Geographic Information System Market, By Region, 2019-2032 (USD Billion)
17. Global Energy Geographic Information System Market, By Region, 2019-2032 (USD Billion)
18. Global Transportation Geographic Information System Market, By Region, 2019-2032 (USD Billion)
19. Global Mining Geographic Information System Market, By Region, 2019-2032 (USD Billion)
20. Global Urban Planning Geographic Information System Market, By Region, 2019-2032 (USD Billion)
21. Global Healthcare Geographic Information System Market, By Region, 2019-2032 (USD Billion)
22. Global Others Geographic Information System Market, By Region, 2019-2032 (USD Billion)
23. Global Geographic Information System Market, By Region, 2019-2032 (USD Billion)
24. North America Geographic Information System Market, By Component, 2019-2032 (USD Billion)
25. North America Geographic Information System Market, By Function, 2019-2032 (USD Billion)
26. North America Geographic Information System Market, By End User, 2019-2032 (USD Billion)
27. U.S. Geographic Information System Market, By Component, 2019-2032 (USD Billion)
28. U.S. Geographic Information System Market, By Function, 2019-2032 (USD Billion)
29. U.S. Geographic Information System Market, By End User, 2019-2032 (USD Billion)
30. Canada Geographic Information System Market, By Component, 2019-2032 (USD Billion)
31. Canada Geographic Information System Market, By Function, 2019-2032 (USD Billion)
32. Canada Geographic Information System Market, By End User, 2019-2032 (USD Billion)
33. Mexico Geographic Information System Market, By Component, 2019-2032 (USD Billion)
34. Mexico Geographic Information System Market, By Function, 2019-2032 (USD Billion)
35. Mexico Geographic Information System Market, By End User, 2019-2032 (USD Billion)
36. Europe Geographic Information System Market, By Component, 2019-2032 (USD Billion)
37. Europe Geographic Information System Market, By Function, 2019-2032 (USD Billion)
38. Europe Geographic Information System Market, By End User, 2019-2032 (USD Billion)
39. Germany Geographic Information System Market, By Component, 2019-2032 (USD Billion)
40. Germany Geographic Information System Market, By Function, 2019-2032 (USD Billion)
41. Germany Geographic Information System Market, By End User, 2019-2032 (USD Billion)
42. France Geographic Information System Market, By Component, 2019-2032 (USD Billion)
43. France Geographic Information System Market, By Function, 2019-2032 (USD Billion)
44. France Geographic Information System Market, By End User, 2019-2032 (USD Billion)
45. U.K. Geographic Information System Market, By Component, 2019-2032 (USD Billion)
46. U.K. Geographic Information System Market, By Function, 2019-2032 (USD Billion)
47. U.K. Geographic Information System Market, By End User, 2019-2032 (USD Billion)
48. Italy Geographic Information System Market, By Component, 2019-2032 (USD Billion)
49. Italy Geographic Information System Market, By Function, 2019-2032 (USD Billion)
50. Italy Geographic Information System Market, By End User, 2019-2032 (USD Billion)
51. Spain Geographic Information System Market, By Component, 2019-2032 (USD Billion)
52. Spain Geographic Information System Market, By Function, 2019-2032 (USD Billion)
53. Spain Geographic Information System Market, By End User, 2019-2032 (USD Billion)
54. Asia Pacific Geographic Information System Market, By Component, 2019-2032 (USD Billion)
55. Asia Pacific Geographic Information System Market, By Function, 2019-2032 (USD Billion)
56. Asia Pacific Geographic Information System Market, By End User, 2019-2032 (USD Billion)
57. Japan Geographic Information System Market, By Component, 2019-2032 (USD Billion)
58. Japan Geographic Information System Market, By Function, 2019-2032 (USD Billion)
59. Japan Geographic Information System Market, By End User, 2019-2032 (USD Billion)
60. China Geographic Information System Market, By Component, 2019-2032 (USD Billion)
61. China Geographic Information System Market, By Function, 2019-2032 (USD Billion)
62. China Geographic Information System Market, By End User, 2019-2032 (USD Billion)
63. India Geographic Information System Market, By Component, 2019-2032 (USD Billion)
64. India Geographic Information System Market, By Function, 2019-2032 (USD Billion)
65. India Geographic Information System Market, By End User, 2019-2032 (USD Billion)
66. South America Geographic Information System Market, By Component, 2019-2032 (USD Billion)
67. South America Geographic Information System Market, By Function, 2019-2032 (USD Billion)
68. South America Geographic Information System Market, By End User, 2019-2032 (USD Billion)
69. Brazil Geographic Information System Market, By Component, 2019-2032 (USD Billion)
70. Brazil Geographic Information System Market, By Function, 2019-2032 (USD Billion)
71. Brazil Geographic Information System Market, By End User, 2019-2032 (USD Billion)
72. Middle East and Africa Geographic Information System Market, By Component, 2019-2032 (USD Billion)
73. Middle East and Africa Geographic Information System Market, By Function, 2019-2032 (USD Billion)
74. Middle East and Africa Geographic Information System Market, By End User, 2019-2032 (USD Billion)
75. UAE Geographic Information System Market, By Component, 2019-2032 (USD Billion)
76. UAE Geographic Information System Market, By Function, 2019-2032 (USD Billion)
77. UAE Geographic Information System Market, By End User, 2019-2032 (USD Billion)
78. South Africa Geographic Information System Market, By Component, 2019-2032 (USD Billion)
79. South Africa Geographic Information System Market, By Function, 2019-2032 (USD Billion)
80. South Africa Geographic Information System Market, By End User, 2019-2032 (USD Billion)
List of Figures
1. Global Geographic Information System Market Segmentation
2. Geographic Information System Market: Research Methodology
3. Market Size Estimation Methodology: Bottom-Up Approach
4. Market Size Estimation Methodology: Top-Down Approach
5. Data Triangulation
6. Porter’s Five Forces Analysis
7. Value Chain Analysis
8. Global Geographic Information System Market Attractiveness Analysis by Component
9. Global Geographic Information System Market Attractiveness Analysis by Function
10. Global Geographic Information System Market Attractiveness Analysis by End User
11. Global Geographic Information System Market Attractiveness Analysis by Region
12. Global Geographic Information System Market: Dynamics
13. Global Geographic Information System Market Share by Component (2022 & 2032)
14. Global Geographic Information System Market Share by Function (2022 & 2032)
15. Global Geographic Information System Market Share by End User (2022 & 2032)
16. Global Geographic Information System Market Share by Regions (2022 & 2032)
17. Global Geographic Information System Market Share by Company (2022)
This study forecasts revenue at global, regional, and country levels from 2019 to 2032. The Brainy Insights has segmented the global Geographic Information System market based on below mentioned segments:
Global Geographic Information System Market by Component:
Global Geographic Information System Market by Function:
Global Geographic Information System Market by End User:
Global Geographic Information System Market by Region:
Research has its special purpose to undertake marketing efficiently. In this competitive scenario, businesses need information across all industry verticals; the information about customer wants, market demand, competition, industry trends, distribution channels etc. This information needs to be updated regularly because businesses operate in a dynamic environment. Our organization, The Brainy Insights incorporates scientific and systematic research procedures in order to get proper market insights and industry analysis for overall business success. The analysis consists of studying the market from a miniscule level wherein we implement statistical tools which helps us in examining the data with accuracy and precision.
Our research reports feature both; quantitative and qualitative aspects for any market. Qualitative information for any market research process are fundamental because they reveal the customer needs and wants, usage and consumption for any product/service related to a specific industry. This in turn aids the marketers/investors in knowing certain perceptions of the customers. Qualitative research can enlighten about the different product concepts and designs along with unique service offering that in turn, helps define marketing problems and generate opportunities. On the other hand, quantitative research engages with the data collection process through interviews, e-mail interactions, surveys and pilot studies. Quantitative aspects for the market research are useful to validate the hypotheses generated during qualitative research method, explore empirical patterns in the data with the help of statistical tools, and finally make the market estimations.
The Brainy Insights offers comprehensive research and analysis, based on a wide assortment of factual insights gained through interviews with CXOs and global experts and secondary data from reliable sources. Our analysts and industry specialist assume vital roles in building up statistical tools and analysis models, which are used to analyse the data and arrive at accurate insights with exceedingly informative research discoveries. The data provided by our organization have proven precious to a diverse range of companies, facilitating them to address issues such as determining which products/services are the most appealing, whether or not customers use the product in the manner anticipated, the purchasing intentions of the market and many others.
Our research methodology encompasses an idyllic combination of primary and secondary initiatives. Key phases involved in this process are listed below:

The phase involves the gathering and collecting of market data and its related information with the help of different sources & research procedures.

The data procurement stage involves in data gathering and collecting through various data sources.
This stage involves in extensive research. These data sources includes:
Purchased Database: Purchased databases play a crucial role in estimating the market sizes irrespective of the domain. Our purchased database includes:
Primary Research: The Brainy Insights interacts with leading companies and experts of the concerned domain to develop the analyst team’s market understanding and expertise. It improves and substantiates every single data presented in the market reports. Primary research mainly involves in telephonic interviews, E-mail interactions and face-to-face interviews with the raw material providers, manufacturers/producers, distributors, & independent consultants. The interviews that we conduct provides valuable data on market size and industry growth trends prevailing in the market. Our organization also conducts surveys with the various industry experts in order to gain overall insights of the industry/market. For instance, in healthcare industry we conduct surveys with the pharmacists, doctors, surgeons and nurses in order to gain insights and key information of a medical product/device/equipment which the customers are going to usage. Surveys are conducted in the form of questionnaire designed by our own analyst team. Surveys plays an important role in primary research because surveys helps us to identify the key target audiences of the market. Additionally, surveys helps to identify the key target audience engaged with the market. Our survey team conducts the survey by targeting the key audience, thus gaining insights from them. Based on the perspectives of the customers, this information is utilized to formulate market strategies. Moreover, market surveys helps us to understand the current competitive situation of the industry. To be precise, our survey process typically involve with the 360 analysis of the market. This analytical process begins by identifying the prospective customers for a product or service related to the market/industry to obtain data on how a product/service could fit into customers’ lives.

Secondary Research: The secondary data sources includes information published by the on-profit organizations such as World bank, WHO, company fillings, investor presentations, annual reports, national government documents, statistical databases, blogs, articles, white papers and others. From the annual report, we analyse a company’s revenue to understand the key segment and market share of that organization in a particular region. We analyse the company websites and adopt the product mapping technique which is important for deriving the segment revenue. In the product mapping method, we select and categorize the products offered by the companies catering to domain specific market, deduce the product revenue for each of the companies so as to get overall estimation of the market size. We also source data and analyses trends based on information received from supply side and demand side intermediaries in the value chain. The supply side denotes the data gathered from supplier, distributor, wholesaler and the demand side illustrates the data gathered from the end customers for respective market domain.

The supply side for a domain specific market is analysed by:
The demand side for the market is estimated through:
In-house Library: Apart from these third-party sources, we have our in-house library of qualitative and quantitative information. Our in-house database includes market data for various industry and domains. These data are updated on regular basis as per the changing market scenario. Our library includes, historic databases, internal audit reports and archives.
Sometimes there are instances where there is no metadata or raw data available for any domain specific market. For those cases, we use our expertise to forecast and estimate the market size in order to generate comprehensive data sets. Our analyst team adopt a robust research technique in order to produce the estimates:
Data Synthesis: This stage involves the analysis & mapping of all the information obtained from the previous step. It also involves in scrutinizing the data for any discrepancy observed while data gathering related to the market. The data is collected with consideration to the heterogeneity of sources. Robust scientific techniques are in place for synthesizing disparate data sets and provide the essential contextual information that can orient market strategies. The Brainy Insights has extensive experience in data synthesis where the data passes through various stages:


Market Deduction & Formulation: The final stage comprises of assigning data points at appropriate market spaces so as to deduce feasible conclusions. Analyst perspective & subject matter expert based holistic form of market sizing coupled with industry analysis also plays a crucial role in this stage.
This stage involves in finalization of the market size and numbers that we have collected from data integration step. With data interpolation, it is made sure that there is no gap in the market data. Successful trend analysis is done by our analysts using extrapolation techniques, which provide the best possible forecasts for the market.
Data Validation & Market Feedback: Validation is the most important step in the process. Validation & re-validation via an intricately designed process helps us finalize data-points to be used for final calculations.

The Brainy Insights interacts with leading companies and experts of the concerned domain to develop the analyst team’s market understanding and expertise. It improves and substantiates every single data presented in the market reports. The data validation interview and discussion panels are typically composed of the most experienced industry members. The participants include, however, are not limited to:
Moreover, we always validate our data and findings through primary respondents from all the major regions we are working on.


Free Customization
Fortune 500 Clients
Free Yearly Update On Purchase Of Multi/Corporate License
Companies Served Till Date