- +1-315-215-1633
- sales@thebrainyinsights.com

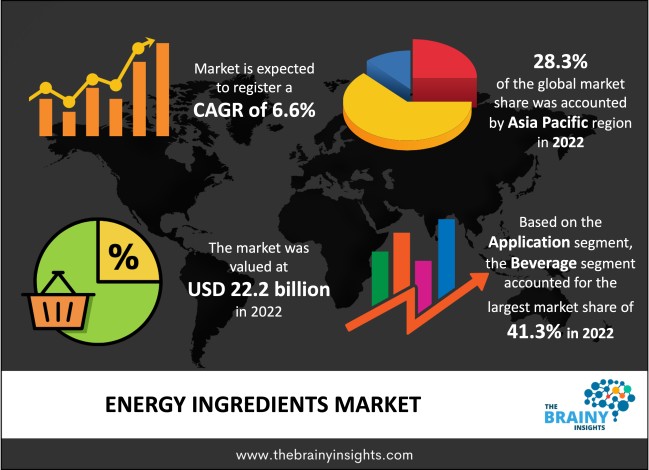
The global energy ingredients market was valued at USD 22.2 billion in 2022 and growing at a CAGR of 6.6% from 2023 to 2032. The market is expected to reach USD 41.8 billion by 2032. Margarine, cold cuts, bread goods, spreads, yogurt, and milk sausages—all food items made with protein ingredients—are in great demand, and the market is growing and experiencing strong demand. Sales of goods with caffeine as their primary constituent are expected to increase as the use of caffeine as a psychoactive stimulant in a variety of beverages—including coffee, tea, soda, and energy drinks—is becoming more popular. About 90% of adults in the U.S. consume caffeinated products, according to an article that appeared in Nutritional Journal, a peer-reviewed journal from the American Society of Nutrition, in April 2022. Additionally, caffeine improves a number of aspects of cognitive, physical, and occupational performance, which is anticipated to fuel the segment's growth in the years to come.
The market for energy ingredients has grown recently as a result of rising consumer interest in health and fitness as well as increased demand for natural and organic alternatives to conventional energy drinks and supplements. With an extensive range of suppliers and manufacturers offering a variety of energy components and formulas, the industry is quite competitive. The market for chemicals and compounds that are intended to increase energy levels and enhance athletic performance is referred to as the "energy ingredients market." Sports drinks, energy bars, vitamins, and other goods made for athletes and fitness fans frequently contain these components.
Get an overview of this study by requesting a free sample
Sports nutrition items that can aid consumers in achieving their objectives are in higher demand as more individuals develop an interest in physical fitness and sports. Energy ingredients are essential to these goods since they are frequently included to aid with endurance, tiredness reduction, and mental concentration when exercising. In addition, a large number of customers are becoming more health-conscious and searching for natural and organic alternatives to conventional energy drinks and supplements. As a result, there is now more demand for natural energy compounds including green tea, guarana, and beetroot.
When consumed in excess, certain energy-boosting chemicals, including excessive quantities of caffeine, can have harmful effects on the body. This has raised questions about the safety of energy drinks and supplements among consumers and health professionals, which might restrain industry expansion.
The energy ingredients industry has a chance to produce new plant-based sources of energy including green tea, yerba mate, and matcha as consumer interest in plant-based diets grows. Additionally, there is a chance for businesses to innovate and create fresh product formulations that combine energy ingredients with other useful ingredients like vitamins, minerals, and antioxidants. This could aid in product differentiation and increase customer attractiveness.
The Asia Pacific region dominated the market in 2022 with the market share of 28.3%. The desire for alternatives to conventional supplements, as well as a modernized lifestyle that necessitates the consumption of caffeinated beverages, are the primary reasons driving the industry. For example, Heineken Asia Pacific Beverages joined the energy drink industry in February 2021, employing components derived from organic materials such as caffeine, a powerful ingredient in the beverage that is reported to be popular among health-conscious customers. Furthermore, increased consumption of these drinks as a result of their claims to improve efficiency, stamina, and consciousness will increase consumer awareness of the product.
Asia Pacific Region Energy Ingredients Market Share in 2022 - 28.3%
www.thebrainyinsights.com
Check the geographical analysis of this market by requesting a free sample
Beverage segment dominated the global market in 2022 with the market share of 41.3%. The increasing acceptance of energy drinks will increase the market's potential since they provide quick bursts of energy while also stimulating the mind and body. As a result, major producers are introducing beverages containing caffeine as their primary component to enhance consumer health. For instance, Starbucks Coffee Company introduced Starbucks Baya Energy in February 2022 in collaboration with PepsiCo's North America Coffee JV. This RTD beverage uses caffeine found naturally in coffee berries together with the antioxidant vitamin C for a "boost of feel-good energy." In the following seven years, such launches including energy components will significantly boost the market.
The caffeine category held the largest market share in 2022 with the market share of 86.4%. Due to its capacity to boost energy while reducing calorie consumption, caffeine is widely used as an energy supplement. Additionally, caffeine stimulates the sympathetic nervous system, helping in controlling hunger, and raising the breakdown of fat cells to produce energy. All of these effects are anticipated to support the market's growth during the projected period.
| Attribute | Description |
|---|---|
| Market Size | Revenue (USD Billion) |
| Market size value in 2022 | USD 22.2 Billion |
| Market size value in 2032 | USD 41.8 Billion |
| CAGR (2023 to 2032) | 6.6% |
| Historical data | 2019-2021 |
| Base Year | 2022 |
| Forecast | 2023-2032 |
| Regional Segments | The regions analyzed for the market are Asia Pacific, Europe, South America, North America, and Middle East & Africa. Furthermore, the regions are further analyzed at the country level. |
| Segments | Application, Product |
As per The Brainy Insights, the size of the energy ingredients market was valued at USD 22.2 billion in 2022 to USD 41.8 billion by 2032.
The global energy ingredients market is growing at a CAGR of 6.6% during the forecast period 2023-2032.
The Asia Pacific region emerged as the largest market for the energy ingredients.
The rise in demand of sports nutrition products will influence the market's growth.
1. Introduction
1.1. Objectives of the Study
1.2. Market Definition
1.3. Research Scope
1.4. Currency
1.5. Key Target Audience
2. Research Methodology and Assumptions
3. Executive Summary
4. Premium Insights
4.1. Porter’s Five Forces Analysis
4.2. Value Chain Analysis
4.3. Top Investment Pockets
4.3.1. Market Attractiveness Analysis by Application
4.3.2. Market Attractiveness Analysis by Product
4.3.3. Market Attractiveness Analysis by Region
4.4. Industry Trends
5. Market Dynamics
5.1. Market Evaluation
5.2. Drivers
5.2.1. Rise in demand of sports nutrition products
5.3. Restraints
5.3.1. Excess of consumption can cause harmful impact on the body
5.4. Opportunities
5.4.1. Development of new products
6. Global Energy Ingredients Market Analysis and Forecast, By Application
6.1. Segment Overview
6.2. Food
6.3. Beverage
6.4. Supplements
6.5. Others
7. Global Energy Ingredients Market Analysis and Forecast, By Product
7.1. Segment Overview
7.2. Ginseng
7.3. Creatine
7.4. Taurine
7.5. Caffeine
8. Global Energy Ingredients Market Analysis and Forecast, By Regional Analysis
8.1. Segment Overview
8.2. North America
8.2.1. U.S.
8.2.2. Canada
8.2.3. Mexico
8.3. Europe
8.3.1. Germany
8.3.2. France
8.3.3. U.K.
8.3.4. Italy
8.3.5. Spain
8.4. Asia-Pacific
8.4.1. Japan
8.4.2. China
8.4.3. India
8.5. South America
8.5.1. Brazil
8.6. Middle East and Africa
8.6.1. UAE
8.6.2. South Africa
9. Global Energy Ingredients Market-Competitive Landscape
9.1. Overview
9.2. Market Share of Key Players in the Energy Ingredients Market
9.2.1. Global Company Market Share
9.2.2. North America Company Market Share
9.2.3. Europe Company Market Share
9.2.4. APAC Company Market Share
9.3. Competitive Situations and Trends
9.3.1. Product Launches and Developments
9.3.2. Partnerships, Collaborations, and Agreements
9.3.3. Mergers & Acquisitions
9.3.4. Expansions
10. Company Profiles
10.1. ILHWA CO., LTD.
10.1.1. Business Overview
10.1.2. Company Snapshot
10.1.3. Company Market Share Analysis
10.1.4. Company Product Portfolio
10.1.5. Recent Developments
10.1.6. SWOT Analysis
10.2. Applied Food Sciences, Inc. (AFS)
10.2.1. Business Overview
10.2.2. Company Snapshot
10.2.3. Company Market Share Analysis
10.2.4. Company Product Portfolio
10.2.5. Recent Developments
10.2.6. SWOT Analysis
10.3. Naturalin Bio-Resources Co., Ltd.
10.3.1. Business Overview
10.3.2. Company Snapshot
10.3.3. Company Market Share Analysis
10.3.4. Company Product Portfolio
10.3.5. Recent Developments
10.3.6. SWOT Analysis
10.4. Changsha Huir Biological-Tech Co., Ltd.
10.4.1. Business Overview
10.4.2. Company Snapshot
10.4.3. Company Market Share Analysis
10.4.4. Company Product Portfolio
10.4.5. Recent Developments
10.4.6. SWOT Analysis
10.5. Sinochem Pharmaceutical Co., Ltd.
10.5.1. Business Overview
10.5.2. Company Snapshot
10.5.3. Company Market Share Analysis
10.5.4. Company Product Portfolio
10.5.5. Recent Developments
10.5.6. SWOT Analysis
10.6. KOEI KOGYO CO., LTD
10.6.1. Business Overview
10.6.2. Company Snapshot
10.6.3. Company Market Share Analysis
10.6.4. Company Product Portfolio
10.6.5. Recent Developments
10.6.6. SWOT Analysis
10.7. Aarti Industries Ltd.
10.7.1. Business Overview
10.7.2. Company Snapshot
10.7.3. Company Market Share Analysis
10.7.4. Company Product Portfolio
10.7.5. Recent Developments
10.7.6. SWOT Analysis
10.8. BASF SE
10.8.1. Business Overview
10.8.2. Company Snapshot
10.8.3. Company Market Share Analysis
10.8.4. Company Product Portfolio
10.8.5. Recent Developments
10.8.6. SWOT Analysis
10.9. Spectrum Chemical Mfg. Corp.
10.9.1. Business Overview
10.9.2. Company Snapshot
10.9.3. Company Market Share Analysis
10.9.4. Company Product Portfolio
10.9.5. Recent Developments
10.9.6. SWOT Analysis
10.10. RFI Ingredients
10.10.1. Business Overview
10.10.2. Company Snapshot
10.10.3. Company Market Share Analysis
10.10.4. Company Product Portfolio
10.10.5. Recent Developments
10.10.6. SWOT Analysis
10.11. Korea Ginseng Corporation
10.11.1. Business Overview
10.11.2. Company Snapshot
10.11.3. Company Market Share Analysis
10.11.4. Company Product Portfolio
10.11.5. Recent Developments
10.11.6. SWOT Analysis
10.12. Orkla
10.12.1. Business Overview
10.12.2. Company Snapshot
10.12.3. Company Market Share Analysis
10.12.4. Company Product Portfolio
10.12.5. Recent Developments
10.12.6. SWOT Analysis
List of Table
1. Global Energy Ingredients Market, By Application, 2019-2032 (USD Billion)
2. Global Food Energy Ingredients Market, By Region, 2019-2032 (USD Billion)
3. Global Beverage Energy Ingredients Market, By Region, 2019-2032 (USD Billion)
4. Global Supplements Energy Ingredients Market, By Region, 2019-2032 (USD Billion)
5. Global Others Energy Ingredients Market, By Region, 2019-2032 (USD Billion)
6. Global Energy Ingredients Market, By Product, 2019-2032 (USD Billion)
7. Global Ginseng Energy Ingredients Market, By Region, 2019-2032 (USD Billion)
8. Global Creatine Energy Ingredients Market, By Region, 2019-2032 (USD Billion)
9. Global Taurine Energy Ingredients Market, By Region, 2019-2032 (USD Billion)
10. Global Caffeine Energy Ingredients Market, By Region, 2019-2032 (USD Billion)
11. Global Energy Ingredients Market, By Region, 2019-2032 (USD Billion)
12. North America Energy Ingredients Market, By Application, 2019-2032 (USD Billion)
13. North America Energy Ingredients Market, By Product, 2019-2032 (USD Billion)
14. U.S. Energy Ingredients Market, By Application, 2019-2032 (USD Billion)
15. U.S. Energy Ingredients Market, By Product, 2019-2032 (USD Billion)
16. Canada Energy Ingredients Market, By Application, 2019-2032 (USD Billion)
17. Canada Energy Ingredients Market, By Product, 2019-2032 (USD Billion)
18. Mexico Energy Ingredients Market, By Application, 2019-2032 (USD Billion)
19. Mexico Energy Ingredients Market, By Product, 2019-2032 (USD Billion)
20. Europe Energy Ingredients Market, By Application, 2019-2032 (USD Billion)
21. Europe Energy Ingredients Market, By Product, 2019-2032 (USD Billion)
22. Germany Energy Ingredients Market, By Application, 2019-2032 (USD Billion)
23. Germany Energy Ingredients Market, By Product, 2019-2032 (USD Billion)
24. France Energy Ingredients Market, By Application, 2019-2032 (USD Billion)
25. France Energy Ingredients Market, By Product, 2019-2032 (USD Billion)
26. U.K. Energy Ingredients Market, By Application, 2019-2032 (USD Billion)
27. U.K. Energy Ingredients Market, By Product, 2019-2032 (USD Billion)
28. Italy Energy Ingredients Market, By Application, 2019-2032 (USD Billion)
29. Italy Energy Ingredients Market, By Product, 2019-2032 (USD Billion)
30. Spain Energy Ingredients Market, By Application, 2019-2032 (USD Billion)
31. Spain Energy Ingredients Market, By Product, 2019-2032 (USD Billion)
32. Asia Pacific Energy Ingredients Market, By Application, 2019-2032 (USD Billion)
33. Asia Pacific Energy Ingredients Market, By Product, 2019-2032 (USD Billion)
34. Japan Energy Ingredients Market, By Application, 2019-2032 (USD Billion)
35. Japan Energy Ingredients Market, By Product, 2019-2032 (USD Billion)
36. China Energy Ingredients Market, By Application, 2019-2032 (USD Billion)
37. China Energy Ingredients Market, By Product, 2019-2032 (USD Billion)
38. India Energy Ingredients Market, By Application, 2019-2032 (USD Billion)
39. India Energy Ingredients Market, By Product, 2019-2032 (USD Billion)
40. South America Energy Ingredients Market, By Application, 2019-2032 (USD Billion)
41. South America Energy Ingredients Market, By Product, 2019-2032 (USD Billion)
42. Brazil Energy Ingredients Market, By Application, 2019-2032 (USD Billion)
43. Brazil Energy Ingredients Market, By Product, 2019-2032 (USD Billion)
44. Middle East and Africa Energy Ingredients Market, By Application, 2019-2032 (USD Billion)
45. Middle East and Africa Energy Ingredients Market, By Product, 2019-2032 (USD Billion)
46. UAE Energy Ingredients Market, By Application, 2019-2032 (USD Billion)
47. UAE Energy Ingredients Market, By Product, 2019-2032 (USD Billion)
48. South Africa Energy Ingredients Market, By Application, 2019-2032 (USD Billion)
49. South Africa Energy Ingredients Market, By Product, 2019-2032 (USD Billion)
List of Figures
1. Global Energy Ingredients Market Segmentation
2. Energy Ingredients Market: Research Methodology
3. Market Size Estimation Methodology: Bottom-Up Approach
4. Market Size Estimation Methodology: Top-Down Approach
5. Data Triangulation
6. Porter’s Five Forces Analysis
7. Value Chain Analysis
8. Global Energy Ingredients Market Attractiveness Analysis by Application
9. Global Energy Ingredients Market Attractiveness Analysis by Product
10. Global Energy Ingredients Market Attractiveness Analysis by Region
11. Global Energy Ingredients Market: Dynamics
12. Global Energy Ingredients Market Share by Application (2022 & 2032)
13. Global Energy Ingredients Market Share by Product (2022 & 2032)
14. Global Energy Ingredients Market Share by Regions (2022 & 2032)
15. Global Energy Ingredients Market Share by Company (2022)
This study forecasts revenue at global, regional, and country levels from 2019 to 2032. The Brainy Insights has segmented the global energy ingredients market based on below-mentioned segments:
Global Energy Ingredients Market by Application:
Global Energy Ingredients Market by Product:
Global Energy Ingredients Market by Region:
Research has its special purpose to undertake marketing efficiently. In this competitive scenario, businesses need information across all industry verticals; the information about customer wants, market demand, competition, industry trends, distribution channels etc. This information needs to be updated regularly because businesses operate in a dynamic environment. Our organization, The Brainy Insights incorporates scientific and systematic research procedures in order to get proper market insights and industry analysis for overall business success. The analysis consists of studying the market from a miniscule level wherein we implement statistical tools which helps us in examining the data with accuracy and precision.
Our research reports feature both; quantitative and qualitative aspects for any market. Qualitative information for any market research process are fundamental because they reveal the customer needs and wants, usage and consumption for any product/service related to a specific industry. This in turn aids the marketers/investors in knowing certain perceptions of the customers. Qualitative research can enlighten about the different product concepts and designs along with unique service offering that in turn, helps define marketing problems and generate opportunities. On the other hand, quantitative research engages with the data collection process through interviews, e-mail interactions, surveys and pilot studies. Quantitative aspects for the market research are useful to validate the hypotheses generated during qualitative research method, explore empirical patterns in the data with the help of statistical tools, and finally make the market estimations.
The Brainy Insights offers comprehensive research and analysis, based on a wide assortment of factual insights gained through interviews with CXOs and global experts and secondary data from reliable sources. Our analysts and industry specialist assume vital roles in building up statistical tools and analysis models, which are used to analyse the data and arrive at accurate insights with exceedingly informative research discoveries. The data provided by our organization have proven precious to a diverse range of companies, facilitating them to address issues such as determining which products/services are the most appealing, whether or not customers use the product in the manner anticipated, the purchasing intentions of the market and many others.
Our research methodology encompasses an idyllic combination of primary and secondary initiatives. Key phases involved in this process are listed below:

The phase involves the gathering and collecting of market data and its related information with the help of different sources & research procedures.

The data procurement stage involves in data gathering and collecting through various data sources.
This stage involves in extensive research. These data sources includes:
Purchased Database: Purchased databases play a crucial role in estimating the market sizes irrespective of the domain. Our purchased database includes:
Primary Research: The Brainy Insights interacts with leading companies and experts of the concerned domain to develop the analyst team’s market understanding and expertise. It improves and substantiates every single data presented in the market reports. Primary research mainly involves in telephonic interviews, E-mail interactions and face-to-face interviews with the raw material providers, manufacturers/producers, distributors, & independent consultants. The interviews that we conduct provides valuable data on market size and industry growth trends prevailing in the market. Our organization also conducts surveys with the various industry experts in order to gain overall insights of the industry/market. For instance, in healthcare industry we conduct surveys with the pharmacists, doctors, surgeons and nurses in order to gain insights and key information of a medical product/device/equipment which the customers are going to usage. Surveys are conducted in the form of questionnaire designed by our own analyst team. Surveys plays an important role in primary research because surveys helps us to identify the key target audiences of the market. Additionally, surveys helps to identify the key target audience engaged with the market. Our survey team conducts the survey by targeting the key audience, thus gaining insights from them. Based on the perspectives of the customers, this information is utilized to formulate market strategies. Moreover, market surveys helps us to understand the current competitive situation of the industry. To be precise, our survey process typically involve with the 360 analysis of the market. This analytical process begins by identifying the prospective customers for a product or service related to the market/industry to obtain data on how a product/service could fit into customers’ lives.

Secondary Research: The secondary data sources includes information published by the on-profit organizations such as World bank, WHO, company fillings, investor presentations, annual reports, national government documents, statistical databases, blogs, articles, white papers and others. From the annual report, we analyse a company’s revenue to understand the key segment and market share of that organization in a particular region. We analyse the company websites and adopt the product mapping technique which is important for deriving the segment revenue. In the product mapping method, we select and categorize the products offered by the companies catering to domain specific market, deduce the product revenue for each of the companies so as to get overall estimation of the market size. We also source data and analyses trends based on information received from supply side and demand side intermediaries in the value chain. The supply side denotes the data gathered from supplier, distributor, wholesaler and the demand side illustrates the data gathered from the end customers for respective market domain.

The supply side for a domain specific market is analysed by:
The demand side for the market is estimated through:
In-house Library: Apart from these third-party sources, we have our in-house library of qualitative and quantitative information. Our in-house database includes market data for various industry and domains. These data are updated on regular basis as per the changing market scenario. Our library includes, historic databases, internal audit reports and archives.
Sometimes there are instances where there is no metadata or raw data available for any domain specific market. For those cases, we use our expertise to forecast and estimate the market size in order to generate comprehensive data sets. Our analyst team adopt a robust research technique in order to produce the estimates:
Data Synthesis: This stage involves the analysis & mapping of all the information obtained from the previous step. It also involves in scrutinizing the data for any discrepancy observed while data gathering related to the market. The data is collected with consideration to the heterogeneity of sources. Robust scientific techniques are in place for synthesizing disparate data sets and provide the essential contextual information that can orient market strategies. The Brainy Insights has extensive experience in data synthesis where the data passes through various stages:


Market Deduction & Formulation: The final stage comprises of assigning data points at appropriate market spaces so as to deduce feasible conclusions. Analyst perspective & subject matter expert based holistic form of market sizing coupled with industry analysis also plays a crucial role in this stage.
This stage involves in finalization of the market size and numbers that we have collected from data integration step. With data interpolation, it is made sure that there is no gap in the market data. Successful trend analysis is done by our analysts using extrapolation techniques, which provide the best possible forecasts for the market.
Data Validation & Market Feedback: Validation is the most important step in the process. Validation & re-validation via an intricately designed process helps us finalize data-points to be used for final calculations.

The Brainy Insights interacts with leading companies and experts of the concerned domain to develop the analyst team’s market understanding and expertise. It improves and substantiates every single data presented in the market reports. The data validation interview and discussion panels are typically composed of the most experienced industry members. The participants include, however, are not limited to:
Moreover, we always validate our data and findings through primary respondents from all the major regions we are working on.


Free Customization
Fortune 500 Clients
Free Yearly Update On Purchase Of Multi/Corporate License
Companies Served Till Date