- +1-315-215-1633
- sales@thebrainyinsights.com

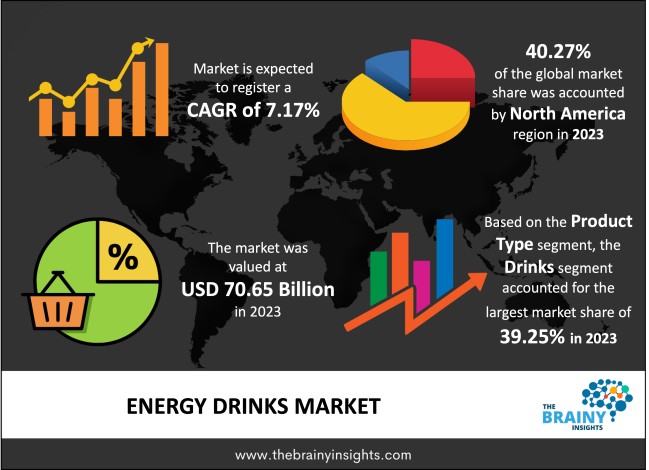
The global energy drinks market was valued at USD 70.65 Billion in 2023 and grew at a CAGR of 7.17% from 2024 to 2033. The market is expected to reach USD 141.18 Billion by 2033. The growth of the Energy Drinks market can be attributed to the rising investment in smartphone technology and increasing usage of televisions, laptops, PCs, and tablets.
Energy drinks are a particular beverage marketed to offer physical and cerebral stimulation. These drinks typically contain caffeine or other stimulants. Among many other potential ingredients, they might include sugar, other sweeteners, or herbal extracts and might or might not be carbonated. They are not the same as sports drinks, which are touted for improving athletic performance, but rather a subset of the broader category of energy goods, including bars and gels. This drink category has a wide range of brands and types. Caffeine is the main ingredient responsible for most energy drink benefits on cognitive function, such as enhanced attention and reaction time. Sugar and caffeine are present in energy drinks, but the effects of the many other chemicals are either negligible or nonexistent. After multivitamins, energy drinks rank second in popularity among dietary supplements among teenagers and young adults in the United States. The market is largely driven by a shift in consumer preferences and a focus on innovating new ingredients and recipes. People are looking for quick energy and more focus on their health, which is also propelling the growth of the market.
Get an overview of this study by requesting a free sample
Increasing application of energy drinks: Consumers are becoming familiar with energy drinks due to the growing product launches. The market is fragmented, with many smaller firms striving to position themselves as market leaders in this field, even if a few major giants continue to steer the category. Over the past 20 years, there has been a sharp rise in the consumption of energy drinks, especially among teenagers and young people. Energy drinks are heavily marketed as providing an energy boost to enhance cognitive and physical performance. Consumers nowadays are more concerned about their health and do not want to sacrifice fantastic taste. Energy drinks free from glucose, sugar and fructose are in higher demand because they meet the emerging needs for a mindful lifestyle.
Side effects: An increasing amount of scholarly research indicates that energy drinks may harm one's health, especially in young adults, teens, and children. Several studies have shown that energy drinks increase physical endurance, but there is less proof that they impact muscle strength or power. Energy drinks can increase attentiveness and reaction time but may also cause hand tremors.
Rising investment from the food and beverages service industry: The increased demand for processed foods and drinks is fueling market expansion. The Asia-Pacific region's rising economies are strengthening, and more people are entering the middle class, which is the key reason driving this industry. A number of significant reasons that have contributed to the rise in demand for energy drinks have prompted manufacturers of functional beverages to increase production and make significant investments in the industry. As a result, producers of energy drinks have every reason to boost output given the growing consumer demand for processed drinks.
The regions analyzed for the market include North America, Europe, South America, Asia Pacific, the Middle East, and Africa. North America emerged as the most significant energy drinks market, with a 40.27% market revenue share in 2023.
The North American region will account for the largest market share with revenue growth. The rising demand for energy drinks can be attributed to the rising disposable income and increasing preference among millennials and Gen Z. The presence of medium-scale and large-scale players is the primary factor contributing to the market growth in the U.S. and Canada. Furthermore, the rising number of fitness enthusiasts in the region will provide lucrative opportunities to the market.
North America region Energy Drinks Market Share in 2023 - 40.27%
www.thebrainyinsights.com
Check the geographical analysis of this market by requesting a free sample
The product type segment is divided into mixers, shots and drinks. The drinks segment dominated the market, with a share of around 39.25% in 2023. Due to its superior taste and rapid energy boost, energy drinks are preferred by most customers. These beverages are also easily accessible and suitable for social events and leisure activities. Energy shots are becoming increasingly popular among seniors who want to feel refreshed and energized immediately.
The source segment is divided into organic and conventional. The conventional segment dominated the market, with a share of around 67.92% in 2023. Conventional energy drinks are less expensive than organic ones, so users tend to drink them more frequently. They are also in more demand because they are easily available, and many consumers prefer the taste over organic ones.
The packaging segment is divided into cans, bottles and others. The cans segment dominated the market, with a share of around 43.18% in 2023. As cans are lightweight and practical, these are very popular among Gen Z and millennials. Additionally, the younger generation finds their design appealing, which is why the product's manufacturers are introducing it in can packaging.
The distribution channel segment is divided into on-trade and off-trade. The off-trade segment dominated the market, with a share of around 72.89% in 2023. Most consumers choose to acquire energy drinks through off-trade channels like hypermarkets, supermarkets, convenience stores, and department stores since they want to buy them in addition to other household commodities. Additionally, a large selection of brands is another factor that lures customers to purchase goods through the off-trade channel.
| Attribute | Description |
|---|---|
| Market Size | Revenue (USD Billion) |
| Market size value in 2023 | USD 70.65 Billion |
| Market size value in 2033 | USD 141.18 Billion |
| CAGR (2024 to 2033) | 7.17% |
| Historical data | 2020-2022 |
| Base Year | 2023 |
| Forecast | 2024-2033 |
| Region | The regions analyzed for the market are Asia Pacific, Europe, South America, North America, and Middle East & Africa. Furthermore, the regions are further analyzed at the country level. |
| Segments | Product Type, Source, Packaging, and Distribution Channel |
As per The Brainy Insights, the size of the energy drinks market was valued at USD 70.65 Billion in 2023 to USD 141.18 Billion by 2033.
Global energy drinks market is growing at a CAGR of 7.17% during the forecast period 2024-2033.
North America region emerged as the largest market for the energy drinks.
The market's growth will be influenced by the rising consumption of energy drinks among athletes.
The potential side-effects can hamper the market growth.
The increasing investment in functional beverages is providing huge opportunities to the market.
Key players are Red Bull, 5-hour Energy, The Coca Cola Company, PepsiCo, Monster Energy, Suntory Holdings Ltd., Amway, Otsuka Holdings Co Ltd., Herbalife Nutrition, Eastroc Beverage (Group) Co. Ltd., Campbell Soup Company among others.
1. Introduction
1.1. Objectives of the Study
1.2. Market Definition
1.3. Research Scope
1.4. Currency
1.5. Key Target Audience
2. Research Methodology and Assumptions
3. Executive Summary
4. Premium Insights
4.1. Porter’s Five Forces Analysis
4.2. Value Chain Analysis
4.3. Top Investment Pockets
4.3.1. Market Attractiveness Analysis By Product Type
4.3.2. Market Attractiveness Analysis By Source
4.3.3. Market Attractiveness Analysis By Packaging
4.3.4. Market Attractiveness Analysis By Distribution Channel
4.3.5. Market Attractiveness Analysis By Region
4.4. Industry Trends
5. Market Dynamics
5.1. Market Evaluation
5.2. Drivers
5.2.1. Increasing demand for energy drinks
5.3. Restraints
5.3.1. Side-effects
5.4. Opportunities
5.4.1. Rising investment in functional beverages
5.5. Challenges
5.5.1. Negative perception
6. Global Energy Drinks Market Analysis and Forecast, By Product Type
6.1. Segment Overview
6.2. Mixer
6.3. Shots
6.4. Drinks
7. Global Energy Drinks Market Analysis and Forecast, By Source
7.1. Segment Overview
7.2. Organic
7.3. Conventional
8. Global Energy Drinks Market Analysis and Forecast, By Packaging
8.1. Segment Overview
8.2. Cans
8.3. Bottles
8.4. Others
9. Global Energy Drinks Market Analysis and Forecast, By Distribution Channel
9.1. Segment Overview
9.2. On-Trade
9.3. Off-Trade
10. Global Energy Drinks Market Analysis and Forecast, By Regional Analysis
10.1. Segment Overview
10.2. North America
10.2.1. U.S.
10.2.2. Canada
10.2.3. Mexico
10.3. Europe
10.3.1. Germany
10.3.2. France
10.3.3. U.K.
10.3.4. Italy
10.3.5. Spain
10.4. Asia-Pacific
10.4.1. Japan
10.4.2. China
10.4.3. India
10.5. South America
10.5.1. Brazil
10.6. Middle East and Africa
10.6.1. UAE
10.6.2. South Africa
11. Global Energy Drinks Market-Competitive Landscape
11.1. Overview
11.2. Market Share of Key Players in the Energy Drinks Market
11.2.1. Global Company Market Share
11.2.2. North America Company Market Share
11.2.3. Europe Company Market Share
11.2.4. APAC Company Market Share
11.3. Competitive Situations and Trends
11.3.1. Product Launches and Developments
11.3.2. Partnerships, Collaborations, and Agreements
11.3.3. Mergers & Acquisitions
11.3.4. Expansions
12. Company Profiles
12.1. Red Bull
12.1.1. Business Overview
12.1.2. Company Snapshot
12.1.3. Company Market Share Analysis
12.1.4. Company Product Portfolio
12.1.5. Recent Developments
12.1.6. SWOT Analysis
12.2. 5-hour Energy
12.2.1. Business Overview
12.2.2. Company Snapshot
12.2.3. Company Market Share Analysis
12.2.4. Company Product Portfolio
12.2.5. Recent Developments
12.2.6. SWOT Analysis
12.3. The Coca Cola Company
12.3.1. Business Overview
12.3.2. Company Snapshot
12.3.3. Company Market Share Analysis
12.3.4. Company Product Portfolio
12.3.5. Recent Developments
12.3.6. SWOT Analysis
12.4. PepsiCo
12.4.1. Business Overview
12.4.2. Company Snapshot
12.4.3. Company Market Share Analysis
12.4.4. Company Product Portfolio
12.4.5. Recent Developments
12.4.6. SWOT Analysis
12.5. Monster Energy
12.5.1. Business Overview
12.5.2. Company Snapshot
12.5.3. Company Market Share Analysis
12.5.4. Company Product Portfolio
12.5.5. Recent Developments
12.5.6. SWOT Analysis
12.6. Suntory Holdings Ltd.
12.6.1. Business Overview
12.6.2. Company Snapshot
12.6.3. Company Market Share Analysis
12.6.4. Company Product Portfolio
12.6.5. Recent Developments
12.6.6. SWOT Analysis
12.7. Amway
12.7.1. Business Overview
12.7.2. Company Snapshot
12.7.3. Company Market Share Analysis
12.7.4. Company Product Portfolio
12.7.5. Recent Developments
12.7.6. SWOT Analysis
12.8. Otsuka Holdings Co Ltd.
1.1.1. Business Overview
1.1.2. Company Snapshot
1.1.3. Company Market Share Analysis
1.1.4. Company Product Portfolio
1.1.5. Recent Developments
1.1.6. SWOT Analysis
12.9. Herbalife Nutrition
12.9.1. Business Overview
12.9.2. Company Snapshot
12.9.3. Company Market Share Analysis
12.9.4. Company Product Portfolio
12.9.5. Recent Developments
12.9.6. SWOT Analysis
12.10. Eastroc Beverage (Group) Co. Ltd.
12.10.1. Business Overview
12.10.2. Company Snapshot
12.10.3. Company Market Share Analysis
12.10.4. Company Product Portfolio
12.10.5. Recent Developments
12.10.6. SWOT Analysis
12.11. Campbell Soup Company
12.11.1. Business Overview
12.11.2. Company Snapshot
12.11.3. Company Market Share Analysis
12.11.4. Company Product Portfolio
12.11.5. Recent Developments
12.11.6. SWOT Analysis
List of Table
1. Global Energy Drinks Market, By Product Type, 2020-2033 (USD Billion)
2. Global Mixer, Energy Drinks Market, By Region, 2020-2033 (USD Billion)
3. Global Shots, Energy Drinks Market, By Region, 2020-2033 (USD Billion)
4. Global Drinks, Energy Drinks Market, By Region, 2020-2033 (USD Billion)
5. Global Energy Drinks Market, By Source, 2020-2033 (USD Billion)
6. Global Organic, Energy Drinks Market, By Region, 2020-2033 (USD Billion)
7. Global Conventional, Energy Drinks Market, By Region, 2020-2033 (USD Billion)
8. Global Energy Drinks Market, By Packaging, 2020-2033 (USD Billion)
9. Global Cans, Energy Drinks Market, By Region, 2020-2033 (USD Billion)
10. Global Bottles, Energy Drinks Market, By Region, 2020-2033 (USD Billion)
11. Global Others, Energy Drinks Market, By Region, 2020-2033 (USD Billion)
12. Global Energy Drinks Market, By Distribution Channel, 2020-2033 (USD Billion)
13. Global On-Trade, Energy Drinks Market, By Region, 2020-2033 (USD Billion)
14. Global Off-Trade, Energy Drinks Market, By Region, 2020-2033 (USD Billion)
15. Global Energy Drinks Market, By Region, 2020-2033 (USD Billion)
16. North America Energy Drinks Market, By Product Type, 2020-2033 (USD Billion)
17. North America Energy Drinks Market, By Source, 2020-2033 (USD Billion)
18. North America Energy Drinks Market, By Packaging, 2020-2033 (USD Billion)
19. North America Energy Drinks Market, By Distribution Channel, 2020-2033 (USD Billion)
20. U.S. Energy Drinks Market, By Product Type, 2020-2033 (USD Billion)
21. U.S. Energy Drinks Market, By Source, 2020-2033 (USD Billion)
22. U.S. Energy Drinks Market, By Packaging, 2020-2033 (USD Billion)
23. U.S. Energy Drinks Market, By Distribution Channel, 2020-2033 (USD Billion)
24. Canada Energy Drinks Market, By Product Type, 2020-2033 (USD Billion)
25. Canada Energy Drinks Market, By Source, 2020-2033 (USD Billion)
26. Canada Energy Drinks Market, By Packaging, 2020-2033 (USD Billion)
27. Canada Energy Drinks Market, By Distribution Channel, 2020-2033 (USD Billion)
28. Mexico Energy Drinks Market, By Product Type, 2020-2033 (USD Billion)
29. Mexico Energy Drinks Market, By Source, 2020-2033 (USD Billion)
30. Mexico Energy Drinks Market, By Packaging, 2020-2033 (USD Billion)
31. Mexico Energy Drinks Market, By Distribution Channel, 2020-2033 (USD Billion)
32. Europe Energy Drinks Market, By Product Type, 2020-2033 (USD Billion)
33. Europe Energy Drinks Market, By Source, 2020-2033 (USD Billion)
34. Europe Energy Drinks Market, By Packaging, 2020-2033 (USD Billion)
35. Europe Energy Drinks Market, By Distribution Channel, 2020-2033 (USD Billion)
36. Germany Energy Drinks Market, By Product Type, 2020-2033 (USD Billion)
37. Germany Energy Drinks Market, By Source, 2020-2033 (USD Billion)
38. Germany Energy Drinks Market, By Packaging, 2020-2033 (USD Billion)
39. Germany Energy Drinks Market, By Distribution Channel, 2020-2033 (USD Billion)
40. France Energy Drinks Market, By Product Type, 2020-2033 (USD Billion)
41. France Energy Drinks Market, By Source, 2020-2033 (USD Billion)
42. France Energy Drinks Market, By Packaging, 2020-2033 (USD Billion)
43. France Energy Drinks Market, By Distribution Channel, 2020-2033 (USD Billion)
44. U.K. Energy Drinks Market, By Product Type, 2020-2033 (USD Billion)
45. U.K. Energy Drinks Market, By Source, 2020-2033 (USD Billion)
46. U.K. Energy Drinks Market, By Packaging, 2020-2033 (USD Billion)
47. U.K. Energy Drinks Market, By Distribution Channel, 2020-2033 (USD Billion)
48. Italy Energy Drinks Market, By Product Type, 2020-2033 (USD Billion)
49. Italy Energy Drinks Market, By Source, 2020-2033 (USD Billion)
50. Italy Energy Drinks Market, By Packaging, 2020-2033 (USD Billion)
51. Italy Energy Drinks Market, By Distribution Channel, 2020-2033 (USD Billion)
52. Spain Energy Drinks Market, By Product Type, 2020-2033 (USD Billion)
53. Spain Energy Drinks Market, By Source, 2020-2033 (USD Billion)
54. Spain Energy Drinks Market, By Packaging, 2020-2033 (USD Billion)
55. Spain Energy Drinks Market, By Distribution Channel, 2020-2033 (USD Billion)
56. Asia Pacific Energy Drinks Market, By Product Type, 2020-2033 (USD Billion)
57. Asia Pacific Energy Drinks Market, By Source, 2020-2033 (USD Billion)
58. Asia Pacific Energy Drinks Market, By Packaging, 2020-2033 (USD Billion)
59. Asia Pacific Energy Drinks Market, By Distribution Channel, 2020-2033 (USD Billion)
60. Japan Energy Drinks Market, By Product Type, 2020-2033 (USD Billion)
61. Japan Energy Drinks Market, By Source, 2020-2033 (USD Billion)
62. Japan Energy Drinks Market, By Packaging, 2020-2033 (USD Billion)
63. Japan Energy Drinks Market, By Distribution Channel, 2020-2033 (USD Billion)
64. China Energy Drinks Market, By Product Type, 2020-2033 (USD Billion)
65. China Energy Drinks Market, By Source, 2020-2033 (USD Billion)
66. China Energy Drinks Market, By Packaging, 2020-2033 (USD Billion)
67. China Energy Drinks Market, By Distribution Channel, 2020-2033 (USD Billion)
68. India Energy Drinks Market, By Product Type, 2020-2033 (USD Billion)
69. India Energy Drinks Market, By Source, 2020-2033 (USD Billion)
70. India Energy Drinks Market, By Packaging, 2020-2033 (USD Billion)
71. India Energy Drinks Market, By Distribution Channel, 2020-2033 (USD Billion)
72. South America Energy Drinks Market, By Product Type, 2020-2033 (USD Billion)
73. South America Energy Drinks Market, By Source, 2020-2033 (USD Billion)
74. South America Energy Drinks Market, By Packaging, 2020-2033 (USD Billion)
75. South America Energy Drinks Market, By Distribution Channel, 2020-2033 (USD Billion)
76. Brazil Energy Drinks Market, By Product Type, 2020-2033 (USD Billion)
77. Brazil Energy Drinks Market, By Source, 2020-2033 (USD Billion)
78. Brazil Energy Drinks Market, By Packaging, 2020-2033 (USD Billion)
79. Brazil Energy Drinks Market, By Distribution Channel, 2020-2033 (USD Billion)
80. Middle East and Africa Energy Drinks Market, By Product Type, 2020-2033 (USD Billion)
81. Middle East and Africa Energy Drinks Market, By Source, 2020-2033 (USD Billion)
82. Middle East and Africa Energy Drinks Market, By Packaging, 2020-2033 (USD Billion)
83. Middle East and Africa Energy Drinks Market, By Distribution Channel, 2020-2033 (USD Billion)
84. UAE Energy Drinks Market, By Product Type, 2020-2033 (USD Billion)
85. UAE Energy Drinks Market, By Source, 2020-2033 (USD Billion)
86. UAE Energy Drinks Market, By Packaging, 2020-2033 (USD Billion)
87. UAE Energy Drinks Market, By Distribution Channel, 2020-2033 (USD Billion)
88. South Africa Energy Drinks Market, By Product Type, 2020-2033 (USD Billion)
89. South Africa Energy Drinks Market, By Source, 2020-2033 (USD Billion)
90. South Africa Energy Drinks Market, By Packaging, 2020-2033 (USD Billion)
91. South Africa Energy Drinks Market, By Distribution Channel, 2020-2033 (USD Billion)
List of Figures
1. Global Energy Drinks Market Segmentation
2. Energy Drinks Market: Research Methodology
3. Market Size Estimation Methodology: Bottom-Up Approach
4. Market Size Estimation Methodology: Top-Down Approach
5. Data Triangulation
6. Porter’s Five Forces Analysis
7. Value Chain Analysis
8. Global Energy Drinks Market Attractiveness Analysis By Product Type
9. Global Energy Drinks Market Attractiveness Analysis By Source
10. Global Energy Drinks Market Attractiveness Analysis By Packaging
11. Global Energy Drinks Market Attractiveness Analysis By Distribution Channel
12. Global Energy Drinks Market Attractiveness Analysis By Region
13. Global Energy Drinks Market: Dynamics
14. Global Energy Drinks Market Share by Product Type (2023 & 2032)
15. Global Energy Drinks Market Share by Source (2023 & 2032)
16. Global Energy Drinks Market Share by Packaging (2023 & 2032)
17. Global Energy Drinks Market Share by Distribution Channel (2023 & 2032)
18. Global Energy Drinks Market Share by Regions (2023 & 2032)
19. Global Energy Drinks Market Share by Company (2023)
This study forecasts revenue at global, regional, and country levels from 2020 to 2033. The Brainy Insights has segmented the global energy drinks market based on below mentioned segments:
Global Energy Drinks Market by Product Type:
Global Energy Drinks Market by Source:
Global Energy Drinks Market by Packaging:
Global Energy Drinks Market by Distribution Channel:
Global Energy Drinks Market by Region:
Research has its special purpose to undertake marketing efficiently. In this competitive scenario, businesses need information across all industry verticals; the information about customer wants, market demand, competition, industry trends, distribution channels etc. This information needs to be updated regularly because businesses operate in a dynamic environment. Our organization, The Brainy Insights incorporates scientific and systematic research procedures in order to get proper market insights and industry analysis for overall business success. The analysis consists of studying the market from a miniscule level wherein we implement statistical tools which helps us in examining the data with accuracy and precision.
Our research reports feature both; quantitative and qualitative aspects for any market. Qualitative information for any market research process are fundamental because they reveal the customer needs and wants, usage and consumption for any product/service related to a specific industry. This in turn aids the marketers/investors in knowing certain perceptions of the customers. Qualitative research can enlighten about the different product concepts and designs along with unique service offering that in turn, helps define marketing problems and generate opportunities. On the other hand, quantitative research engages with the data collection process through interviews, e-mail interactions, surveys and pilot studies. Quantitative aspects for the market research are useful to validate the hypotheses generated during qualitative research method, explore empirical patterns in the data with the help of statistical tools, and finally make the market estimations.
The Brainy Insights offers comprehensive research and analysis, based on a wide assortment of factual insights gained through interviews with CXOs and global experts and secondary data from reliable sources. Our analysts and industry specialist assume vital roles in building up statistical tools and analysis models, which are used to analyse the data and arrive at accurate insights with exceedingly informative research discoveries. The data provided by our organization have proven precious to a diverse range of companies, facilitating them to address issues such as determining which products/services are the most appealing, whether or not customers use the product in the manner anticipated, the purchasing intentions of the market and many others.
Our research methodology encompasses an idyllic combination of primary and secondary initiatives. Key phases involved in this process are listed below:

The phase involves the gathering and collecting of market data and its related information with the help of different sources & research procedures.

The data procurement stage involves in data gathering and collecting through various data sources.
This stage involves in extensive research. These data sources includes:
Purchased Database: Purchased databases play a crucial role in estimating the market sizes irrespective of the domain. Our purchased database includes:
Primary Research: The Brainy Insights interacts with leading companies and experts of the concerned domain to develop the analyst team’s market understanding and expertise. It improves and substantiates every single data presented in the market reports. Primary research mainly involves in telephonic interviews, E-mail interactions and face-to-face interviews with the raw material providers, manufacturers/producers, distributors, & independent consultants. The interviews that we conduct provides valuable data on market size and industry growth trends prevailing in the market. Our organization also conducts surveys with the various industry experts in order to gain overall insights of the industry/market. For instance, in healthcare industry we conduct surveys with the pharmacists, doctors, surgeons and nurses in order to gain insights and key information of a medical product/device/equipment which the customers are going to usage. Surveys are conducted in the form of questionnaire designed by our own analyst team. Surveys plays an important role in primary research because surveys helps us to identify the key target audiences of the market. Additionally, surveys helps to identify the key target audience engaged with the market. Our survey team conducts the survey by targeting the key audience, thus gaining insights from them. Based on the perspectives of the customers, this information is utilized to formulate market strategies. Moreover, market surveys helps us to understand the current competitive situation of the industry. To be precise, our survey process typically involve with the 360 analysis of the market. This analytical process begins by identifying the prospective customers for a product or service related to the market/industry to obtain data on how a product/service could fit into customers’ lives.

Secondary Research: The secondary data sources includes information published by the on-profit organizations such as World bank, WHO, company fillings, investor presentations, annual reports, national government documents, statistical databases, blogs, articles, white papers and others. From the annual report, we analyse a company’s revenue to understand the key segment and market share of that organization in a particular region. We analyse the company websites and adopt the product mapping technique which is important for deriving the segment revenue. In the product mapping method, we select and categorize the products offered by the companies catering to domain specific market, deduce the product revenue for each of the companies so as to get overall estimation of the market size. We also source data and analyses trends based on information received from supply side and demand side intermediaries in the value chain. The supply side denotes the data gathered from supplier, distributor, wholesaler and the demand side illustrates the data gathered from the end customers for respective market domain.

The supply side for a domain specific market is analysed by:
The demand side for the market is estimated through:
In-house Library: Apart from these third-party sources, we have our in-house library of qualitative and quantitative information. Our in-house database includes market data for various industry and domains. These data are updated on regular basis as per the changing market scenario. Our library includes, historic databases, internal audit reports and archives.
Sometimes there are instances where there is no metadata or raw data available for any domain specific market. For those cases, we use our expertise to forecast and estimate the market size in order to generate comprehensive data sets. Our analyst team adopt a robust research technique in order to produce the estimates:
Data Synthesis: This stage involves the analysis & mapping of all the information obtained from the previous step. It also involves in scrutinizing the data for any discrepancy observed while data gathering related to the market. The data is collected with consideration to the heterogeneity of sources. Robust scientific techniques are in place for synthesizing disparate data sets and provide the essential contextual information that can orient market strategies. The Brainy Insights has extensive experience in data synthesis where the data passes through various stages:


Market Deduction & Formulation: The final stage comprises of assigning data points at appropriate market spaces so as to deduce feasible conclusions. Analyst perspective & subject matter expert based holistic form of market sizing coupled with industry analysis also plays a crucial role in this stage.
This stage involves in finalization of the market size and numbers that we have collected from data integration step. With data interpolation, it is made sure that there is no gap in the market data. Successful trend analysis is done by our analysts using extrapolation techniques, which provide the best possible forecasts for the market.
Data Validation & Market Feedback: Validation is the most important step in the process. Validation & re-validation via an intricately designed process helps us finalize data-points to be used for final calculations.

The Brainy Insights interacts with leading companies and experts of the concerned domain to develop the analyst team’s market understanding and expertise. It improves and substantiates every single data presented in the market reports. The data validation interview and discussion panels are typically composed of the most experienced industry members. The participants include, however, are not limited to:
Moreover, we always validate our data and findings through primary respondents from all the major regions we are working on.


Free Customization
Fortune 500 Clients
Free Yearly Update On Purchase Of Multi/Corporate License
Companies Served Till Date