- +1-315-215-1633
- sales@thebrainyinsights.com

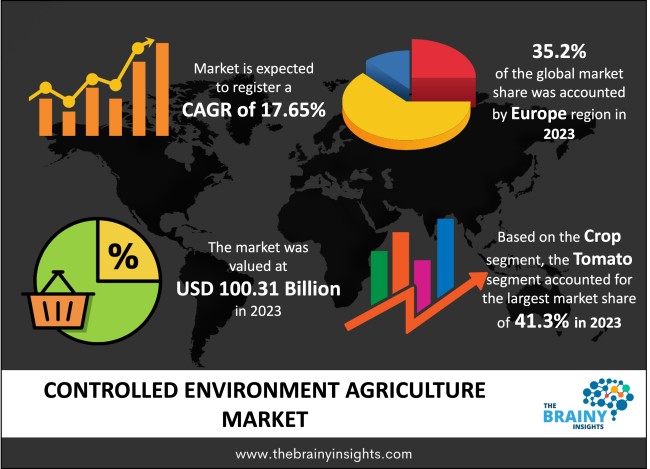
The global controlled environment agriculture market was valued at USD 100.31 billion in 2023 and growing at a CAGR of 17.65% from 2024 to 2033. The market is expected to reach USD 509.63 billion by 2032. Controlled environment agriculture (CEA) consists of high tunnels, greenhouses, vertical farms and plant factories. It is considered a crucial strategy for addressing global food challenges. Controlled environment agriculture can be further classified based on production technology such as aquaponics, hydroponics, aeroponics and soil-based. This type of agriculture takes knowledge from various disciplines to optimise crop quality and production efficiency in not-so-sufficient arable land. Based on many sources, CEA is more than 90% efficient in water use and produces around 10 to 250 times higher yield per unit area. It generates around 80% less wastage in comparison to traditional filed production. Moreover, it decreases the food transportation miles in urban areas.
Controlled Environment Agriculture (CEA) is the growth of crops by controlling some of the aspects of the environment to decrease the pest or diseases, surging efficiencies, making more sustainable and increasing the yield or saving cost. Many organisations involved in this focus on variables that can be controlled using automation, like humidity, temperature, carbon dioxide, light, nutrients, etc. In this type of agriculture, there is a use of technology and data for growing crops for food, nutraceutical and pharmaceutical applications, among others. Recent trends suggest that investment has increased for the CEA market. Based on one of the studies, in 2017, hundreds of millions of dollars were invested in hi-tech CEA facilities like Bowery Farms, AeroFrams and Plenty. Moreover, there is an investment by high-profile investors such as Jeff Bezos and Kimbal Musk. Well-established firms such as Goldman Sachs and Prudential have also invested in the controlled environment agriculture sector. It significantly saves land usage. For instance, when the crops are vertically stacked in the purpose-built facility, their production equals 4 to 6 acres in a single indoor acre. It varies based on the crops; if one is growing strawberries, traditional farming would need 30 acres to produce the amount which can be produced by one acre of vertical farming space. Moreover, the yield of crops is also higher in the controlled environments as there is a reduction in the effects of seasonality. Controlled environment agriculture plays an active role in producing pharmaceutical products, especially cannabis production for cosmetics, medicinal and health supplements. Many countries are introducing licences and relaxing laws, which is leading to the expansion of the cannabis industry significantly.
The innovative concept of controlled environment agriculture aims to prioritize sustainable food production through technology and innovation. This approach involves utilizing various methods, such as greenhouses, hydroponic systems, vertical farms, and aeroponics, that can be customized based on specific crop requirements and market demand. With population growth, urbanization, and climate change posing major challenges to conventional agriculture practices worldwide, controlled environment agriculture is a resilient solution to promote environmental stewardship while meeting evolving consumer preferences concerning food security issues.
Get an overview of this study by requesting a free sample
Focus on increasing food production – The global population is around 7.8 billion, which in 2050 is anticipated to reach around 9.7 billion. Increasing global food production by 70% is needed to feed everyone. If using the current farming practices, there would be a need for an extra 20% of land for fulfilling the need. Moreover, climate change is also affecting farmers globally with extreme weather patterns like heatwaves and floods. The frequency of such patterns has increased. Growing dependency on chemical herbicides and pesticides also affects the farmers and natural ecosystems. CEA offers more sustainable and profitable options by decreasing the water consumption and needs for logistics, chemical products and land use. For instance, Saudi Arabian farmers use CEA to grow fresh crops; the strong sunlight here is used for solar energy. Moreover, based on one of the studies, around one-third of the food produced worldwide gets wasted in the supply chain process. CEA helps reduce the long supply chain by allowing locally grown, quick-to-market produce. It is bought and consumed where it is produced. These factors are eventually driving the controlled environment agriculture market.
Operational cost is high – The operational cost for controlled environment agriculture is high due to the high demand for energy consumption and an intensive production system. Moreover, labour is needed all year round, and the labour requirement is also substantially higher than in traditional agriculture. The crop cycle in the CEA is also comparatively small; hence the timely decision for performing a specific operation is crucial. Also, there is a shortage of well-trained skilled labour in this field. These factors act as restraints for the market.
Advantages of government schemes and demand from pharmaceutical companies - Indoor farming is gaining lots of attention from retailers, supermarkets, pharmaceutical organizations and investors. The supply chain also reduces in size as farmers could use CEA for growing a large variety of produce locally. It benefits everyone in the supply chain, including consumers. Moreover, CEA helps in delivering food of consistent quality and quantity. There is also no requirement to add wax coatings and preservatives to preserve fresh produce consumer-ready. Recently CEA demand has been increasing. For instance, the global vertical farming market was around USD 3.12 billion in 2019 and is estimated to reach USD 16.77 billion by 2027. Moreover, there are advantages of government schemes; like in the UK and Europe, many of the farming decisions for the crops are based on government subsidies available at the time. For encouraging more environmentally friendly land management, many grants are available for controlled environment agriculture. All these factors will drive the controlled environment agriculture market in the forecast period.
The regions analyzed for the market include North America, Europe, South America, Asia Pacific, the Middle East, and Africa. Europe emerged as the largest market for the global controlled environment agriculture market, with a 35.2% share of the market revenue in 2023.
Europe region will account for the largest market share with revenue growth. Rapid technological advancement, urbanization and high demand for vegetables and fruits are some factors that made Europe the largest player. Moreover, the European commercial greenhouse is considered the most energy-intensive sector in agriculture. Europe was the first to enforce advanced practices in greenhouses, especially in the countries like Spain, Italy and Netherlands, where big areas are under greenhouse cultivation. Also, government initiatives for promoting greenhouse farming are boosting the growth of commercial greenhouses. Based on one of the studies, some of the leading greenhouse-producing areas in Europe are Spain with around 46,000 hectares, Italy with 25,000 hectares, France with 9,500 hectares and Greece with 3,800 hectares.
Europe Region Controlled Environment Agriculture Market Share in 2023 - 35.2%
www.thebrainyinsights.com
Check the geographical analysis of this market by requesting a free sample
The crop segment is divided into leafy greens, tomato, strawberries, cucumber, pepper, cannabis and others. The tomato segment dominated the market, with a market share of around 41.3% in 2023. This factor is attributed to the high capital costs for controlled environment agriculture due to artificial heating and cooling. Hence, appropriate crops are needed which have high economic values, like tomatoes. Growing tomatoes hydroponically leads to less chance of plant disease, faster plant growth and greater yield of crops. Moreover, it is broadly used in food processing and is in great demand worldwide.
The method segment is divided into hydroponics, aquaponics, aeroponics and others. The hydroponics segment dominated the market, with a market share of around 45.2% in 2023. This factor is because of huge market opportunities, and many investors have entered this sector. These investor groups include traditional agriculture funders and Silicon Valley tech firms. Based on one of the studies in 2017, around USD 652 million was invested in novel farming systems, with CEA being the largest share in that, which was an increase of 233% compared to the previous year.
| Attribute | Description |
|---|---|
| Market Size | Revenue (USD Billion) |
| Market size value in 2023 | USD 100.31 Billion |
| Market size value in 2033 | USD 509.63 Billion |
| CAGR (2024 to 2033) | 17.65% |
| Historical data | 2020-2022 |
| Base Year | 2023 |
| Forecast | 2024-2033 |
| Region | The regions analyzed for the market are Asia Pacific, Europe, South America, North America, and Middle East & Africa. Furthermore, the regions are further analyzed at the country level. |
| Segments | Crop, Method |
Europe region emerged as the largest market for the controlled environment agriculture.
The market's growth will be influenced by focus on increasing food production.
High operational cost is the primary factor restraining the market growth.
Growing government initiatives and demand from pharmaceutical companies will provide lucrative opportunities to the market.
1. Introduction
1.1. Objectives of the Study
1.2. Market Definition
1.3. Research Scope
1.4. Currency
1.5. Key Target Audience
2. Research Methodology and Assumptions
3. Executive Summary
4. Premium Insights
4.1. Porter’s Five Forces Analysis
4.2. Value Chain Analysis
4.3. Top Investment Pockets
4.3.1. Market Attractiveness Analysis By Crop
4.3.2. Market Attractiveness Analysis By Method
4.3.3. Market Attractiveness Analysis By Region
4.4. Industry Trends
5. Market Dynamics
5.1. Market Evaluation
5.2. Drivers
5.2.1. Focus on increasing food production
5.3. Restraints
5.3.1. Operational cost is high
5.4. Opportunities
5.4.1. Advantages of government schemes and demand from pharmaceutical companies
5.5. Challenges
5.5.1. Economic slowdown
6. Global Controlled Environment Agriculture Market Analysis and Forecast, By Crop
6.1. Segment Overview
6.2. Leafy Greens
6.3. Tomato
6.4. Strawberries
6.5. Cucumber
6.6. Pepper
6.7. Cannabis
6.8. Others
7. Global Controlled Environment Agriculture Market Analysis and Forecast, By Method
7.1. Segment Overview
7.2. Hydroponics
7.3. Aquaponics
7.4. Aeroponics
7.5. Others
8. Global Controlled Environment Agriculture Market Analysis and Forecast, By Regional Analysis
8.1. Segment Overview
8.2. North America
8.2.1. U.S.
8.2.2. Canada
8.2.3. Mexico
8.3. Europe
8.3.1. Germany
8.3.2. France
8.3.3. U.K.
8.3.4. Italy
8.3.5. Spain
8.4. Asia-Pacific
8.4.1. Japan
8.4.2. China
8.4.3. India
8.5. South America
8.5.1. Brazil
8.6. Middle East and Africa
8.6.1. UAE
8.6.2. South Africa
9. Global Controlled Environment Agriculture Market-Competitive Landscape
9.1. Overview
9.2. Market Share of Key Players in Global Controlled Environment Agriculture Market
9.2.1. Global Company Market Share
9.2.2. North America Company Market Share
9.2.3. Europe Company Market Share
9.2.4. APAC Company Market Share
9.3. Competitive Situations and Trends
9.3.1. Product Launches and Developments
9.3.2. Partnerships, Collaborations, and Agreements
9.3.3. Mergers & Acquisitions
9.3.4. Expansions
10. Company Profiles
10.1. Aero Farms
10.1.1. Business Overview
10.1.2. Company Snapshot
10.1.3. Company Market Share Analysis
10.1.4. Company Product Portfolio
10.1.5. Recent Developments
10.1.6. SWOT Analysis
10.2. Jingpeng
10.2.1. Business Overview
10.2.2. Company Snapshot
10.2.3. Company Market Share Analysis
10.2.4. Company Product Portfolio
10.2.5. Recent Developments
10.2.6. SWOT Analysis
10.3. Infinite Harvest
10.3.1. Business Overview
10.3.2. Company Snapshot
10.3.3. Company Market Share Analysis
10.3.4. Company Product Portfolio
10.3.5. Recent Developments
10.3.6. SWOT Analysis
10.4. Mirai
10.4.1. Business Overview
10.4.2. Company Snapshot
10.4.3. Company Market Share Analysis
10.4.4. Company Product Portfolio
10.4.5. Recent Developments
10.4.6. SWOT Analysis
10.5. Lufa Farms
10.5.1. Business Overview
10.5.2. Company Snapshot
10.5.3. Company Market Share Analysis
10.5.4. Company Product Portfolio
10.5.5. Recent Developments
10.5.6. SWOT Analysis
10.6. Green Sense Farms
10.6.1. Business Overview
10.6.2. Company Snapshot
10.6.3. Company Market Share Analysis
10.6.4. Company Product Portfolio
10.6.5. Recent Developments
10.6.6. SWOT Analysis
10.7. Metro Farms
10.7.1. Business Overview
10.7.2. Company Snapshot
10.7.3. Company Market Share Analysis
10.7.4. Company Product Portfolio
10.7.5. Recent Developments
10.7.6. SWOT Analysis
10.8. Plenty (Bright Farms)
10.8.1. Business Overview
10.8.2. Company Snapshot
10.8.3. Company Market Share Analysis
10.8.4. Company Product Portfolio
10.8.5. Recent Developments
10.8.6. SWOT Analysis
10.9. Greenland
10.9.1. Business Overview
10.9.2. Company Snapshot
10.9.3. Company Market Share Analysis
10.9.4. Company Product Portfolio
10.9.5. Recent Developments
10.9.6. SWOT Analysis
10.10. Scafil
10.10.1. Business Overview
10.10.2. Company Snapshot
10.10.3. Company Market Share Analysis
10.10.4. Company Product Portfolio
10.10.5. Recent Developments
10.10.6. SWOT Analysis
10.11. Sky Greens
10.11.1. Business Overview
10.11.2. Company Snapshot
10.11.3. Company Market Share Analysis
10.11.4. Company Product Portfolio
10.11.5. Recent Developments
10.11.6. SWOT Analysis
10.12. IDEA Protected Horticulture
10.12.1. Business Overview
10.12.2. Company Snapshot
10.12.3. Company Market Share Analysis
10.12.4. Company Product Portfolio
10.12.5. Recent Developments
10.12.6. SWOT Analysis
10.13. Metropolis Farms
10.13.1. Business Overview
10.13.2. Company Snapshot
10.13.3. Company Market Share Analysis
10.13.4. Company Product Portfolio
10.13.5. Recent Developments
10.13.6. SWOT Analysis
10.14. Gotham Greens
10.14.1. Business Overview
10.14.2. Company Snapshot
10.14.3. Company Market Share Analysis
10.14.4. Company Product Portfolio
10.14.5. Recent Developments
10.14.6. SWOT Analysis
10.15. Garden Fresh Farms
10.15.1. Business Overview
10.15.2. Company Snapshot
10.15.3. Company Market Share Analysis
10.15.4. Company Product Portfolio
10.15.5. Recent Developments
10.15.6. SWOT Analysis
List of Table
1. Global Controlled Environment Agriculture Market, By Crop, 2020-2033 (USD Billion)
2. Global Leafy Greens, Controlled Environment Agriculture Market, By Region, 2020-2033 (USD Billion)
3. Global Tomato, Controlled Environment Agriculture Market, By Region, 2020-2033 (USD Billion)
4. Global Strawberries, Controlled Environment Agriculture Market, By Region, 2020-2033 (USD Billion)
5. Global Cucumber, Controlled Environment Agriculture Market, By Region, 2020-2033 (USD Billion)
6. Global Pepper, Controlled Environment Agriculture Market, By Region, 2020-2033 (USD Billion)
7. Global Cannabis, Controlled Environment Agriculture Market, By Region, 2020-2033 (USD Billion)
8. Global Others, Controlled Environment Agriculture Market, By Region, 2020-2033 (USD Billion)
9. Global Controlled Environment Agriculture Market, By Method, 2020-2033 (USD Billion)
10. Global Hydroponics, Controlled Environment Agriculture Market, By Region, 2020-2033 (USD Billion)
11. Global Aquaponics, Controlled Environment Agriculture Market, By Region, 2020-2033 (USD Billion)
12. Global Aeroponics, Controlled Environment Agriculture Market, By Region, 2020-2033 (USD Billion)
13. Global Others, Controlled Environment Agriculture Market, By Region, 2020-2033 (USD Billion)
14. North America Controlled Environment Agriculture Market, By Crop, 2020-2033 (USD Billion)
15. North America Controlled Environment Agriculture Market, By Method, 2020-2033 (USD Billion)
16. U.S. Controlled Environment Agriculture Market, By Crop, 2020-2033 (USD Billion)
17. U.S. Controlled Environment Agriculture Market, By Method, 2020-2033 (USD Billion)
18. Canada Controlled Environment Agriculture Market, By Crop, 2020-2033 (USD Billion)
19. Canada Controlled Environment Agriculture Market, By Method, 2020-2033 (USD Billion)
20. Mexico Controlled Environment Agriculture Market, By Crop, 2020-2033 (USD Billion)
21. Mexico Controlled Environment Agriculture Market, By Method, 2020-2033 (USD Billion)
22. Europe Controlled Environment Agriculture Market, By Crop, 2020-2033 (USD Billion)
23. Europe Controlled Environment Agriculture Market, By Method, 2020-2033 (USD Billion)
24. Germany Controlled Environment Agriculture Market, By Crop, 2020-2033 (USD Billion)
25. Germany Controlled Environment Agriculture Market, By Method, 2020-2033 (USD Billion)
26. France Controlled Environment Agriculture Market, By Crop, 2020-2033 (USD Billion)
27. France Controlled Environment Agriculture Market, By Method, 2020-2033 (USD Billion)
28. U.K. Controlled Environment Agriculture Market, By Crop, 2020-2033 (USD Billion)
29. U.K. Controlled Environment Agriculture Market, By Method, 2020-2033 (USD Billion)
30. Italy Controlled Environment Agriculture Market, By Crop, 2020-2033 (USD Billion)
31. Italy Controlled Environment Agriculture Market, By Method, 2020-2033 (USD Billion)
32. Spain Controlled Environment Agriculture Market, By Crop, 2020-2033 (USD Billion)
33. Spain Controlled Environment Agriculture Market, By Method, 2020-2033 (USD Billion)
34. Asia Pacific Controlled Environment Agriculture Market, By Crop, 2020-2033 (USD Billion)
35. Asia Pacific Controlled Environment Agriculture Market, By Method, 2020-2033 (USD Billion)
36. Japan Controlled Environment Agriculture Market, By Crop, 2020-2033 (USD Billion)
37. Japan Controlled Environment Agriculture Market, By Method, 2020-2033 (USD Billion)
38. China Controlled Environment Agriculture Market, By Crop, 2020-2033 (USD Billion)
39. China Controlled Environment Agriculture Market, By Method, 2020-2033 (USD Billion)
40. India Controlled Environment Agriculture Market, By Crop, 2020-2033 (USD Billion)
41. India Controlled Environment Agriculture Market, By Method, 2020-2033 (USD Billion)
42. South America Controlled Environment Agriculture Market, By Crop, 2020-2033 (USD Billion)
43. South America Controlled Environment Agriculture Market, By Method, 2020-2033 (USD Billion)
44. Brazil Controlled Environment Agriculture Market, By Crop, 2020-2033 (USD Billion)
45. Brazil Controlled Environment Agriculture Market, By Sales Channel, 2020-2033 (USD Billion)
46. Middle East and Africa Controlled Environment Agriculture Market, By Crop, 2020-2033 (USD Billion)
47. Middle East and Africa Controlled Environment Agriculture Market, By Method, 2020-2033 (USD Billion)
48. UAE Controlled Environment Agriculture Market, By Crop, 2020-2033 (USD Billion)
49. UAE Controlled Environment Agriculture Market, By Method, 2020-2033 (USD Billion)
50. South Africa Controlled Environment Agriculture Market, By Crop, 2020-2033 (USD Billion)
51. South Africa Controlled Environment Agriculture Market, By Method, 2020-2033 (USD Billion)
List of Figures
1. Global Controlled Environment Agriculture Market Segmentation
2. Global Controlled Environment Agriculture Market: Research Methodology
3. Market Size Estimation Methodology: Bottom-Up Approach
4. Market Size Estimation Methodology: Top-Down Approach
5. Data Triangulation
6. Porter’s Five Forces Analysis
7. Value Chain Analysis
8. Global Controlled Environment Agriculture Market Attractiveness Analysis By Crop
9. Global Controlled Environment Agriculture Market Attractiveness Analysis By Method
10. Global Controlled Environment Agriculture Market Attractiveness Analysis By Region
11. Global Controlled Environment Agriculture Market: Dynamics
12. Global Controlled Environment Agriculture Market Share By Crop (2023 & 2033)
13. Global Controlled Environment Agriculture Market Share By Method (2023 & 2033)
14. Global Controlled Environment Agriculture Market Share By Regions (2023 & 2033)
15. Global Controlled Environment Agriculture Market Share By Company (2023)
This study forecasts revenue at global, regional, and country levels from 2020 to 2033. The Brainy Insights has segmented the global controlled environment agriculture market based on below mentioned segments:
Global Controlled Environment Agriculture Market by Crop:
Global Controlled Environment Agriculture Market by Method:
Global Controlled Environment Agriculture by Region:
Research has its special purpose to undertake marketing efficiently. In this competitive scenario, businesses need information across all industry verticals; the information about customer wants, market demand, competition, industry trends, distribution channels etc. This information needs to be updated regularly because businesses operate in a dynamic environment. Our organization, The Brainy Insights incorporates scientific and systematic research procedures in order to get proper market insights and industry analysis for overall business success. The analysis consists of studying the market from a miniscule level wherein we implement statistical tools which helps us in examining the data with accuracy and precision.
Our research reports feature both; quantitative and qualitative aspects for any market. Qualitative information for any market research process are fundamental because they reveal the customer needs and wants, usage and consumption for any product/service related to a specific industry. This in turn aids the marketers/investors in knowing certain perceptions of the customers. Qualitative research can enlighten about the different product concepts and designs along with unique service offering that in turn, helps define marketing problems and generate opportunities. On the other hand, quantitative research engages with the data collection process through interviews, e-mail interactions, surveys and pilot studies. Quantitative aspects for the market research are useful to validate the hypotheses generated during qualitative research method, explore empirical patterns in the data with the help of statistical tools, and finally make the market estimations.
The Brainy Insights offers comprehensive research and analysis, based on a wide assortment of factual insights gained through interviews with CXOs and global experts and secondary data from reliable sources. Our analysts and industry specialist assume vital roles in building up statistical tools and analysis models, which are used to analyse the data and arrive at accurate insights with exceedingly informative research discoveries. The data provided by our organization have proven precious to a diverse range of companies, facilitating them to address issues such as determining which products/services are the most appealing, whether or not customers use the product in the manner anticipated, the purchasing intentions of the market and many others.
Our research methodology encompasses an idyllic combination of primary and secondary initiatives. Key phases involved in this process are listed below:

The phase involves the gathering and collecting of market data and its related information with the help of different sources & research procedures.

The data procurement stage involves in data gathering and collecting through various data sources.
This stage involves in extensive research. These data sources includes:
Purchased Database: Purchased databases play a crucial role in estimating the market sizes irrespective of the domain. Our purchased database includes:
Primary Research: The Brainy Insights interacts with leading companies and experts of the concerned domain to develop the analyst team’s market understanding and expertise. It improves and substantiates every single data presented in the market reports. Primary research mainly involves in telephonic interviews, E-mail interactions and face-to-face interviews with the raw material providers, manufacturers/producers, distributors, & independent consultants. The interviews that we conduct provides valuable data on market size and industry growth trends prevailing in the market. Our organization also conducts surveys with the various industry experts in order to gain overall insights of the industry/market. For instance, in healthcare industry we conduct surveys with the pharmacists, doctors, surgeons and nurses in order to gain insights and key information of a medical product/device/equipment which the customers are going to usage. Surveys are conducted in the form of questionnaire designed by our own analyst team. Surveys plays an important role in primary research because surveys helps us to identify the key target audiences of the market. Additionally, surveys helps to identify the key target audience engaged with the market. Our survey team conducts the survey by targeting the key audience, thus gaining insights from them. Based on the perspectives of the customers, this information is utilized to formulate market strategies. Moreover, market surveys helps us to understand the current competitive situation of the industry. To be precise, our survey process typically involve with the 360 analysis of the market. This analytical process begins by identifying the prospective customers for a product or service related to the market/industry to obtain data on how a product/service could fit into customers’ lives.

Secondary Research: The secondary data sources includes information published by the on-profit organizations such as World bank, WHO, company fillings, investor presentations, annual reports, national government documents, statistical databases, blogs, articles, white papers and others. From the annual report, we analyse a company’s revenue to understand the key segment and market share of that organization in a particular region. We analyse the company websites and adopt the product mapping technique which is important for deriving the segment revenue. In the product mapping method, we select and categorize the products offered by the companies catering to domain specific market, deduce the product revenue for each of the companies so as to get overall estimation of the market size. We also source data and analyses trends based on information received from supply side and demand side intermediaries in the value chain. The supply side denotes the data gathered from supplier, distributor, wholesaler and the demand side illustrates the data gathered from the end customers for respective market domain.

The supply side for a domain specific market is analysed by:
The demand side for the market is estimated through:
In-house Library: Apart from these third-party sources, we have our in-house library of qualitative and quantitative information. Our in-house database includes market data for various industry and domains. These data are updated on regular basis as per the changing market scenario. Our library includes, historic databases, internal audit reports and archives.
Sometimes there are instances where there is no metadata or raw data available for any domain specific market. For those cases, we use our expertise to forecast and estimate the market size in order to generate comprehensive data sets. Our analyst team adopt a robust research technique in order to produce the estimates:
Data Synthesis: This stage involves the analysis & mapping of all the information obtained from the previous step. It also involves in scrutinizing the data for any discrepancy observed while data gathering related to the market. The data is collected with consideration to the heterogeneity of sources. Robust scientific techniques are in place for synthesizing disparate data sets and provide the essential contextual information that can orient market strategies. The Brainy Insights has extensive experience in data synthesis where the data passes through various stages:


Market Deduction & Formulation: The final stage comprises of assigning data points at appropriate market spaces so as to deduce feasible conclusions. Analyst perspective & subject matter expert based holistic form of market sizing coupled with industry analysis also plays a crucial role in this stage.
This stage involves in finalization of the market size and numbers that we have collected from data integration step. With data interpolation, it is made sure that there is no gap in the market data. Successful trend analysis is done by our analysts using extrapolation techniques, which provide the best possible forecasts for the market.
Data Validation & Market Feedback: Validation is the most important step in the process. Validation & re-validation via an intricately designed process helps us finalize data-points to be used for final calculations.

The Brainy Insights interacts with leading companies and experts of the concerned domain to develop the analyst team’s market understanding and expertise. It improves and substantiates every single data presented in the market reports. The data validation interview and discussion panels are typically composed of the most experienced industry members. The participants include, however, are not limited to:
Moreover, we always validate our data and findings through primary respondents from all the major regions we are working on.


Free Customization
Fortune 500 Clients
Free Yearly Update On Purchase Of Multi/Corporate License
Companies Served Till Date