- +1-315-215-1633
- sales@thebrainyinsights.com

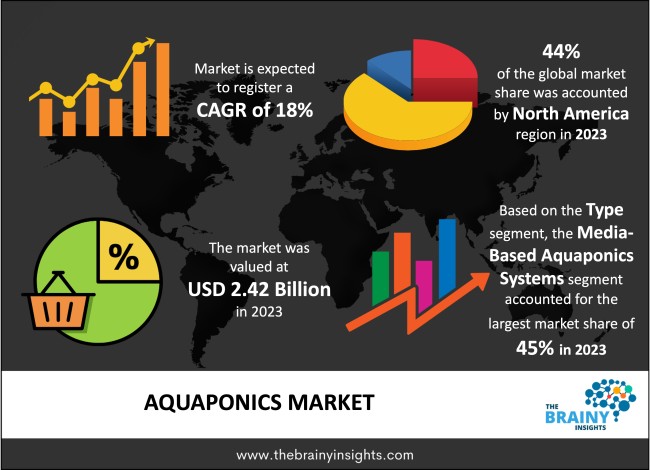
The global Aquaponics market was valued at USD 2.42 billion in 2023 and growing at a CAGR of 18% from 2024 to 2033. The market is expected to reach USD 12.67 billion by 2033. Increasing demand for organic fruits and vegetables, and increased government initiatives to promote Aquaponics globally will potentially drive the growth of the Aquaponics Market. Whereas, rapidly growing consumer demand in the market and increasing partnership agreements and other strategic initiatives by the private players in the market may drive the growth of the Aquaponics Market in the period forecasted.
Aquaponics combines fish farming (aquaculture) with hydroponic plant cultivation. This method enables the simultaneous growth of fish and plants. Nitrifying microorganisms in the water, like rhizobacteria and fungi, convert fish waste into nitrates, which act as nutrients for the plants, fostering their growth. Thus, aquaponics fosters a symbiotic relationship where plants and fish flourish together in a unified system.
Get an overview of this study by requesting a free sample
Increasing demand for organic fruits and vegetables– Food security, encompassing both quantity and quality, has become a growing concern as societal and environmental changes unfold. Technological advancements have facilitated greater access to healthy foods for more populations. By offering communities access to organic foods, growers are contributing to the enhancement of life quality in those areas. The expanding consumer awareness regarding environmental and food safety issues has fueled the growth of organic farming in recent decades. Additionally, the utilization of chemical additives has spurred the adoption of organic products within the food and beverage industries. The increasing demand for organic products is propelled by a growing number of health-conscious consumers. For instance, organic food sales in the US surged by 12.8% in 2020, representing a doubling of the previous year's growth, as reported by the Organic Trade Association.
Limited amount of fish and crops in the global market– Aquaponics offers the capability to cultivate various fish species alongside certain types of vegetables, albeit with limitations in selection. While freshwater and saltwater fish such as tilapia and carp thrive in these systems, the range of compatible vegetables is primarily limited to water-intensive plants like cucumbers. Notably, crops requiring insect pollination are typically omitted from aquaponic setups due to the controlled indoor environment that restricts insect presence. This constraint poses a challenge in effectively cultivating such vegetables indoors through aquaponics.
Rapidly growing consumer demand in the market- The rising disposable income of the global middle class has reshaped consumer spending patterns, particularly evident in increased expenditures on food. This trend has led to a proliferation of restaurants worldwide. Locally produced food is experiencing heightened demand from consumers, with aquaponics playing a pivotal role in sustaining this local and regional consumption model. Consequently, the market for aquaponics is further propelled by this growing trend. Additionally, the pursuit of sustainable farming methods has emerged in response to the adverse impacts of climate change.
The regions analyzed for the market include North America, Europe, South America, Asia Pacific, the Middle East, and Africa. North America emerged as the largest global Aquaponics market, accounting for 44% of the total market. Owing to sustainable farming practices and increased production of organic food in the region. Whereas Asia Pacific exhibits the highest growth rate in the market owing to rapidly growing population coupled with increased disposable income and rising awareness towards healthy lifestyle.
North America Region Aquaponics Market Share in 2023 - 44%
www.thebrainyinsights.com
Check the geographical analysis of this market by requesting a free sample
Media-based aquaponics systems have dominated the market, acquiring 45% of the market share. These systems are widely regarded as the predominant type in the global aquaponics market. These systems utilize various growth media, such as gravel or clay pellets, to support plant growth and provide a biofiltration environment for bacteria that convert fish waste into plant nutrients. On the other hand, Nutrient Film Technique (NFT) aquaponics systems are emerging as the fastest-growing segment. The surge in interest in sustainable agriculture, urban farming initiatives, and the preference for locally sourced produce are driving the rapid growth of NFT aquaponics systems.
The fish segment has dominated the Aquaponics market. Thereby acquiring 45% in the year 2023. Further, it is expected to be the fastest-growing in the market. Owing to the rapidly growing global population, changing lifestyles, and preference towards pescetarianism. Additionally, raising awareness towards healthy lifestyle is another major benefit that has fueled up the growth of the Aquaponics Market in the period forecasted.
| Attribute | Description |
|---|---|
| Market Size | Revenue (USD Billion) |
| Market size value in 2023 | USD 2.42 Billion |
| Market size value in 2033 | USD 12.67 Billion |
| CAGR (2024 to 2033) | 18% |
| Historical data | 2020-2022 |
| Base Year | 2023 |
| Forecast | 2024-2033 |
| Region | The regions analyzed for the market are Asia Pacific, Europe, South America, North America, and Middle East & Africa. Furthermore, the regions are further analyzed at the country level. |
| Segments | Type, Application |
As per The Brainy Insights, the size of the aquaponics market was valued at USD 2.42 billion in 2023 to USD 12.67 billion by 2033.
The global aquaponics market is growing at a CAGR of 18% during the forecast period 2024-2033.
The North America region emerged as the largest market for the aquaponics.
The increasing demand for organic fruits and vegetables will influence the market's growth.
1. Introduction
1.1. Objectives of the Study
1.2. Market Definition
1.3. Research Scope
1.4. Currency
1.5. Key Target Audience
2. Research Methodology and Assumptions
3. Executive Summary
4. Premium Insights
4.1. Porter’s Five Forces Analysis
4.2. Value Chain Analysis
4.3. Top Investment Pockets
4.3.1. Market Attractiveness Analysis by Type
4.3.2. Market Attractiveness Analysis by Application
4.3.3. Market Attractiveness Analysis by Region
4.4. Industry Trends
5. Market Dynamics
5.1. Market Evaluation
5.2. Drivers
5.2.1. Increasing demand for organic fruits and vegetables
5.2.2. Increased government initiatives to promote Aquaponics globally
5.3. Restraints
5.3.1. Limited amount of fish and crops in the global market
5.4. Opportunities
5.4.1. Rapidly growing consumer demand in the market
5.4.2. Increasing partnership agreements and other strategic initiatives by the private players in the market
5.5. Challenges
5.5.1. Increasing need to maintain water quality
6. Global Aquaponics Market Analysis and Forecast, By Type
6.1. Segment Overview
6.2. Media-based Aquaponics Systems
6.3. Nutrient Film Technique (NFT) Aquaponics Systems
7. Global Aquaponics Market Analysis and Forecast, By Application
7.1. Segment Overview
7.2. Fish
7.3. Vegetables
7.4. Herbs
7.5. Fruits
8. Global Aquaponics Market Analysis and Forecast, By Regional Analysis
8.1. Segment Overview
8.2. North America
8.2.1. U.S.
8.2.2. Canada
8.2.3. Mexico
8.3. Europe
8.3.1. Germany
8.3.2. France
8.3.3. U.K.
8.3.4. Italy
8.3.5. Spain
8.4. Asia-Pacific
8.4.1. Japan
8.4.2. China
8.4.3. India
8.5. South America
8.5.1. Brazil
8.6. Middle East and Africa
8.6.1. UAE
8.6.2. South Africa
9. Global Aquaponics Market-Competitive Landscape
9.1. Overview
9.2. Market Share of Key Players in Global Aquaponics Market
9.2.1. Global Company Market Share
9.2.2. North America Company Market Share
9.2.3. Europe Company Market Share
9.2.4. APAC Company Market Share
9.3. Competitive Situations and Trends
9.3.1. Product Launches and Developments
9.3.2. Partnerships, Collaborations, and Agreements
9.3.3. Mergers & Acquisitions
9.3.4. Expansions
10. Company Profiles
10.1. Aponic Ltd
10.1.1. Business Overview
10.1.2. Company Snapshot
10.1.3. Company Market Share Analysis
10.1.4. Company Product Portfolio
10.1.5. Recent Developments
10.1.6. SWOT Analysis
10.2. Aquaponic Lynx LLC
10.2.1. Business Overview
10.2.2. Company Snapshot
10.2.3. Company Market Share Analysis
10.2.4. Company Product Portfolio
10.2.5. Recent Developments
10.2.6. SWOT Analysis
10.3. Aquaponics
10.3.1. Business Overview
10.3.2. Company Snapshot
10.3.3. Company Market Share Analysis
10.3.4. Company Product Portfolio
10.3.5. Recent Developments
10.3.6. SWOT Analysis
10.4. Aquaponik Manufactory GmbH
10.4.1. Business Overview
10.4.2. Company Snapshot
10.4.3. Company Market Share Analysis
10.4.4. Company Product Portfolio
10.4.5. Recent Developments
10.4.6. SWOT Analysis
10.5. Backyard Aquaponics Pty Ltd
10.5.1. Business Overview
10.5.2. Company Snapshot
10.5.3. Company Market Share Analysis
10.5.4. Company Product Portfolio
10.5.5. Recent Developments
10.5.6. SWOT Analysis
10.6. Hapa Farms
10.6.1. Business Overview
10.6.2. Company Snapshot
10.6.3. Company Market Share Analysis
10.6.4. Company Product Portfolio
10.6.5. Recent Developments
10.6.6. SWOT Analysis
10.7. Hydrofarm Holdings Group Inc
10.7.1. Business Overview
10.7.2. Company Snapshot
10.7.3. Company Market Share Analysis
10.7.4. Company Product Portfolio
10.7.5. Recent Developments
10.7.6. SWOT Analysis
10.8. LivinGreen
10.8.1. Business Overview
10.8.2. Company Snapshot
10.8.3. Company Market Share Analysis
10.8.4. Company Product Portfolio
10.8.5. Recent Developments
10.8.6. SWOT Analysis
10.9. My Aquaponics
10.9.1. Business Overview
10.9.2. Company Snapshot
10.9.3. Company Market Share Analysis
10.9.4. Company Product Portfolio
10.9.5. Recent Developments
10.9.6. SWOT Analysis
10.10. Nelson and Pade Aquaponics
10.10.1. Business Overview
10.10.2. Company Snapshot
10.10.3. Company Market Share Analysis
10.10.4. Company Product Portfolio
10.10.5. Recent Developments
10.10.6. SWOT Analysis
List of Table
1. Global Aquaponics Market, By Type, 2020-2033 (USD Billion)
2. Global Media-based Aquaponics Systems, Aquaponics Market, By Region, 2020-2033 (USD Billion)
3. Global Nutrient Film Technique (NFT) Aquaponics Systems, Aquaponics Market, By Region, 2020-2033 (USD Billion)
4. Global Aquaponics Market, By Application, 2020-2033 (USD Billion)
5. Global Fish, Aquaponics Market, By Region, 2020-2033 (USD Billion)
6. Global Vegetables, Aquaponics Market, By Region, 2020-2033 (USD Billion)
7. Global Herbs, Aquaponics Market, By Region, 2020-2033 (USD Billion)
8. Global Fruits, Aquaponics Market, By Region, 2020-2033 (USD Billion)
9. Global Aquaponics Market, By Region, 2020-2033 (USD Billion)
10. North America Aquaponics Market, By Type, 2020-2033 (USD Billion)
11. North America Aquaponics Market, By Application, 2020-2033 (USD Billion)
12. U.S. Aquaponics Market, By Type, 2020-2033 (USD Billion)
13. U.S. Aquaponics Market, By Application, 2020-2033 (USD Billion)
14. Canada Aquaponics Market, By Type, 2020-2033 (USD Billion)
15. Canada Aquaponics Market, By Application, 2020-2033 (USD Billion)
16. Mexico Aquaponics Market, By Type, 2020-2033 (USD Billion)
17. Mexico Aquaponics Market, By Application, 2020-2033 (USD Billion)
18. Europe Aquaponics Market, By Type, 2020-2033 (USD Billion)
19. Europe Aquaponics Market, By Application, 2020-2033 (USD Billion)
20. Germany Aquaponics Market, By Type, 2020-2033 (USD Billion)
21. Germany Aquaponics Market, By Application, 2020-2033 (USD Billion)
22. France Aquaponics Market, By Type, 2020-2033 (USD Billion)
23. France Aquaponics Market, By Application, 2020-2033 (USD Billion)
24. U.K. Aquaponics Market, By Type, 2020-2033 (USD Billion)
25. U.K. Aquaponics Market, By Application, 2020-2033 (USD Billion)
26. Italy Aquaponics Market, By Type, 2020-2033 (USD Billion)
27. Italy Aquaponics Market, By Application, 2020-2033 (USD Billion)
28. Spain Aquaponics Market, By Type, 2020-2033 (USD Billion)
29. Spain Aquaponics Market, By Application, 2020-2033 (USD Billion)
30. Asia Pacific Aquaponics Market, By Type, 2020-2033 (USD Billion)
31. Asia Pacific Aquaponics Market, By Application, 2020-2033 (USD Billion)
32. Japan Aquaponics Market, By Type, 2020-2033 (USD Billion)
33. Japan Aquaponics Market, By Application, 2020-2033 (USD Billion)
34. China Aquaponics Market, By Type, 2020-2033 (USD Billion)
35. China Aquaponics Market, By Application, 2020-2033 (USD Billion)
36. India Aquaponics Market, By Type, 2020-2033 (USD Billion)
37. India Aquaponics Market, By Application, 2020-2033 (USD Billion)
38. South America Aquaponics Market, By Type, 2020-2033 (USD Billion)
39. South America Aquaponics Market, By Application, 2020-2033 (USD Billion)
40. Brazil Aquaponics Market, By Type, 2020-2033 (USD Billion)
41. Brazil Aquaponics Market, By Application, 2020-2033 (USD Billion)
42. Middle East and Africa Aquaponics Market, By Type, 2020-2033 (USD Billion)
43. Middle East and Africa Aquaponics Market, By Application, 2020-2033 (USD Billion)
44. UAE Aquaponics Market, By Type, 2020-2033 (USD Billion)
45. UAE Aquaponics Market, By Application, 2020-2033 (USD Billion)
46. South Africa Aquaponics Market, By Type, 2020-2033 (USD Billion)
47. South Africa Aquaponics Market, By Application, 2020-2033 (USD Billion)
List of Figures
1. Global Aquaponics Market Segmentation
2. Global Aquaponics Market: Research Methodology
3. Market Size Estimation Methodology: Bottom-Up Approach
4. Market Size Estimation Methodology: Top-Down Approach
5. Data Triangulation
6. Porter’s Five Forces Analysis
7. Value Chain Analysis
8. Global Aquaponics Market Attractiveness Analysis by Type
9. Global Aquaponics Market Attractiveness Analysis by Application
10. Global Aquaponics Market Attractiveness Analysis by Region
11. Global Aquaponics Market: Dynamics
12. Global Aquaponics Market Share by Type (2023 & 2033)
13. Global Aquaponics Market Share by Application (2023 & 2033)
14. Global Aquaponics Market Share by Regions (2023 & 2033)
15. Global Aquaponics Market Share by Company (2023)
This study forecasts revenue at global, regional, and country levels from 2020 to 2033. The Brainy Insights has segmented the global aquaponics market based on below-mentioned segments:
Global Aquaponics Market by Type:
Global Aquaponics Market by Application:
Global Aquaponics Market by Region:
Research has its special purpose to undertake marketing efficiently. In this competitive scenario, businesses need information across all industry verticals; the information about customer wants, market demand, competition, industry trends, distribution channels etc. This information needs to be updated regularly because businesses operate in a dynamic environment. Our organization, The Brainy Insights incorporates scientific and systematic research procedures in order to get proper market insights and industry analysis for overall business success. The analysis consists of studying the market from a miniscule level wherein we implement statistical tools which helps us in examining the data with accuracy and precision.
Our research reports feature both; quantitative and qualitative aspects for any market. Qualitative information for any market research process are fundamental because they reveal the customer needs and wants, usage and consumption for any product/service related to a specific industry. This in turn aids the marketers/investors in knowing certain perceptions of the customers. Qualitative research can enlighten about the different product concepts and designs along with unique service offering that in turn, helps define marketing problems and generate opportunities. On the other hand, quantitative research engages with the data collection process through interviews, e-mail interactions, surveys and pilot studies. Quantitative aspects for the market research are useful to validate the hypotheses generated during qualitative research method, explore empirical patterns in the data with the help of statistical tools, and finally make the market estimations.
The Brainy Insights offers comprehensive research and analysis, based on a wide assortment of factual insights gained through interviews with CXOs and global experts and secondary data from reliable sources. Our analysts and industry specialist assume vital roles in building up statistical tools and analysis models, which are used to analyse the data and arrive at accurate insights with exceedingly informative research discoveries. The data provided by our organization have proven precious to a diverse range of companies, facilitating them to address issues such as determining which products/services are the most appealing, whether or not customers use the product in the manner anticipated, the purchasing intentions of the market and many others.
Our research methodology encompasses an idyllic combination of primary and secondary initiatives. Key phases involved in this process are listed below:

The phase involves the gathering and collecting of market data and its related information with the help of different sources & research procedures.

The data procurement stage involves in data gathering and collecting through various data sources.
This stage involves in extensive research. These data sources includes:
Purchased Database: Purchased databases play a crucial role in estimating the market sizes irrespective of the domain. Our purchased database includes:
Primary Research: The Brainy Insights interacts with leading companies and experts of the concerned domain to develop the analyst team’s market understanding and expertise. It improves and substantiates every single data presented in the market reports. Primary research mainly involves in telephonic interviews, E-mail interactions and face-to-face interviews with the raw material providers, manufacturers/producers, distributors, & independent consultants. The interviews that we conduct provides valuable data on market size and industry growth trends prevailing in the market. Our organization also conducts surveys with the various industry experts in order to gain overall insights of the industry/market. For instance, in healthcare industry we conduct surveys with the pharmacists, doctors, surgeons and nurses in order to gain insights and key information of a medical product/device/equipment which the customers are going to usage. Surveys are conducted in the form of questionnaire designed by our own analyst team. Surveys plays an important role in primary research because surveys helps us to identify the key target audiences of the market. Additionally, surveys helps to identify the key target audience engaged with the market. Our survey team conducts the survey by targeting the key audience, thus gaining insights from them. Based on the perspectives of the customers, this information is utilized to formulate market strategies. Moreover, market surveys helps us to understand the current competitive situation of the industry. To be precise, our survey process typically involve with the 360 analysis of the market. This analytical process begins by identifying the prospective customers for a product or service related to the market/industry to obtain data on how a product/service could fit into customers’ lives.

Secondary Research: The secondary data sources includes information published by the on-profit organizations such as World bank, WHO, company fillings, investor presentations, annual reports, national government documents, statistical databases, blogs, articles, white papers and others. From the annual report, we analyse a company’s revenue to understand the key segment and market share of that organization in a particular region. We analyse the company websites and adopt the product mapping technique which is important for deriving the segment revenue. In the product mapping method, we select and categorize the products offered by the companies catering to domain specific market, deduce the product revenue for each of the companies so as to get overall estimation of the market size. We also source data and analyses trends based on information received from supply side and demand side intermediaries in the value chain. The supply side denotes the data gathered from supplier, distributor, wholesaler and the demand side illustrates the data gathered from the end customers for respective market domain.

The supply side for a domain specific market is analysed by:
The demand side for the market is estimated through:
In-house Library: Apart from these third-party sources, we have our in-house library of qualitative and quantitative information. Our in-house database includes market data for various industry and domains. These data are updated on regular basis as per the changing market scenario. Our library includes, historic databases, internal audit reports and archives.
Sometimes there are instances where there is no metadata or raw data available for any domain specific market. For those cases, we use our expertise to forecast and estimate the market size in order to generate comprehensive data sets. Our analyst team adopt a robust research technique in order to produce the estimates:
Data Synthesis: This stage involves the analysis & mapping of all the information obtained from the previous step. It also involves in scrutinizing the data for any discrepancy observed while data gathering related to the market. The data is collected with consideration to the heterogeneity of sources. Robust scientific techniques are in place for synthesizing disparate data sets and provide the essential contextual information that can orient market strategies. The Brainy Insights has extensive experience in data synthesis where the data passes through various stages:


Market Deduction & Formulation: The final stage comprises of assigning data points at appropriate market spaces so as to deduce feasible conclusions. Analyst perspective & subject matter expert based holistic form of market sizing coupled with industry analysis also plays a crucial role in this stage.
This stage involves in finalization of the market size and numbers that we have collected from data integration step. With data interpolation, it is made sure that there is no gap in the market data. Successful trend analysis is done by our analysts using extrapolation techniques, which provide the best possible forecasts for the market.
Data Validation & Market Feedback: Validation is the most important step in the process. Validation & re-validation via an intricately designed process helps us finalize data-points to be used for final calculations.

The Brainy Insights interacts with leading companies and experts of the concerned domain to develop the analyst team’s market understanding and expertise. It improves and substantiates every single data presented in the market reports. The data validation interview and discussion panels are typically composed of the most experienced industry members. The participants include, however, are not limited to:
Moreover, we always validate our data and findings through primary respondents from all the major regions we are working on.


Free Customization
Fortune 500 Clients
Free Yearly Update On Purchase Of Multi/Corporate License
Companies Served Till Date