- +1-315-215-1633
- sales@thebrainyinsights.com

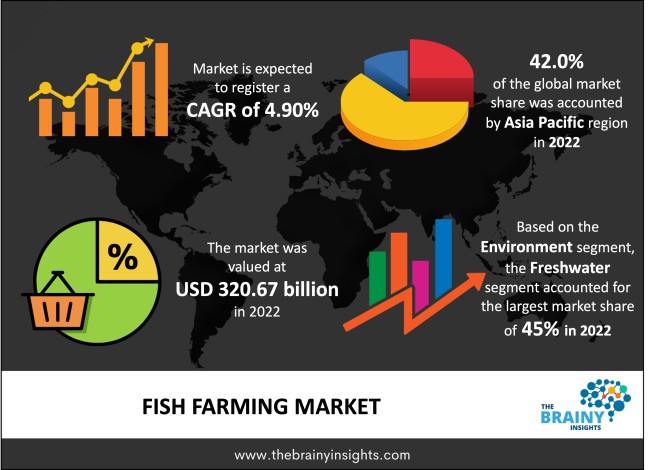
The global fish farming market was valued at USD 320.67 billion in 2022 and growing at a CAGR of 4.9% from 2023 to 2032. The market is expected to reach USD 517.38 billion by 2032. One sort of aquaculture is fish farming, where fishes are grown in controlled conditions to be sold as food. Cultivating fish species, called pisciculturе, is cultivating, producing, and growing fish. Fish farming is the technique/method of economically breeding fish in ponds, tanks or other enclosures. Fish farming does increase fish production, thereby playing a huge role in global food production. Fish farming is considered a crucial means to address the issue of overfishing. Fish is a common cultural tradition among many people. Fats, omega-3 fatty acids, vitamins, protein, minerals, and other vital nutrients are present in fish. The presence of these vital nutrients makes fish an important food for consumption. The increasing demand for, mainly in developing and emerging nations, is the primary market growth and development factor.
Fish farming has a rich and varied history spanning many nations and geographical areas. Carp were raised in ponds as early as 3000 BCE in ancient China, where it is thought to have started. The practice of fish farming eventually made its way from China to Europe, the Middle East, and the entire world. Modern aquaculture results from decades of substantial advantages in fish farming knowledge and practices. The background of fish farming provides an understanding of the industry's evolution and cultural importance. Fish farming is considered a еssеntial practice in the modern day because fish farming largely contributes to the security of the global food supply. The еvеr-incrеasing global population has raised the demand for foods high in nutrients such as protein. Fish is a rich and nutritious source of protein, other important nutrients, and fatty acids. Fish farming depends on protecting wild fish populations to mееt thе еxponеntial demand, many of which arе еndangеrеd or in danger of extinction. Furthermore, fish farming improves livelihoods and fosters economic growth, especially in rural areas.
Get an overview of this study by requesting a free sample
Rising Demand for Seafood- The market for fish farming is mostly driven by the rising demand for seafood worldwide. With the increasing global population and changing diet choices, there is a growing need for fish as a protein and important nutritional source. Fish farming is an essential source of seafood because traditional fishing techniques cannot fulfil this need. Additionally, there has been a significant rise in the population of people who have Alzheimer's disease. Recently, about 55 million individuals globally have dementia, with more than 60% living in low- and middle-income nations, as per the World Health Organization (WHO) data. There are around 10 million new cases annually. A wide range of brain traumas and illnesses can cause dementia. As the most prevalent type of dementia, Alzheimer's disability may be a factor in 60–70% of cases. Fish is advised for people who have Alzheimer's disease because the consumption of fish has many health benefits. A more inferior risk of Alzheimer's disease has been related to moderate consumption of seafood, such as fish, according to the Journal of the American Medical Association. This factor is boosting the market growth and development.
Disease Outbreaks- Disease outbreaks are one of the fish farming industry's biggest problems. Fish raised in cramped quarters are susceptible to illnesses that can cause significant losses. Environmental factors, viruses, bacteria, and parasites can all cause disease. For example, illnesses like Whitе Spot Syndromе Virus (WSSV) and Infectious Salmon Anaеmia (ISA) have devastated prawn and salmon farms, resulting in significant financial losses. Additionally, maintaining the water quality also presents a significant restraint to the market growth. Fish raised for food must have their water quality maintained at its ideal level to thrive. Kееping waste products under control, preventing the spread of illness, and maintaining appropriate oxygen levels are challenges associated with regulating water quality. The difficulties are more apparent in intensive aquaculture systems, where fish are raised at large distances. These factors are limiting the market growth and development.
Technological Advancements- The effective use of automation and sensor technologies in fish farming is one of the most noteworthy technological developments. Combined with cutting-edge sensors, automated feeding systems enable fish farmers to monitor and control feeding schedules precisely. These systems can modify feeding based on fish behaviour, oxygen levels, and water temperature. This factor lowers labour costs while simultaneously increasing fish growth and feeding efficiency. Circulating aquaculture systems (RAS) constitute a revolutionary technological breakthrough in fish farming. These closed-loop systems significantly reduce water use and waste by recycling and treating water. Fish farming in arable land without access to water bodies is made possible by RAS, which permits the practice in land-based facilities. This technology represents a major advance in fish farming that is ecologically conscious and sustainable. These factors are anticipated to provide lucrative market growth opportunities in upcoming years.
The regions analyzed for the market include Europe, North America, South America, Asia Pacific, and Middle East & Africa. Asia Pacific emerged as the largest market for the global fish farming market, with a 42.0% share of the market revenue in 2022. Fish farming is very feasible with so many developing countries in the Asia-Pacific region and their abundant water resources. Fish farming is expanding quickly in nations like Vietnam, China, and Indonesia due to rising per capita disposable income and the interest of large aquaculture company’s piqued by low labor costs and government backing. Additionally, the Asia-Pacific market is driven by sociological factors such as customary fish-consuming practices, economic growth, and population growth. Additionally, the regional market players are engaging in various technological advancements to maintain their competitive edge.
Asia Pacific Region Fish Farming Market Share in 2022 - 42.0%
www.thebrainyinsights.com
Check the geographical analysis of this market by requesting a free sample
The environment segment is divided into marine water, fresh water and brackish water. The freshwater segment dominated the market, with a market share of around 45% in 2022. In addition to freshwater found in aquifers and underground streams, freshwater is found naturally on the earth's surface through ice shelves, glaciers, icebergs, bogs, ponds, lakes, rivers, and streams. The most prevalent fish species in freshwater ecosystems are carp, tilapia and salmon. About 95% of freshwater fish farming worldwide is concentrated in China, making it the dominant country in this sector. The nation that cultivates carp the most produces large amounts of tilapia, catfish, and other species. Several nations, such as Bangladesh, Thailand, and China, have fisheries policies that control aquaculture and fish farms.
The fish type segment is divided into salmon, shellfish, tuna, tilapia and others. The tilapia segment dominated the market, with a market share of around 38% in 2022. A common freshwater fish species in the world's fish farming industry, tilapia is prized for its mild flavor and adaptability to various culinary preparations. Growing tilapia is common in areas with an abundance of freshwater resources. Resource efficiency and sustainability are prioritized in tilapia farming. Species is a desirable choice for sustainable fish farming because of its good fееd conversion and reputation for having few positive effects on the environment. In many emerging nations, tilapia farming provides a substantial economic boost. Food security and popularity in these places directly relate to the industry's development.
| Attribute | Description |
|---|---|
| Market Size | Revenue (USD Billion) |
| Market size value in 2022 | USD 320.67 Billion |
| Market size value in 2032 | USD 517.38 Billion |
| CAGR (2023 to 2032) | 4.9% |
| Historical data | 2019-2021 |
| Base Year | 2022 |
| Forecast | 2023-2032 |
| Region | The regions analyzed for the market are Asia Pacific, Europe, South America, North America, and Middle East & Africa. Furthermore, the regions are further analyzed at the country level. |
| Segments | Environment, Fish Type |
As per The Brainy Insights, the size of the global fish farming market was valued at USD 320.67 Billion in 2022 to USD 517.38 Billion by 2032.
The global fish farming market is growing at a CAGR of 4.9% during the forecast period 2023-2032.
The market's growth will be influenced by the rising demand for seafood across developed and developing nations.
The climate change caused by global warming hamper the market growth.
1. INTRODUCTION
1.1. OBJECTIVES OF THE STUDY
1.2. MARKET DEFINITION
1.3. RESEARCH SCOPE
1.4. CURRENCY
1.5. KEY TARGET AUDIENCE
2. RESEARCH METHODOLOGY AND ASSUMPTIONS
3. EXECUTIVE SUMMARY
4. PREMIUM INSIGHTS
4.1. PORTER’S FIVE FORCES ANALYSIS
4.2. VALUE CHAIN ANALYSIS
4.3. TOP INVESTMENT POCKETS
4.3.1. MARKET ATTRACTIVENESS ANALYSIS BY FISH TYPE
4.3.2. MARKET ATTRACTIVENESS ANALYSIS BY ENVIRONMENT
4.3.3. MARKET ATTRACTIVENESS ANALYSIS BY REGION
4.4. INDUSTRY TRENDS
5. MARKET DYNAMICS
5.1. MARKET EVALUATION
5.2. DRIVERS
5.2.1. RISING DEMAND FOR SEAFOOD
5.3. RESTRAINTS
5.3.1. VOLATILITY IN RAW MATERIAL PRICES
5.4. OPPORTUNITIES
5.4.1. TECHNOLOGICAL ADVANCEMENTS
6. GLOBAL FISH FARMING MARKET ANALYSIS AND FORECAST, BY FISH TYPE
6.1. SEGMENT OVERVIEW
6.2. SALMON
6.3. SHELLFISH
6.4. TUNA
6.5. TILAPIA
6.6. OTHERS
7. GLOBAL FISH FARMING MARKET ANALYSIS AND FORECAST, BY ENVIRONMENT
7.1. SEGMENT OVERVIEW
7.2. FRESHWATER
7.3. BRACKISH WATER
7.4. MARINE WATER
8. GLOBAL FISH FARMING MARKET ANALYSIS AND FORECAST, BY REGIONAL ANALYSIS
8.1. SEGMENT OVERVIEW
8.2. NORTH AMERICA
8.2.1. U.S.
8.2.2. CANADA
8.2.3. MEXICO
8.3. EUROPE
8.3.1. GERMANY
8.3.2. FRANCE
8.3.3. U.K.
8.3.4. ITALY
8.3.5. SPAIN
8.4. ASIA-PACIFIC
8.4.1. JAPAN
8.4.2. CHINA
8.4.3. INDIA
8.5. SOUTH AMERICA
8.5.1. BRAZIL
8.6. MIDDLE EAST AND AFRICA
8.6.1. UAE
8.6.2. SOUTH AFRICA
9. GLOBAL FISH FARMING MARKET-COMPETITIVE LANDSCAPE
9.1. OVERVIEW
9.2. MARKET SHARE OF KEY PLAYERS IN THE FISH FARMING MARKET
9.2.1. GLOBAL COMPANY MARKET SHARE
9.2.2. NORTH AMERICA COMPANY MARKET SHARE
9.2.3. EUROPE COMPANY MARKET SHARE
9.2.4. APAC COMPANY MARKET SHARE
9.3. COMPETITIVE SITUATIONS AND TRENDS
9.3.1. PRODUCT LAUNCHES AND DEVELOPMENTS
9.3.2. PARTNERSHIPS, COLLABORATIONS, AND AGREEMENTS
9.3.3. MERGERS & ACQUISITIONS
9.3.4. EXPANSIONS
10. COMPANY PROFILES
10.1. MOWI ASA
10.1.1. BUSINESS OVERVIEW
10.1.2. COMPANY SNAPSHOT
10.1.3. COMPANY MARKET SHARE ANALYSIS
10.1.4. COMPANY PRODUCT PORTFOLIO
10.1.5. RECENT DEVELOPMENTS
10.1.6. SWOT ANALYSIS
10.2. COOKE AQUACULTURE INC.
10.2.1. BUSINESS OVERVIEW
10.2.2. COMPANY SNAPSHOT
10.2.3. COMPANY MARKET SHARE ANALYSIS
10.2.4. COMPANY PRODUCT PORTFOLIO
10.2.5. RECENT DEVELOPMENTS
10.2.6. SWOT ANALYSIS
10.3. ALPHA GROUP
10.3.1. BUSINESS OVERVIEW
10.3.2. COMPANY SNAPSHOT
10.3.3. COMPANY MARKET SHARE ANALYSIS
10.3.4. COMPANY PRODUCT PORTFOLIO
10.3.5. RECENT DEVELOPMENTS
10.3.6. SWOT ANALYSIS
10.4. LEROY SEAFOOD GROUP
10.4.1. BUSINESS OVERVIEW
10.4.2. COMPANY SNAPSHOT
10.4.3. COMPANY MARKET SHARE ANALYSIS
10.4.4. COMPANY PRODUCT PORTFOLIO
10.4.5. RECENT DEVELOPMENTS
10.4.6. SWOT ANALYSIS
10.5. THAI UNION GROUP PCL
10.5.1. BUSINESS OVERVIEW
10.5.2. COMPANY SNAPSHOT
10.5.3. COMPANY MARKET SHARE ANALYSIS
10.5.4. COMPANY PRODUCT PORTFOLIO
10.5.5. RECENT DEVELOPMENTS
10.5.6. SWOT ANALYSIS
10.6. STOLT SEA FARM
10.6.1. BUSINESS OVERVIEW
10.6.2. COMPANY SNAPSHOT
10.6.3. COMPANY MARKET SHARE ANALYSIS
10.6.4. COMPANY PRODUCT PORTFOLIO
10.6.5. RECENT DEVELOPMENTS
10.6.6. SWOT ANALYSIS
10.7. SELONDA AQUACULTURE SA
10.7.1. BUSINESS OVERVIEW
10.7.2. COMPANY SNAPSHOT
10.7.3. COMPANY MARKET SHARE ANALYSIS
10.7.4. COMPANY PRODUCT PORTFOLIO
10.7.5. RECENT DEVELOPMENTS
10.7.6. SWOT ANALYSIS
10.8. BLUE RIDGE AQUACULTURE
10.8.1. BUSINESS OVERVIEW
10.8.2. COMPANY SNAPSHOT
10.8.3. COMPANY MARKET SHARE ANALYSIS
10.8.4. COMPANY PRODUCT PORTFOLIO
10.8.5. RECENT DEVELOPMENTS
10.8.6. SWOT ANALYSIS
10.9. MARINE HARVEST ASA
10.9.1. BUSINESS OVERVIEW
10.9.2. COMPANY SNAPSHOT
10.9.3. COMPANY MARKET SHARE ANALYSIS
10.9.4. COMPANY PRODUCT PORTFOLIO
10.9.5. RECENT DEVELOPMENTS
10.9.6. SWOT ANALYSIS
10.10. NIREUS AQUACULTURE S.A.
10.10.1. BUSINESS OVERVIEW
10.10.2. COMPANY SNAPSHOT
10.10.3. COMPANY MARKET SHARE ANALYSIS
10.10.4. COMPANY PRODUCT PORTFOLIO
10.10.5. RECENT DEVELOPMENTS
10.10.6. SWOT ANALYSIS
List of Table
1. GLOBAL FISH FARMING MARKET, BY FISH TYPE, 2019-2032 (USD BILLION)
2. GLOBAL SALMON FISH FARMING MARKET, BY REGION, 2019-2032 (USD BILLION)
3. GLOBAL SHELLFISH FISH FARMING MARKET, BY REGION, 2019-2032 (USD BILLION)
4. GLOBAL TUNA FISH FARMING MARKET, BY REGION, 2019-2032 (USD BILLION)
5. GLOBAL TILAPIA FISH FARMING MARKET, BY REGION, 2019-2032 (USD BILLION)
6. GLOBAL OTHERS FISH FARMING MARKET, BY REGION, 2019-2032 (USD BILLION)
7. GLOBAL FISH FARMING MARKET, BY ENVIRONMENT, 2019-2032 (USD BILLION)
8. GLOBAL FRESHWATER FISH FARMING MARKET, BY REGION, 2019-2032 (USD BILLION)
9. GLOBAL BRACKISH WATER FISH FARMING MARKET, BY REGION, 2019-2032 (USD BILLION)
10. GLOBAL MARINE WATER FISH FARMING MARKET, BY REGION, 2019-2032 (USD BILLION)
11. GLOBAL FISH FARMING MARKET, BY REGION, 2019-2032 (USD BILLION)
12. NORTH AMERICA FISH FARMING MARKET, BY FISH TYPE, 2019-2032 (USD BILLION)
13. NORTH AMERICA FISH FARMING MARKET, BY ENVIRONMENT, 2019-2032 (USD BILLION)
14. U.S. FISH FARMING MARKET, BY FISH TYPE, 2019-2032 (USD BILLION)
15. U.S. FISH FARMING MARKET, BY ENVIRONMENT, 2019-2032 (USD BILLION)
16. CANADA FISH FARMING MARKET, BY FISH TYPE, 2019-2032 (USD BILLION)
17. CANADA FISH FARMING MARKET, BY ENVIRONMENT, 2019-2032 (USD BILLION)
18. MEXICO FISH FARMING MARKET, BY FISH TYPE, 2019-2032 (USD BILLION)
19. MEXICO FISH FARMING MARKET, BY ENVIRONMENT, 2019-2032 (USD BILLION)
20. EUROPE FISH FARMING MARKET, BY FISH TYPE, 2019-2032 (USD BILLION)
21. EUROPE FISH FARMING MARKET, BY ENVIRONMENT, 2019-2032 (USD BILLION)
22. GERMANY FISH FARMING MARKET, BY FISH TYPE, 2019-2032 (USD BILLION)
23. GERMANY FISH FARMING MARKET, BY ENVIRONMENT, 2019-2032 (USD BILLION)
24. FRANCE FISH FARMING MARKET, BY FISH TYPE, 2019-2032 (USD BILLION)
25. FRANCE FISH FARMING MARKET, BY ENVIRONMENT, 2019-2032 (USD BILLION)
26. U.K. FISH FARMING MARKET, BY FISH TYPE, 2019-2032 (USD BILLION)
27. U.K. FISH FARMING MARKET, BY ENVIRONMENT, 2019-2032 (USD BILLION)
28. ITALY FISH FARMING MARKET, BY FISH TYPE, 2019-2032 (USD BILLION)
29. ITALY FISH FARMING MARKET, BY ENVIRONMENT, 2019-2032 (USD BILLION)
30. SPAIN FISH FARMING MARKET, BY FISH TYPE, 2019-2032 (USD BILLION)
31. SPAIN FISH FARMING MARKET, BY ENVIRONMENT, 2019-2032 (USD BILLION)
32. ASIA PACIFIC FISH FARMING MARKET, BY FISH TYPE, 2019-2032 (USD BILLION)
33. ASIA PACIFIC FISH FARMING MARKET, BY ENVIRONMENT, 2019-2032 (USD BILLION)
34. JAPAN FISH FARMING MARKET, BY FISH TYPE, 2019-2032 (USD BILLION)
35. JAPAN FISH FARMING MARKET, BY ENVIRONMENT, 2019-2032 (USD BILLION)
36. CHINA FISH FARMING MARKET, BY FISH TYPE, 2019-2032 (USD BILLION)
37. CHINA FISH FARMING MARKET, BY ENVIRONMENT, 2019-2032 (USD BILLION)
38. INDIA FISH FARMING MARKET, BY FISH TYPE, 2019-2032 (USD BILLION)
39. INDIA FISH FARMING MARKET, BY ENVIRONMENT, 2019-2032 (USD BILLION)
40. SOUTH AMERICA FISH FARMING MARKET, BY FISH TYPE, 2019-2032 (USD BILLION)
41. SOUTH AMERICA FISH FARMING MARKET, BY ENVIRONMENT, 2019-2032 (USD BILLION)
42. BRAZIL FISH FARMING MARKET, BY FISH TYPE, 2019-2032 (USD BILLION)
43. BRAZIL FISH FARMING MARKET, BY ENVIRONMENT, 2019-2032 (USD BILLION)
44. MIDDLE EAST AND AFRICA FISH FARMING MARKET, BY FISH TYPE, 2019-2032 (USD BILLION)
45. MIDDLE EAST AND AFRICA FISH FARMING MARKET, BY ENVIRONMENT, 2019-2032 (USD BILLION)
46. UAE FISH FARMING MARKET, BY FISH TYPE, 2019-2032 (USD BILLION)
47. UAE FISH FARMING MARKET, BY ENVIRONMENT, 2019-2032 (USD BILLION)
48. SOUTH AFRICA FISH FARMING MARKET, BY FISH TYPE, 2019-2032 (USD BILLION)
49. SOUTH AFRICA FISH FARMING MARKET, BY ENVIRONMENT, 2019-2032 (USD BILLION)
List of Figures
1. GLOBAL FISH FARMING MARKET SEGMENTATION
2. FISH FARMING MARKET: RESEARCH METHODOLOGY
3. MARKET SIZE ESTIMATION METHODOLOGY: BOTTOM-UP APPROACH
4. MARKET SIZE ESTIMATION METHODOLOGY: TOP-DOWN APPROACH
5. DATA TRIANGULATION
6. PORTER’S FIVE FORCES ANALYSIS
7. VALUE CHAIN ANALYSIS
8. GLOBAL FISH FARMING MARKET ATTRACTIVENESS ANALYSIS BY FISH TYPE
9. GLOBAL FISH FARMING MARKET ATTRACTIVENESS ANALYSIS BY ENVIRONMENT
10. GLOBAL FISH FARMING MARKET ATTRACTIVENESS ANALYSIS BY REGION
11. GLOBAL FISH FARMING MARKET: DYNAMICS
12. GLOBAL FISH FARMING MARKET SHARE BY FISH TYPE (2022 & 2032)
13. GLOBAL FISH FARMING MARKET SHARE BY ENVIRONMENT (2022 & 2032)
14. GLOBAL FISH FARMING MARKET SHARE BY REGIONS (2022 & 2032)
15. GLOBAL FISH FARMING MARKET SHARE BY COMPANY (2022)
This study forecasts revenue at global, regional, and country levels from 2019 to 2032. The Brainy Insights has segmented the global fish farming market based on below mentioned segments:
Global Fish Farming Market by Fish Type:
Global Fish Farming Market by Environment:
Global Fish Farming Market by Region:
Research has its special purpose to undertake marketing efficiently. In this competitive scenario, businesses need information across all industry verticals; the information about customer wants, market demand, competition, industry trends, distribution channels etc. This information needs to be updated regularly because businesses operate in a dynamic environment. Our organization, The Brainy Insights incorporates scientific and systematic research procedures in order to get proper market insights and industry analysis for overall business success. The analysis consists of studying the market from a miniscule level wherein we implement statistical tools which helps us in examining the data with accuracy and precision.
Our research reports feature both; quantitative and qualitative aspects for any market. Qualitative information for any market research process are fundamental because they reveal the customer needs and wants, usage and consumption for any product/service related to a specific industry. This in turn aids the marketers/investors in knowing certain perceptions of the customers. Qualitative research can enlighten about the different product concepts and designs along with unique service offering that in turn, helps define marketing problems and generate opportunities. On the other hand, quantitative research engages with the data collection process through interviews, e-mail interactions, surveys and pilot studies. Quantitative aspects for the market research are useful to validate the hypotheses generated during qualitative research method, explore empirical patterns in the data with the help of statistical tools, and finally make the market estimations.
The Brainy Insights offers comprehensive research and analysis, based on a wide assortment of factual insights gained through interviews with CXOs and global experts and secondary data from reliable sources. Our analysts and industry specialist assume vital roles in building up statistical tools and analysis models, which are used to analyse the data and arrive at accurate insights with exceedingly informative research discoveries. The data provided by our organization have proven precious to a diverse range of companies, facilitating them to address issues such as determining which products/services are the most appealing, whether or not customers use the product in the manner anticipated, the purchasing intentions of the market and many others.
Our research methodology encompasses an idyllic combination of primary and secondary initiatives. Key phases involved in this process are listed below:

The phase involves the gathering and collecting of market data and its related information with the help of different sources & research procedures.

The data procurement stage involves in data gathering and collecting through various data sources.
This stage involves in extensive research. These data sources includes:
Purchased Database: Purchased databases play a crucial role in estimating the market sizes irrespective of the domain. Our purchased database includes:
Primary Research: The Brainy Insights interacts with leading companies and experts of the concerned domain to develop the analyst team’s market understanding and expertise. It improves and substantiates every single data presented in the market reports. Primary research mainly involves in telephonic interviews, E-mail interactions and face-to-face interviews with the raw material providers, manufacturers/producers, distributors, & independent consultants. The interviews that we conduct provides valuable data on market size and industry growth trends prevailing in the market. Our organization also conducts surveys with the various industry experts in order to gain overall insights of the industry/market. For instance, in healthcare industry we conduct surveys with the pharmacists, doctors, surgeons and nurses in order to gain insights and key information of a medical product/device/equipment which the customers are going to usage. Surveys are conducted in the form of questionnaire designed by our own analyst team. Surveys plays an important role in primary research because surveys helps us to identify the key target audiences of the market. Additionally, surveys helps to identify the key target audience engaged with the market. Our survey team conducts the survey by targeting the key audience, thus gaining insights from them. Based on the perspectives of the customers, this information is utilized to formulate market strategies. Moreover, market surveys helps us to understand the current competitive situation of the industry. To be precise, our survey process typically involve with the 360 analysis of the market. This analytical process begins by identifying the prospective customers for a product or service related to the market/industry to obtain data on how a product/service could fit into customers’ lives.

Secondary Research: The secondary data sources includes information published by the on-profit organizations such as World bank, WHO, company fillings, investor presentations, annual reports, national government documents, statistical databases, blogs, articles, white papers and others. From the annual report, we analyse a company’s revenue to understand the key segment and market share of that organization in a particular region. We analyse the company websites and adopt the product mapping technique which is important for deriving the segment revenue. In the product mapping method, we select and categorize the products offered by the companies catering to domain specific market, deduce the product revenue for each of the companies so as to get overall estimation of the market size. We also source data and analyses trends based on information received from supply side and demand side intermediaries in the value chain. The supply side denotes the data gathered from supplier, distributor, wholesaler and the demand side illustrates the data gathered from the end customers for respective market domain.

The supply side for a domain specific market is analysed by:
The demand side for the market is estimated through:
In-house Library: Apart from these third-party sources, we have our in-house library of qualitative and quantitative information. Our in-house database includes market data for various industry and domains. These data are updated on regular basis as per the changing market scenario. Our library includes, historic databases, internal audit reports and archives.
Sometimes there are instances where there is no metadata or raw data available for any domain specific market. For those cases, we use our expertise to forecast and estimate the market size in order to generate comprehensive data sets. Our analyst team adopt a robust research technique in order to produce the estimates:
Data Synthesis: This stage involves the analysis & mapping of all the information obtained from the previous step. It also involves in scrutinizing the data for any discrepancy observed while data gathering related to the market. The data is collected with consideration to the heterogeneity of sources. Robust scientific techniques are in place for synthesizing disparate data sets and provide the essential contextual information that can orient market strategies. The Brainy Insights has extensive experience in data synthesis where the data passes through various stages:


Market Deduction & Formulation: The final stage comprises of assigning data points at appropriate market spaces so as to deduce feasible conclusions. Analyst perspective & subject matter expert based holistic form of market sizing coupled with industry analysis also plays a crucial role in this stage.
This stage involves in finalization of the market size and numbers that we have collected from data integration step. With data interpolation, it is made sure that there is no gap in the market data. Successful trend analysis is done by our analysts using extrapolation techniques, which provide the best possible forecasts for the market.
Data Validation & Market Feedback: Validation is the most important step in the process. Validation & re-validation via an intricately designed process helps us finalize data-points to be used for final calculations.

The Brainy Insights interacts with leading companies and experts of the concerned domain to develop the analyst team’s market understanding and expertise. It improves and substantiates every single data presented in the market reports. The data validation interview and discussion panels are typically composed of the most experienced industry members. The participants include, however, are not limited to:
Moreover, we always validate our data and findings through primary respondents from all the major regions we are working on.


Free Customization
Fortune 500 Clients
Free Yearly Update On Purchase Of Multi/Corporate License
Companies Served Till Date