- +1-315-215-1633
- sales@thebrainyinsights.com

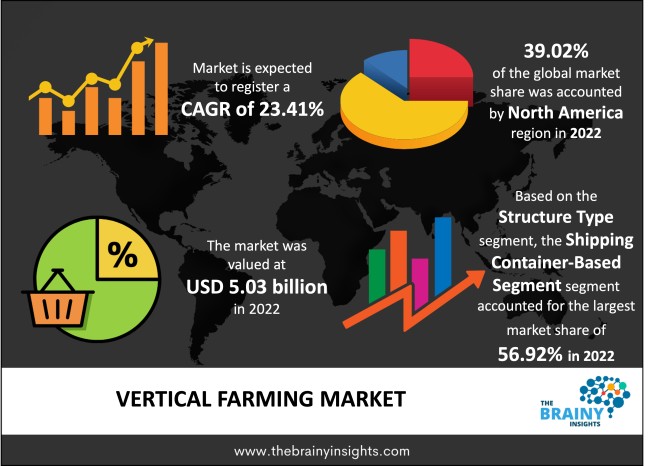
The global vertical farming market was valued at USD 5.03 Billion in 2022 and grew at a CAGR of 23.41% from 2023 to 2032. The market is expected to reach USD 41.21 Billion by 2032. The demand for vertical farming is increasing due to the rising requirement for ensuring food security and integrating sustainable practices in the agriculture industry.
Vertical farming uses precision agriculture techniques and skyscraper-like architecture to assist cities, deserts, and alpine settlements cultivate various fruits and vegetables. Vertical farming involves growing plants within, and it is also occasionally called indoor farming. Vertical farms use controlled growing and nutrition systems and LED illumination instead of sunlight and rain. Since plants are stacked in layers vertically, many farms resemble warehouses with many enormous shelving units. Growing food vertically is a very effective and sustainable method. Soil, hydroponic, or aeroponic growth techniques can be used. Vertical farms try to grow food in harsh settings, such as those with little or no arable land. Most vertical farms use enclosed, vertically stacking structures that resemble greenhouses and are either stacked directly over one another or spaced to maximize natural light exposure. There are several advantages to vertical farming, and this approach offers the most yield with the least amount of environmental effect and the least amount of space needed.
Get an overview of this study by requesting a free sample
Rising awareness for vertical farming: In recent years, the agriculture sector has seen a notable movement in favour of creative and sustainable farming techniques. One such technique that has attracted a lot of interest is vertical farming. Vertical farming is crucial for the future of agriculture because it presents a viable way to meet the world's expanding food demand while addressing issues with climate change, water use, and land scarcity. Although it is a relatively recent development in urban agriculture, vertical farming has been practised for a long time. Compared to traditional farming, vertical farms have demonstrated that it is possible to feed the world's expanding population in a more environmentally conscious and sustainable way. Additionally, continuous year-round production and enhanced overall yield are provided by vertical farming. Vertical farms make yearly food production possible since they are not as reliant on climate or weather.
High investment: The high cost of vertical farming setup hinders market growth. Installing a vertical farm rack technology costs about $1,000 per square metre, including setup and activation. The precise cost will vary depending on the size of the farm overall, building constraints, and whether other equipment is required. The cost of electricity also has a significant impact on the growth of the vertical farming market.
Increased demand for food production: The world's population has increased dramatically in the last century, and by 2030 and 2050, this trend is predicted to continue. A world population this size will eventually need more food and water. There are worries over whether the world's land mass will be adequate to support its expanding population by then, even if agricultural expansion has exceeded population growth. With an emphasis on emerging nations in particular, food security is a pertinent and significant concern for many of them. More inputs, such as land, water, or energy—or a combination—will be required for increased food production. Consequently, the need for sustainable farming practices in the agriculture sector will rise due to the required food production. The year-round production of crops made possible by vertical farming will contribute to the growth of such crops.
The regions analyzed for the market include North America, Europe, South America, Asia Pacific, the Middle East, and Africa. North America emerged as the most significant vertical farming market, with a 39.02% market revenue share in 2022.
North America region will account for the largest market share with revenue growth. Nations such as the U.S. and Canada have a tremendous demand for vertical farming due to growing investment in sustainable farming practices. Further, the regional government's favourable initiatives promote the growth of the vertical farming industry. The countries are also looking to meet the needs of agricultural produce to ensure food security.
North America region Vertical Farming Market Share in 2022 - 39.02%
www.thebrainyinsights.com
Check the geographical analysis of this market by requesting a free sample
The structure type segment is divided into shipping container-based and building-based. The shipping container-based segment dominated the market, with a share of around 56.92% in 2022. A container farm is significantly more economical than other indoor farming techniques, such as large-scale greenhouses or warehouses. Produce may be crammed into a vertical farm, maximizing every square inch of available space and being smaller and less expensive.
The growth type segment is divided into aeroponics, hydroponics and aquaponics. The hydroponics segment dominated the market, with a share of around 43.84% in 2022. The current agricultural techniques of hydroponic and vertical farming are combined in a vertical hydroponic system. Instead of using traditional farming methods that require more room, vertical hydroponic farming leverages the tried-and-true principles and practises of greenhouse production, making it perfect for urban farming in a condensed, controlled environment.
The component segment is divided into software, services and hardware. The services segment further includes managed services, system counselling and integration and assisted professional services. The hardware segment further includes climate control, sensors, lighting and hydroponic components. The hardware segment dominated the market, with a share of around 49.11% in 2022. The hardware components, such as sensors, artificial lights, climate control components, etc., are important for increasing crop production. Using the right hardware minimizes the weight load and helps in providing a controlled environment for efficient production.
The crop segment is divided into pepper, lettuce, cucumber, strawberry, bell and chili peppers, tomato, spinach, herbs, kale and others. The tomato segment dominated the market, with a share of around 21.02% in 2022. Culturing a lot of tomatoes in a small area is possible with vertical tomato farming in greenhouses. Vertical gardening is an effective and sustainable way to raise tomatoes in cities. It can yield more, create fresher, healthier produce, and require less shipping and chemicals.
| Attribute | Description |
|---|---|
| Market Size | Revenue (USD Billion) |
| Market size value in 2022 | USD 5.03 Billion |
| Market size value in 2032 | USD 41.21 Billion |
| CAGR (2023 to 2032) | 23.41% |
| Historical data | 2019-2021 |
| Base Year | 2022 |
| Forecast | 2023-2032 |
| Region | The regions analyzed for the market are Asia Pacific, Europe, South America, North America, and Middle East & Africa. Furthermore, the regions are further analyzed at the country level. |
| Segments | Structure Type, Growth Type, Component and Crop |
As per The Brainy Insights, the size of the vertical farming market was valued USD 5.03 billion in 2022 to USD 41.21 billion by 2032.
Global vertical farming market is growing at a CAGR of 23.41% during the forecast period 2023-2032.
North America region emerged as the largest market for the vertical farming.
The market's growth will be influenced by the rising awareness for vertical farming.
The high cost of setup can hamper the market growth.
The rising demand for food security is providing lucrative opportunities to the market.
Key players are Aerofarm, Agrilution GmbH, Brightfarms Inc., Freight Farms, Everlight Electronics Co., Ltd, GrowUp Urban Farms Ltd., Vertical Farm Systems, Green Sense Farms, LLC among others.
1. Introduction
1.1. Objectives of the Study
1.2. Market Definition
1.3. Research Scope
1.4. Currency
1.5. Key Target Audience
2. Research Methodology and Assumptions
3. Executive Summary
4. Premium Insights
4.1. Porter’s Five Forces Analysis
4.2. Value Chain Analysis
4.3. Top Investment Pockets
4.3.1. Market Attractiveness Analysis by Structure Type
4.3.2. Market Attractiveness Analysis by Growth Type
4.3.3. Market Attractiveness Analysis by Component
4.3.4. Market Attractiveness Analysis by Crop
4.3.5. Market Attractiveness Analysis by Region
4.4. Industry Trends
5. Market Dynamics
5.1. Market Evaluation
5.2. Drivers
5.2.1. Increasing awareness for vertical farming
5.3. Restraints
5.3.1. High cost of setup
5.4. Opportunities
5.4.1. Increasing investment in sustainable farming practices
5.5. Challenges
5.5.1. Requirement of skilled professionals
6. Global Vertical Farming Market Analysis and Forecast, By Structure Type
6.1. Segment Overview
6.2. Shipping Container-Based
6.3. Building-Based
7. Global Vertical Farming Market Analysis and Forecast, By Growth Type
7.1. Segment Overview
7.2. Aeroponics
7.3. Hydroponics
7.4. Aquaponics
8. Global Vertical Farming Market Analysis and Forecast, By Component
8.1. Segment Overview
8.2. Software
8.3. Services
8.3.1. Managed Services
8.3.2. System Counseling and Integration
8.3.3. Assisted Professional Services
8.4. Hardware
8.4.1. Climate Control
8.4.2. Sensors
8.4.3. Lighting
8.4.4. Hydroponic Components
9. Global Vertical Farming Market Analysis and Forecast, By Crop
9.1. Segment Overview
9.2. Pepper
9.3. Lettuce
9.4. Cucumber
9.5. Strawberry
9.6. Bell and Chili Peppers
9.7. Tomato
9.8. Spinach
9.9. Herbs
9.10. Kale
9.11. Others
10. Global Vertical Farming Market Analysis and Forecast, By Regional Analysis
10.1. Segment Overview
10.2. North America
10.2.1. U.S.
10.2.2. Canada
10.2.3. Mexico
10.3. Europe
10.3.1. Germany
10.3.2. France
10.3.3. U.K.
10.3.4. Italy
10.3.5. Spain
10.4. Asia-Pacific
10.4.1. Japan
10.4.2. China
10.4.3. India
10.5. South America
10.5.1. Brazil
10.6. Middle East and Africa
10.6.1. UAE
10.6.2. South Africa
11. Global Vertical Farming Market-Competitive Landscape
11.1. Overview
11.2. Market Share of Key Players in the Vertical Farming Market
11.2.1. Global Company Market Share
11.2.2. North America Company Market Share
11.2.3. Europe Company Market Share
11.2.4. APAC Company Market Share
11.3. Competitive Situations and Trends
11.3.1. Product Launches and Developments
11.3.2. Partnerships, Collaborations, and Agreements
11.3.3. Mergers & Acquisitions
11.3.4. Expansions
12. Company Profiles
12.1. Aerofarm
12.1.1. Business Overview
12.1.2. Company Snapshot
12.1.3. Company Market Share Analysis
12.1.4. Company Product Portfolio
12.1.5. Recent Developments
12.1.6. SWOT Analysis
12.2. Agrilution GmbH
12.2.1. Business Overview
12.2.2. Company Snapshot
12.2.3. Company Market Share Analysis
12.2.4. Company Product Portfolio
12.2.5. Recent Developments
12.2.6. SWOT Analysis
12.3. Brightfarms Inc.
12.3.1. Business Overview
12.3.2. Company Snapshot
12.3.3. Company Market Share Analysis
12.3.4. Company Product Portfolio
12.3.5. Recent Developments
12.3.6. SWOT Analysis
12.4. Freight Farms
12.4.1. Business Overview
12.4.2. Company Snapshot
12.4.3. Company Market Share Analysis
12.4.4. Company Product Portfolio
12.4.5. Recent Developments
12.4.6. SWOT Analysis
12.5. Everlight Electronics Co., Ltd
12.5.1. Business Overview
12.5.2. Company Snapshot
12.5.3. Company Market Share Analysis
12.5.4. Company Product Portfolio
12.5.5. Recent Developments
12.5.6. SWOT Analysis
12.6. GrowUp Urban Farms Ltd.
12.6.1. Business Overview
12.6.2. Company Snapshot
12.6.3. Company Market Share Analysis
12.6.4. Company Product Portfolio
12.6.5. Recent Developments
12.6.6. SWOT Analysis
12.7. Vertical Farm Systems
12.7.1. Business Overview
12.7.2. Company Snapshot
12.7.3. Company Market Share Analysis
12.7.4. Company Product Portfolio
12.7.5. Recent Developments
12.7.6. SWOT Analysis
12.8. Green Sense Farms, LLC
12.8.1. Business Overview
12.8.2. Company Snapshot
12.8.3. Company Market Share Analysis
12.8.4. Company Product Portfolio
12.8.5. Recent Developments
12.8.6. SWOT Analysis
List of Table
1. Global Vertical Farming Market, By Structure Type, 2019-2032 (USD Billion)
2. Global Shipping Container-Based, Vertical Farming Market, By Region, 2019-2032 (USD Billion)
3. Global Building-Based, Vertical Farming Market, By Region, 2019-2032 (USD Billion)
4. Global Vertical Farming Market, By Growth Type, 2019-2032 (USD Billion)
5. Global Aeroponics, Vertical Farming Market, By Region, 2019-2032 (USD Billion)
6. Global Hydroponics, Vertical Farming Market, By Region, 2019-2032 (USD Billion)
7. Global Aquaponics, Vertical Farming Market, By Region, 2019-2032 (USD Billion)
8. Global Vertical Farming Market, By Component, 2019-2032 (USD Billion)
9. Global Software, Vertical Farming Market, By Region, 2019-2032 (USD Billion)
10. Global Services, Vertical Farming Market, By Region, 2019-2032 (USD Billion)
11. Global Hardware, Vertical Farming Market, By Region, 2019-2032 (USD Billion)
12. Global Vertical Farming Market, By Crop, 2019-2032 (USD Billion)
13. Global Pepper, Vertical Farming Market, By Region, 2019-2032 (USD Billion)
14. Global Lettuce, Vertical Farming Market, By Region, 2019-2032 (USD Billion)
15. Global Cucumber, Vertical Farming Market, By Region, 2019-2032 (USD Billion)
16. Global Strawberry, Vertical Farming Market, By Region, 2019-2032 (USD Billion)
17. Global Bell and Chili Peppers, Vertical Farming Market, By Region, 2019-2032 (USD Billion)
18. Global Tomato, Vertical Farming Market, By Region, 2019-2032 (USD Billion)
19. Global Spinach, Vertical Farming Market, By Region, 2019-2032 (USD Billion)
20. Global Herbs, Vertical Farming Market, By Region, 2019-2032 (USD Billion)
21. Global Kale, Vertical Farming Market, By Region, 2019-2032 (USD Billion)
22. Global Others, Vertical Farming Market, By Region, 2019-2032 (USD Billion)
23. Global Vertical Farming Market, By Region, 2019-2032 (USD Billion)
24. North America Vertical Farming Market, By Structure Type, 2019-2032 (USD Billion)
25. North America Vertical Farming Market, By Growth Type, 2019-2032 (USD Billion)
26. North America Vertical Farming Market, By Component, 2019-2032 (USD Billion)
27. North America Vertical Farming Market, By Crop, 2019-2032 (USD Billion)
28. U.S. Vertical Farming Market, By Structure Type, 2019-2032 (USD Billion)
29. U.S. Vertical Farming Market, By Growth Type, 2019-2032 (USD Billion)
30. U.S. Vertical Farming Market, By Component, 2019-2032 (USD Billion)
31. U.S. Vertical Farming Market, By Crop, 2019-2032 (USD Billion)
32. Canada Vertical Farming Market, By Structure Type, 2019-2032 (USD Billion)
33. Canada Vertical Farming Market, By Growth Type, 2019-2032 (USD Billion)
34. Canada Vertical Farming Market, By Component, 2019-2032 (USD Billion)
35. Canada Vertical Farming Market, By Crop, 2019-2032 (USD Billion)
36. Mexico Vertical Farming Market, By Structure Type, 2019-2032 (USD Billion)
37. Mexico Vertical Farming Market, By Growth Type, 2019-2032 (USD Billion)
38. Mexico Vertical Farming Market, By Component, 2019-2032 (USD Billion)
39. Mexico Vertical Farming Market, By Crop, 2019-2032 (USD Billion)
40. Europe Vertical Farming Market, By Structure Type, 2019-2032 (USD Billion)
41. Europe Vertical Farming Market, By Growth Type, 2019-2032 (USD Billion)
42. Europe Vertical Farming Market, By Component, 2019-2032 (USD Billion)
43. Europe Vertical Farming Market, By Crop, 2019-2032 (USD Billion)
44. Germany Vertical Farming Market, By Structure Type, 2019-2032 (USD Billion)
45. Germany Vertical Farming Market, By Growth Type, 2019-2032 (USD Billion)
46. Germany Vertical Farming Market, By Component, 2019-2032 (USD Billion)
47. Germany Vertical Farming Market, By Crop, 2019-2032 (USD Billion)
48. France Vertical Farming Market, By Structure Type, 2019-2032 (USD Billion)
49. France Vertical Farming Market, By Growth Type, 2019-2032 (USD Billion)
50. France Vertical Farming Market, By Component, 2019-2032 (USD Billion)
51. France Vertical Farming Market, By Crop, 2019-2032 (USD Billion)
52. U.K. Vertical Farming Market, By Structure Type, 2019-2032 (USD Billion)
53. U.K. Vertical Farming Market, By Growth Type, 2019-2032 (USD Billion)
54. U.K. Vertical Farming Market, By Component, 2019-2032 (USD Billion)
55. U.K. Vertical Farming Market, By Crop, 2019-2032 (USD Billion)
56. Italy Vertical Farming Market, By Structure Type, 2019-2032 (USD Billion)
57. Italy Vertical Farming Market, By Growth Type, 2019-2032 (USD Billion)
58. Italy Vertical Farming Market, By Component, 2019-2032 (USD Billion)
59. Italy Vertical Farming Market, By Crop, 2019-2032 (USD Billion)
60. Spain Vertical Farming Market, By Structure Type, 2019-2032 (USD Billion)
61. Spain Vertical Farming Market, By Growth Type, 2019-2032 (USD Billion)
62. Spain Vertical Farming Market, By Component, 2019-2032 (USD Billion)
63. Spain Vertical Farming Market, By Crop, 2019-2032 (USD Billion)
64. Asia Pacific Vertical Farming Market, By Structure Type, 2019-2032 (USD Billion)
65. Asia Pacific Vertical Farming Market, By Growth Type, 2019-2032 (USD Billion)
66. Asia Pacific Vertical Farming Market, By Component, 2019-2032 (USD Billion)
67. Asia Pacific Vertical Farming Market, By Crop, 2019-2032 (USD Billion)
68. Japan Vertical Farming Market, By Structure Type, 2019-2032 (USD Billion)
69. Japan Vertical Farming Market, By Growth Type, 2019-2032 (USD Billion)
70. Japan Vertical Farming Market, By Component, 2019-2032 (USD Billion)
71. Japan Vertical Farming Market, By Crop, 2019-2032 (USD Billion)
72. China Vertical Farming Market, By Structure Type, 2019-2032 (USD Billion)
73. China Vertical Farming Market, By Growth Type, 2019-2032 (USD Billion)
74. China Vertical Farming Market, By Component, 2019-2032 (USD Billion)
75. China Vertical Farming Market, By Crop, 2019-2032 (USD Billion)
76. India Vertical Farming Market, By Structure Type, 2019-2032 (USD Billion)
77. India Vertical Farming Market, By Growth Type, 2019-2032 (USD Billion)
78. India Vertical Farming Market, By Component, 2019-2032 (USD Billion)
79. India Vertical Farming Market, By Crop, 2019-2032 (USD Billion)
80. South America Vertical Farming Market, By Structure Type, 2019-2032 (USD Billion)
81. South America Vertical Farming Market, By Growth Type, 2019-2032 (USD Billion)
82. South America Vertical Farming Market, By Component, 2019-2032 (USD Billion)
83. South America Vertical Farming Market, By Crop, 2019-2032 (USD Billion)
84. Brazil Vertical Farming Market, By Structure Type, 2019-2032 (USD Billion)
85. Brazil Vertical Farming Market, By Growth Type, 2019-2032 (USD Billion)
86. Brazil Vertical Farming Market, By Component, 2019-2032 (USD Billion)
87. BrazilVertical Farming Market, By Crop, 2019-2032 (USD Billion)
88. Middle East and Africa Vertical Farming Market, By Structure Type, 2019-2032 (USD Billion)
89. Middle East and Africa Vertical Farming Market, By Growth Type, 2019-2032 (USD Billion)
90. Middle East and Africa Vertical Farming Market, By Component, 2019-2032 (USD Billion)
91. Middle East and Africa Vertical Farming Market, By Crop, 2019-2032 (USD Billion)
92. UAE Vertical Farming Market, By Structure Type, 2019-2032 (USD Billion)
93. UAE Vertical Farming Market, By Growth Type, 2019-2032 (USD Billion)
94. UAE Vertical Farming Market, By Component, 2019-2032 (USD Billion)
95. UAE Vertical Farming Market, By Crop, 2019-2032 (USD Billion)
96. South Africa Vertical Farming Market, By Structure Type, 2019-2032 (USD Billion)
97. South Africa Vertical Farming Market, By Growth Type, 2019-2032 (USD Billion)
98. South Africa Vertical Farming Market, By Component, 2019-2032 (USD Billion)
99. South Africa Vertical Farming Market, By Crop, 2019-2032 (USD Billion)
List of Figures
1. Global Vertical Farming Market Segmentation
2. Vertical Farming Market: Research Methodology
3. Market Size Estimation Methodology: Bottom-Up Approach
4. Market Size Estimation Methodology: Top-Down Approach
5. Data Triangulation
6. Porter’s Five Forces Analysis
7. Value Chain Analysis
8. Global Vertical Farming Market Attractiveness Analysis by Structure Type
9. Global Vertical Farming Market Attractiveness Analysis by Growth Type
10. Global Vertical Farming Market Attractiveness Analysis by Component
11. Global Vertical Farming Market Attractiveness Analysis by Crop
12. Global Vertical Farming Market Attractiveness Analysis by Region
13. Global Vertical Farming Market: Dynamics
14. Global Vertical Farming Market Share by Structure Type (2022 & 2032)
15. Global Vertical Farming Market Share by Growth Type (2022 & 2032)
16. Global Vertical Farming Market Share by Component (2022 & 2032)
17. Global Vertical Farming Market Share by Crop (2022 & 2032)
18. Global Vertical Farming Market Share by Regions (2022 & 2032)
19. Global Vertical Farming Market Share by Company (2022)
This study forecasts revenue at global, regional, and country levels from 2019 to 2032. The Brainy Insights has segmented the global vertical farming market based on below mentioned segments:
Global Vertical Farming Market by Structure Type:
Global Vertical Farming Market by Growth Type:
Global Vertical Farming Market by Component:
Global Vertical Farming Market by Crop:
Global Vertical Farming Market by Region:
Research has its special purpose to undertake marketing efficiently. In this competitive scenario, businesses need information across all industry verticals; the information about customer wants, market demand, competition, industry trends, distribution channels etc. This information needs to be updated regularly because businesses operate in a dynamic environment. Our organization, The Brainy Insights incorporates scientific and systematic research procedures in order to get proper market insights and industry analysis for overall business success. The analysis consists of studying the market from a miniscule level wherein we implement statistical tools which helps us in examining the data with accuracy and precision.
Our research reports feature both; quantitative and qualitative aspects for any market. Qualitative information for any market research process are fundamental because they reveal the customer needs and wants, usage and consumption for any product/service related to a specific industry. This in turn aids the marketers/investors in knowing certain perceptions of the customers. Qualitative research can enlighten about the different product concepts and designs along with unique service offering that in turn, helps define marketing problems and generate opportunities. On the other hand, quantitative research engages with the data collection process through interviews, e-mail interactions, surveys and pilot studies. Quantitative aspects for the market research are useful to validate the hypotheses generated during qualitative research method, explore empirical patterns in the data with the help of statistical tools, and finally make the market estimations.
The Brainy Insights offers comprehensive research and analysis, based on a wide assortment of factual insights gained through interviews with CXOs and global experts and secondary data from reliable sources. Our analysts and industry specialist assume vital roles in building up statistical tools and analysis models, which are used to analyse the data and arrive at accurate insights with exceedingly informative research discoveries. The data provided by our organization have proven precious to a diverse range of companies, facilitating them to address issues such as determining which products/services are the most appealing, whether or not customers use the product in the manner anticipated, the purchasing intentions of the market and many others.
Our research methodology encompasses an idyllic combination of primary and secondary initiatives. Key phases involved in this process are listed below:

The phase involves the gathering and collecting of market data and its related information with the help of different sources & research procedures.

The data procurement stage involves in data gathering and collecting through various data sources.
This stage involves in extensive research. These data sources includes:
Purchased Database: Purchased databases play a crucial role in estimating the market sizes irrespective of the domain. Our purchased database includes:
Primary Research: The Brainy Insights interacts with leading companies and experts of the concerned domain to develop the analyst team’s market understanding and expertise. It improves and substantiates every single data presented in the market reports. Primary research mainly involves in telephonic interviews, E-mail interactions and face-to-face interviews with the raw material providers, manufacturers/producers, distributors, & independent consultants. The interviews that we conduct provides valuable data on market size and industry growth trends prevailing in the market. Our organization also conducts surveys with the various industry experts in order to gain overall insights of the industry/market. For instance, in healthcare industry we conduct surveys with the pharmacists, doctors, surgeons and nurses in order to gain insights and key information of a medical product/device/equipment which the customers are going to usage. Surveys are conducted in the form of questionnaire designed by our own analyst team. Surveys plays an important role in primary research because surveys helps us to identify the key target audiences of the market. Additionally, surveys helps to identify the key target audience engaged with the market. Our survey team conducts the survey by targeting the key audience, thus gaining insights from them. Based on the perspectives of the customers, this information is utilized to formulate market strategies. Moreover, market surveys helps us to understand the current competitive situation of the industry. To be precise, our survey process typically involve with the 360 analysis of the market. This analytical process begins by identifying the prospective customers for a product or service related to the market/industry to obtain data on how a product/service could fit into customers’ lives.

Secondary Research: The secondary data sources includes information published by the on-profit organizations such as World bank, WHO, company fillings, investor presentations, annual reports, national government documents, statistical databases, blogs, articles, white papers and others. From the annual report, we analyse a company’s revenue to understand the key segment and market share of that organization in a particular region. We analyse the company websites and adopt the product mapping technique which is important for deriving the segment revenue. In the product mapping method, we select and categorize the products offered by the companies catering to domain specific market, deduce the product revenue for each of the companies so as to get overall estimation of the market size. We also source data and analyses trends based on information received from supply side and demand side intermediaries in the value chain. The supply side denotes the data gathered from supplier, distributor, wholesaler and the demand side illustrates the data gathered from the end customers for respective market domain.

The supply side for a domain specific market is analysed by:
The demand side for the market is estimated through:
In-house Library: Apart from these third-party sources, we have our in-house library of qualitative and quantitative information. Our in-house database includes market data for various industry and domains. These data are updated on regular basis as per the changing market scenario. Our library includes, historic databases, internal audit reports and archives.
Sometimes there are instances where there is no metadata or raw data available for any domain specific market. For those cases, we use our expertise to forecast and estimate the market size in order to generate comprehensive data sets. Our analyst team adopt a robust research technique in order to produce the estimates:
Data Synthesis: This stage involves the analysis & mapping of all the information obtained from the previous step. It also involves in scrutinizing the data for any discrepancy observed while data gathering related to the market. The data is collected with consideration to the heterogeneity of sources. Robust scientific techniques are in place for synthesizing disparate data sets and provide the essential contextual information that can orient market strategies. The Brainy Insights has extensive experience in data synthesis where the data passes through various stages:


Market Deduction & Formulation: The final stage comprises of assigning data points at appropriate market spaces so as to deduce feasible conclusions. Analyst perspective & subject matter expert based holistic form of market sizing coupled with industry analysis also plays a crucial role in this stage.
This stage involves in finalization of the market size and numbers that we have collected from data integration step. With data interpolation, it is made sure that there is no gap in the market data. Successful trend analysis is done by our analysts using extrapolation techniques, which provide the best possible forecasts for the market.
Data Validation & Market Feedback: Validation is the most important step in the process. Validation & re-validation via an intricately designed process helps us finalize data-points to be used for final calculations.

The Brainy Insights interacts with leading companies and experts of the concerned domain to develop the analyst team’s market understanding and expertise. It improves and substantiates every single data presented in the market reports. The data validation interview and discussion panels are typically composed of the most experienced industry members. The participants include, however, are not limited to:
Moreover, we always validate our data and findings through primary respondents from all the major regions we are working on.


Free Customization
Fortune 500 Clients
Free Yearly Update On Purchase Of Multi/Corporate License
Companies Served Till Date