- +1-315-215-1633
- sales@thebrainyinsights.com

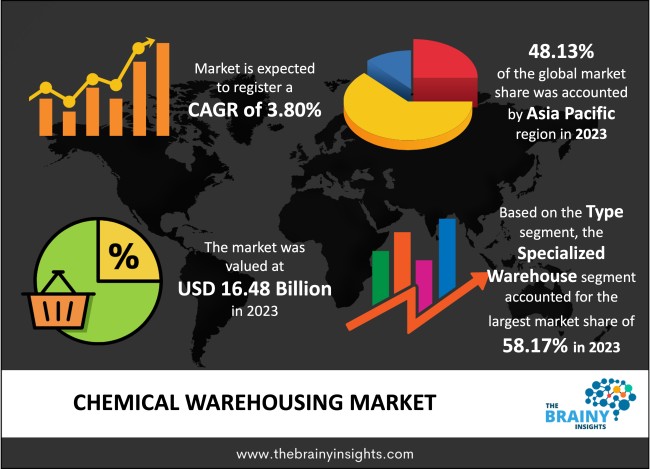
The global chemical warehousing market is expected to reach USD 23.94 billion by 2033, at a CAGR of 3.80% from 2024 to 2033. The increase in trade activity in emerging economies coupled with the rising chemical production drives the expansion of the chemical warehousing market.
A warehouse storage facility stores semi-finished and finished goods, raw materials, and products to be manufactured and exported. Chemical stores are warehouses commonly utilized by pharmaceutical or chemical corporations to store bulk chemicals. Chemical storage devices are usually present where a workplace needs to use non-hazardous and hazardous chemicals. Warehousing facilities assist manufacturers in protecting goods from pests and insects and assure a seamless flow of manufacturing & distribution activities. A chemical warehouse should have special precautions and safety measures like chemical identification & labeling, adequate ventilation, and proper building temperature controls. Many institutions have offloaded their inventory storage to experts, such as third-party logistics (3PL) providers specializing in hazmat and chemical operations. Globally Harmonized System (GHS) hazard class, Material Safety Data Sheet (MSDS), Warehouse Management System (WMS), and other IT-driven solutions are utilized for the smooth operation of 3PL. 3PL delivers chemical warehouse facilities for chemicals that require specialized transportation, handling, and storage.
Get an overview of this study by requesting a free sample
The increase in production & international trade in chemicals, notably hazardous chemicals, is the driving factor of the market growth. Further, the increased demand across the glow, primarily agriculturally, is another driving factor of the market growth. Moreover, the increase in population and food demand also increases the need for agrochemicals for better crop production, which further propels the growth of the chemical warehousing market during the forecast period. In addition, the rise in demand for FMCGs like personal care, hygiene, and household cleaning products is propelling market growth. However, specialty chemicals & additives are used in the production of fast-moving consumer goods. Further, the chemicals are also used in the pharmaceutical, agriculture, and textile sectors. Thus, the chemical industry impacts all sectors of the economy, which turn to expected market growth during the upcoming years.
The high R&D expense and capital investment are restraining market growth. Further, the fluctuating raw material prices and stringent regulations governing specialty chemical warehousing are restraining the market growth. Moreover, warehouse operators' slow adoption of technologically advanced equipment to track and monitor inventory hinders the market. However, the non-availability of handle support in specialty chemicals and the incapability to carry heavy goods also impede the market growth during the forecast period.
The production of bio-based fertilizers and pesticides is anticipated to create an opportunity for the market. Further, the technical advancement in inventory tracking, automatic handling, and real-time temperature tracking, along with various initiatives, are helping to boost the market growth. However, the shifting consumer trends towards processed foods due to increasing disposable income increased convenience, and improved living standards in developing economies also drive market growth during the forecast period.
The global chemical warehousing market has been segmented based on type, chemical type, and region.
The regions analyzed for the market include North America, Europe, South America, Asia Pacific, the Middle East, and Africa. Asia Pacific region emerged as the largest market for the global chemical warehousing market, with a 48.13% share of the market revenue in 2023.
Asia Pacific Region Chemical Warehousing Market Share in 2023 - 48.13%
www.thebrainyinsights.com
Check the geographical analysis of this market by requesting a free sample
The key players are now concentrating on implementing strategies such as adopting new technology, product innovations, mergers & acquisitions, joint venture, alliances, and partnerships to improve their market position in the global chemical warehousing industry.
As per The Brainy Insights, the size of the chemical warehousing market was valued at USD 16.48 billion in 2023 to USD 23.94 billion by 2033.
Global chemical warehousing market is growing at a CAGR of 3.80% during the forecast period 2024-2033.
The global chemical warehousing market has been segmented based on type, chemical type, and regions. The specialized warehouse segment led grade segment in 2023. The agrochemicals segment led the application segment in 2023.
Asia Pacific region emerged as the largest market for the chemical warehousing.
The market's growth will be influenced by the rise in international trade.
The high R&D expense and capital investment could hamper the market growth.
The increasing technological advancement will provide huge opportunities to the market.
1. Introduction
1.1. Objectives of the Study
1.2. Market Definition
1.3. Research Scope
1.4. Currency
1.5. Key Target Audience
2. Research Methodology and Assumptions
3. Executive Summary
4. Premium Insights
4.1. Porter’s Five Forces Analysis
4.2. Value Chain Analysis
4.3. Top Investment Pockets
4.3.1. Market Attractiveness Analysis By Type
4.3.2. Market Attractiveness Analysis By Chemical Type
4.3.3. Market Attractiveness Analysis By Region
4.4. Industry Trends
5. Market Dynamics
5.1. Market Evaluation
5.2. Market Evaluation
5.3. Drivers
5.3.1. The rise in international trade
5.3.2. The increasing demand for chemical warehousing
5.3.3. The growing R&D for developing new products
5.4. Restraints
5.4.1. The high R&D expense and capital investment
5.4.2. The fluctuating raw material prices
5.5. Opportunities
5.5.1. The increasing technological advancement
6. Global Chemical Warehousing Market Analysis and Forecast, By Type
6.1. Segment Overview
6.2. Specialized Warehouse
6.3. General Warehouse
7. Global Chemical Warehousing Market Analysis and Forecast, By Chemical Type
7.1. Segment Overview
7.2. Synthetic Rubber
7.3. Petrochemical
7.4. Agrochemicals
7.5. Consumer Chemicals
7.6. Construction Chemicals
7.7. Polymer and Plastic
7.8. Textile Chemicals
7.9. Others
8. Global Chemical Warehousing Market Analysis and Forecast, By Regional Analysis
8.1. Segment Overview
8.2. North America
8.2.1. U.S.
8.2.2. Canada
8.2.3. Mexico
8.3. Europe
8.3.1. Germany
8.3.2. France
8.3.3. U.K.
8.3.4. Italy
8.3.5. Spain
8.4. Asia-Pacific
8.4.1. Japan
8.4.2. China
8.4.3. India
8.5. South America
8.5.1. Brazil
8.6. Middle East and Africa
8.6.1. UAE
8.6.2. South Africa
9. Global Chemical Warehousing Market-Competitive Landscape
9.1. Overview
9.2. Market Share of Key Players in Global Chemical Warehousing Market
9.2.1. Global Company Market Share
9.2.2. North America Company Market Share
9.2.3. Europe Company Market Share
9.2.4. APAC Company Market Share
9.3. Competitive Situations and Trends
9.3.1. Product Launches and Developments
9.3.2. Partnerships, Collaborations, and Agreements
9.3.3. Mergers & Acquisitions
9.3.4. Expansions
10. Company Profiles
10.1. Deutsche Post DHL Group
10.1.1. Business Overview
10.1.2. Company Snapshot
10.1.3. Company Market Share Analysis
10.1.4. Company Product Portfolio
10.1.5. Recent Developments
10.1.6. SWOT Analysis
10.2. Affiliated Warehouse Companies
10.2.1. Business Overview
10.2.2. Company Snapshot
10.2.3. Company Market Share Analysis
10.2.4. Company Product Portfolio
10.2.5. Recent Developments
10.2.6. SWOT Analysis
10.3. Commonwealth Inc.
10.3.1. Business Overview
10.3.2. Company Snapshot
10.3.3. Company Market Share Analysis
10.3.4. Company Product Portfolio
10.3.5. Recent Developments
10.3.6. SWOT Analysis
10.4. Broekman Logistics
10.4.1. Business Overview
10.4.2. Company Snapshot
10.4.3. Company Market Share Analysis
10.4.4. Company Product Portfolio
10.4.5. Recent Developments
10.4.6. SWOT Analysis
10.5. Brenntag SE
10.5.1. Business Overview
10.5.2. Company Snapshot
10.5.3. Company Market Share Analysis
10.5.4. Company Product Portfolio
10.5.5. Recent Developments
10.5.6. SWOT Analysis
10.6. Univar Solutions
10.6.1. Business Overview
10.6.2. Company Snapshot
10.6.3. Company Market Share Analysis
10.6.4. Company Product Portfolio
10.6.5. Recent Developments
10.6.6. SWOT Analysis
10.7. Rinchem Company, Inc.
10.7.1. Business Overview
10.7.2. Company Snapshot
10.7.3. Company Market Share Analysis
10.7.4. Company Product Portfolio
10.7.5. Recent Developments
10.7.6. SWOT Analysis
10.8. KEMITO
10.8.1. Business Overview
10.8.2. Company Snapshot
10.8.3. Company Market Share Analysis
10.8.4. Company Product Portfolio
10.8.5. Recent Developments
10.8.6. SWOT Analysis
10.9. Anchor 3PL
10.9.1. Business Overview
10.9.2. Company Snapshot
10.9.3. Company Market Share Analysis
10.9.4. Company Product Portfolio
10.9.5. Recent Developments
10.9.6. SWOT Analysis
10.10. International Trade of Chemicals
10.10.1. Business Overview
10.10.2. Company Snapshot
10.10.3. Company Market Share Analysis
10.10.4. Company Product Portfolio
10.10.5. Recent Developments
10.10.6. SWOT Analysis
10.11. Warehouse Specialists Inc.
10.11.1. Business Overview
10.11.2. Company Snapshot
10.11.3. Company Market Share Analysis
10.11.4. Company Product Portfolio
10.11.5. Recent Developments
10.11.6. SWOT Analysis
List of Table
1. Global Chemical Warehousing Market, By Type, 2020-2033 (USD Billion)
2. Global Specialized Warehouse, Chemical Warehousing Market, By Region, 2020-2033 (USD Billion)
3. Global General Warehouse, Chemical Warehousing Market, By Region, 2020-2033 (USD Billion)
4. Global Chemical Warehousing Market, By Chemical Type, 2020-2033 (USD Billion)
5. Global Synthetic Rubber, Chemical Warehousing Market, By Region, 2020-2033 (USD Billion)
6. Global Petrochemical, Chemical Warehousing Market, By Region, 2020-2033 (USD Billion)
7. Global Agrochemicals, Chemical Warehousing Market, By Region, 2020-2033 (USD Billion)
8. Global Consumer Chemicals, Chemical Warehousing Market, By Region, 2020-2033 (USD Billion)
9. Global Construction Chemicals, Chemical Warehousing Market, By Region, 2020-2033 (USD Billion)
10. Global Polymer and Plastic, Chemical Warehousing Market, By Region, 2020-2033 (USD Billion)
11. Global Textile Chemicals, Chemical Warehousing Market, By Region, 2020-2033 (USD Billion)
12. Global Others, Chemical Warehousing Market, By Region, 2020-2033 (USD Billion)
13. North America Chemical Warehousing Market, By Type, 2020-2033 (USD Billion)
14. North America Chemical Warehousing Market, By Chemical Type, 2020-2033 (USD Billion)
15. U.S. Chemical Warehousing Market, By Type, 2020-2033 (USD Billion)
16. U.S. Chemical Warehousing Market, By Chemical Type, 2020-2033 (USD Billion)
17. Canada Chemical Warehousing Market, By Type, 2020-2033 (USD Billion)
18. Canada Chemical Warehousing Market, By Chemical Type, 2020-2033 (USD Billion)
19. Mexico Chemical Warehousing Market, By Type, 2020-2033 (USD Billion)
20. Mexico Chemical Warehousing Market, By Chemical Type, 2020-2033 (USD Billion)
21. Europe Chemical Warehousing Market, By Type, 2020-2033 (USD Billion)
22. Europe Chemical Warehousing Market, By Chemical Type, 2020-2033 (USD Billion)
23. Germany Chemical Warehousing Market, By Type, 2020-2033 (USD Billion)
24. Germany Chemical Warehousing Market, By Chemical Type, 2020-2033 (USD Billion)
25. France Chemical Warehousing Market, By Type, 2020-2033 (USD Billion)
26. France Chemical Warehousing Market, By Chemical Type 2020-2033 (USD Billion)
27. U.K. Chemical Warehousing Market, By Type, 2020-2033 (USD Billion)
28. U.K. Chemical Warehousing Market, By Chemical Type 2020-2033 (USD Billion)
29. Italy Chemical Warehousing Market, By Type, 2020-2033 (USD Billion)
30. Italy Chemical Warehousing Market, By Chemical Type 2020-2033 (USD Billion)
31. Spain Chemical Warehousing Market, By Type, 2020-2033 (USD Billion)
32. Spain Chemical Warehousing Market, By Chemical Type 2020-2033 (USD Billion)
33. Asia Pacific Chemical Warehousing Market, By Type, 2020-2033 (USD Billion)
34. Asia Pacific Chemical Warehousing Market, By Chemical Type 2020-2033 (USD Billion)
35. Japan Chemical Warehousing Market, By Type, 2020-2033 (USD Billion)
36. Japan Chemical Warehousing Market, By Chemical Type 2020-2033 (USD Billion)
37. China Chemical Warehousing Market, By Type, 2020-2033 (USD Billion)
38. China Chemical Warehousing Market, By Chemical Type 2020-2033 (USD Billion)
39. India Chemical Warehousing Market, By Type, 2020-2033 (USD Billion)
40. India Chemical Warehousing Market, By Chemical Type 2020-2033 (USD Billion)
41. South America Chemical Warehousing Market, By Type, 2020-2033 (USD Billion)
42. South America Chemical Warehousing Market, By Chemical Type 2020-2033 (USD Billion)
43. Brazil Chemical Warehousing Market, By Type, 2020-2033 (USD Billion)
44. Brazil Chemical Warehousing Market, By Chemical Type 2020-2033 (USD Billion)
45. Middle East and Africa Chemical Warehousing Market, By Type, 2020-2033 (USD Billion)
46. Middle East and Africa Chemical Warehousing Market, By Chemical Type 2020-2033 (USD Billion)
47. UAE Chemical Warehousing Market, By Type, 2020-2033 (USD Billion)
48. UAE Chemical Warehousing Market, By Chemical Type 2020-2033 (USD Billion)
49. South Africa Chemical Warehousing Market, By Type, 2020-2033 (USD Billion)
50. South Africa Chemical Warehousing Market, By Chemical Type 2020-2033 (USD Billion)
List of Figures
1. Global Chemical Warehousing Market Segmentation
2. Global Chemical Warehousing Market: Research Methodology
3. Market Size Estimation Methodology: Bottom-Up Approach
4. Market Size Estimation Methodology: Top-Down Approach
5. Data Triangulation
6. Porter’s Five Forces Analysis
7. Value Chain Analysis
8. Global Chemical Warehousing Market Attractiveness Analysis By Type
9. Global Chemical Warehousing Market Attractiveness Analysis By Chemical Type
10. Global Chemical Warehousing Market Attractiveness Analysis By Region
11. Global Chemical Warehousing Market: Dynamics
12. Global Chemical Warehousing Market Share By Type (2023 & 2033)
13. Global Chemical Warehousing Market Share By Chemical Type (2023 & 2033)
14. Global Chemical Warehousing Market Share By Regions (2023 & 2033)
15. Global Chemical Warehousing Market Share By Company (2023)
This study forecasts revenue at global, regional, and country levels from 2020 to 2033. The Brainy Insights has segmented the global chemical warehousing based on below mentioned segments:
Global Chemical Warehousing Market by Type:
Global Chemical Warehousing Market by Chemical Type:
Global Chemical Warehousing by Region:
Research has its special purpose to undertake marketing efficiently. In this competitive scenario, businesses need information across all industry verticals; the information about customer wants, market demand, competition, industry trends, distribution channels etc. This information needs to be updated regularly because businesses operate in a dynamic environment. Our organization, The Brainy Insights incorporates scientific and systematic research procedures in order to get proper market insights and industry analysis for overall business success. The analysis consists of studying the market from a miniscule level wherein we implement statistical tools which helps us in examining the data with accuracy and precision.
Our research reports feature both; quantitative and qualitative aspects for any market. Qualitative information for any market research process are fundamental because they reveal the customer needs and wants, usage and consumption for any product/service related to a specific industry. This in turn aids the marketers/investors in knowing certain perceptions of the customers. Qualitative research can enlighten about the different product concepts and designs along with unique service offering that in turn, helps define marketing problems and generate opportunities. On the other hand, quantitative research engages with the data collection process through interviews, e-mail interactions, surveys and pilot studies. Quantitative aspects for the market research are useful to validate the hypotheses generated during qualitative research method, explore empirical patterns in the data with the help of statistical tools, and finally make the market estimations.
The Brainy Insights offers comprehensive research and analysis, based on a wide assortment of factual insights gained through interviews with CXOs and global experts and secondary data from reliable sources. Our analysts and industry specialist assume vital roles in building up statistical tools and analysis models, which are used to analyse the data and arrive at accurate insights with exceedingly informative research discoveries. The data provided by our organization have proven precious to a diverse range of companies, facilitating them to address issues such as determining which products/services are the most appealing, whether or not customers use the product in the manner anticipated, the purchasing intentions of the market and many others.
Our research methodology encompasses an idyllic combination of primary and secondary initiatives. Key phases involved in this process are listed below:

The phase involves the gathering and collecting of market data and its related information with the help of different sources & research procedures.

The data procurement stage involves in data gathering and collecting through various data sources.
This stage involves in extensive research. These data sources includes:
Purchased Database: Purchased databases play a crucial role in estimating the market sizes irrespective of the domain. Our purchased database includes:
Primary Research: The Brainy Insights interacts with leading companies and experts of the concerned domain to develop the analyst team’s market understanding and expertise. It improves and substantiates every single data presented in the market reports. Primary research mainly involves in telephonic interviews, E-mail interactions and face-to-face interviews with the raw material providers, manufacturers/producers, distributors, & independent consultants. The interviews that we conduct provides valuable data on market size and industry growth trends prevailing in the market. Our organization also conducts surveys with the various industry experts in order to gain overall insights of the industry/market. For instance, in healthcare industry we conduct surveys with the pharmacists, doctors, surgeons and nurses in order to gain insights and key information of a medical product/device/equipment which the customers are going to usage. Surveys are conducted in the form of questionnaire designed by our own analyst team. Surveys plays an important role in primary research because surveys helps us to identify the key target audiences of the market. Additionally, surveys helps to identify the key target audience engaged with the market. Our survey team conducts the survey by targeting the key audience, thus gaining insights from them. Based on the perspectives of the customers, this information is utilized to formulate market strategies. Moreover, market surveys helps us to understand the current competitive situation of the industry. To be precise, our survey process typically involve with the 360 analysis of the market. This analytical process begins by identifying the prospective customers for a product or service related to the market/industry to obtain data on how a product/service could fit into customers’ lives.

Secondary Research: The secondary data sources includes information published by the on-profit organizations such as World bank, WHO, company fillings, investor presentations, annual reports, national government documents, statistical databases, blogs, articles, white papers and others. From the annual report, we analyse a company’s revenue to understand the key segment and market share of that organization in a particular region. We analyse the company websites and adopt the product mapping technique which is important for deriving the segment revenue. In the product mapping method, we select and categorize the products offered by the companies catering to domain specific market, deduce the product revenue for each of the companies so as to get overall estimation of the market size. We also source data and analyses trends based on information received from supply side and demand side intermediaries in the value chain. The supply side denotes the data gathered from supplier, distributor, wholesaler and the demand side illustrates the data gathered from the end customers for respective market domain.

The supply side for a domain specific market is analysed by:
The demand side for the market is estimated through:
In-house Library: Apart from these third-party sources, we have our in-house library of qualitative and quantitative information. Our in-house database includes market data for various industry and domains. These data are updated on regular basis as per the changing market scenario. Our library includes, historic databases, internal audit reports and archives.
Sometimes there are instances where there is no metadata or raw data available for any domain specific market. For those cases, we use our expertise to forecast and estimate the market size in order to generate comprehensive data sets. Our analyst team adopt a robust research technique in order to produce the estimates:
Data Synthesis: This stage involves the analysis & mapping of all the information obtained from the previous step. It also involves in scrutinizing the data for any discrepancy observed while data gathering related to the market. The data is collected with consideration to the heterogeneity of sources. Robust scientific techniques are in place for synthesizing disparate data sets and provide the essential contextual information that can orient market strategies. The Brainy Insights has extensive experience in data synthesis where the data passes through various stages:


Market Deduction & Formulation: The final stage comprises of assigning data points at appropriate market spaces so as to deduce feasible conclusions. Analyst perspective & subject matter expert based holistic form of market sizing coupled with industry analysis also plays a crucial role in this stage.
This stage involves in finalization of the market size and numbers that we have collected from data integration step. With data interpolation, it is made sure that there is no gap in the market data. Successful trend analysis is done by our analysts using extrapolation techniques, which provide the best possible forecasts for the market.
Data Validation & Market Feedback: Validation is the most important step in the process. Validation & re-validation via an intricately designed process helps us finalize data-points to be used for final calculations.

The Brainy Insights interacts with leading companies and experts of the concerned domain to develop the analyst team’s market understanding and expertise. It improves and substantiates every single data presented in the market reports. The data validation interview and discussion panels are typically composed of the most experienced industry members. The participants include, however, are not limited to:
Moreover, we always validate our data and findings through primary respondents from all the major regions we are working on.


Free Customization
Fortune 500 Clients
Free Yearly Update On Purchase Of Multi/Corporate License
Companies Served Till Date