- +1-315-215-1633
- sales@thebrainyinsights.com

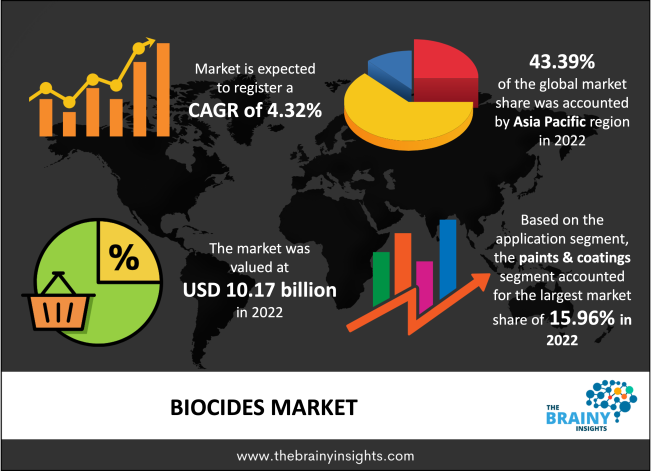
The global biocides market was valued at USD 10.17 billion in 2022, increasing at a CAGR of 4.32% from 2022 to 2032 and anticipated to reach USD 15.53 billion by 2032. Asia Pacific is expected to grow the fastest during the forecast period. Also, the rising requirement for effective wastewater treatment solutions, coupled with extensive research and development (R&D) activities, is expected to drive market growth during the forecast period.
Biocides are substances or products utilized to protect against unwanted microorganisms, plants, and animals. They are produced in powder and liquid forms, in ready-to-use formulations, or as concentrates and are applied utilizing various techniques. Biocides are used to suppress harmful organisms that can cause damage to natural or manufactured materials. These harmful organisms contain pests and germs. Examples of biocidal products are disinfectants, insect repellents, and industrial chemicals, such as anti-fouling paints for ships & material preservatives. Biocidal substances such as chlorine are utilized as a short-life biocide in industrial water treatment and also as a disinfectant in swimming pools. Biocides help in preventing bacterial & algae contamination in municipal drinking water systems, pipes in pools, and industrial water treatment systems. Fungicides, pesticides, or herbicides are all examples of various kinds of biocide.
Get an overview of this study by requesting a free sample
For example, in June 2021, B&V Chemicals utilized biocides as dosing & bio dispersants in cooling tower water treatment.
The increasing demand for clean and potable water: The rising disposable income and the steady macroeconomic development of many countries are driving factors of the market growth. Further, the rise in GDP, technological advancements, and the rise of better healthcare facilities are expected to propel market growth. Moreover, the increasing demand from the agricultural sector for biocides to control crop pests & diseases is also helping to boost the market growth during the forecast period. Apart from this, growing awareness about softening the hard water and regulatory inclination toward reducing water pollution in household & industrial sectors are also helping the boost market growth. However, the increasing pressure from the regulatory framework on industrial sectors to utilize water treatment processes on industrial wastewater is expected to propel the market growth during the forecast period.
The variations in the raw material prices: The expensive charges for manufacturing and registration and the regulatory framework for biocidal products are restraining the market growth. Moreover, the variations in raw material prices, along with the rise in concerns about the health hazards caused by biocides and biocidal products is, also hampering the market growth.
The increasing application of biocides in various fields: The rising cases of waterborne diseases among the population has raised the demand for treated water. Further, consumers' growing adoption of cleaner alternatives is helping boost the market growth. Additionally, the rising need for increased use of biocides in customer products and emerging innovative products via technological advancement propel the market growth during the forecast period. Moreover, an increasing focus on improving water quality worldwide coupled with the growing environmental concerns over waste disposal are anticipated to propel the market growth in the upcoming year.
The regions analyzed for the market include Europe, South America, Asia Pacific, North America, the Middle East, and Africa. Asia Pacific emerged as the largest global biocides market, with a 43.39% market revenue share in 2022. Asia Pacific dominates the biocides market due to the rapid shift towards natural gas solutions, as biocides are utilized in the downstream & upstream operations of natural gas. Further, the increasing demand for effective wastewater treatment solutions and the rising demand for clean and potable water is anticipated to drive market growth in this region. Moreover, the increased manufacturing of disinfectants, particularly during the COVID-19 pandemic, is also helping to drive market growth in this region. However, a surge in product demand in applications, including radiator grills, door handles, bumpers, wheel rims, bumpers, bicycles, and metallic structural components, is helping to stimulate the market growth in this region. North America is expected to grow the fastest during the forecast period due to the increasing research & development actions. Also, increasing demand for water treatment and management, wood preservatives, paints & coatings, and personal care products are propelling the market growth in this region. Moreover, the growing consumption of cleaning products, which is highly helped by the increased disinfectant production, is also propelling the market growth. Apart from this, the stringent regulatory measures by the EPA about disinfectant use and the increasing application of powder coatings on numerous parts of automobiles are also helping to push the market growth in this region during the forecast period. However, the vast demand for treated water from the pharmaceuticals and beverages sectors in nations such as the U.S. propels the market growth in this region over the forecast period.
Asia Pacific Region Biocides Market Share in 2022 - 43.39%
www.thebrainyinsights.com
Check the geographical analysis of this market by requesting a free sample
The application segment is divided into personal care, water treatment, wood preservation, plastics, boilers, food & beverages, paints & coatings, oil & gas, HVAC, pulp & paper, fuels, cleaning products, and others. The paints & coatings segment dominated, with a market share of around 15.96% in 2022. This growth is attributed to the increased spending in the construction industry along with the shifting customer preference for environment-friendly products. Further, by 2032, the water treatment segment will likely dominate the market due to the growing demand for housing in metropolitan areas. Moreover, the water treatment applications make considerable use of biocides, such as sodium bromide, hypobromous acid, hydrogen peroxide, bromine, silver, chlorine tablets, stabilized bromine, calcium hypochlorite, sodium hypochlorite, isothiazolinone, Bronopol, and QACs.
The product segment is divided into metallic compounds, halogen compounds, organosulfur, quaternary ammonium compounds, nitrogen, phenolic, glutaraldehyde, and organic acids. In 2022, the halogen compounds segment dominated the market with 21.16% and a revenue of 2.15 billion. This growth is attributed to the increasing demand from the agricultural sector for biocides to control crop pests and diseases. Further, by 2032, the organosulfur segment will likely dominate the market due to the increasing use of organosulfur compounds in plastics. Additionally, organosulfur compounds are widely utilized as active ingredients in different pharmaceuticals, such as antibiotics and antifungals.
| Attribute | Description |
|---|---|
| Market Size | Revenue (USD Billion) |
| Market size value in 2022 | USD 10.17 Billion |
| Market size value in 2032 | USD 15.53 Billion |
| CAGR (2023 to 2032) | 4.32% |
| Historical data | 2019-2021 |
| Base Year | 2022 |
| Forecast | 2023-2032 |
| Regional Segments | The key regions are North America, South America, Europe, Asia Pacific, and Middle East & Africa. |
| Segments | Key Segments are application, product, and regions |
Asia Pacific region emerged as the largest market for biocides.
The market's growth will be influenced by the increasing demand for clean and potable water.
The stringent regulation on toxic biocides could hamper the market growth.
The increasing application of biocides in various fields will provide huge opportunities to the market.
1. Introduction
1.1. Objectives of the Study
1.2. Market Definition
1.3. Research Scope
1.4. Currency
1.5. Key Target Audience
2. Research Methodology and Assumptions
3. Executive Summary
4. Premium Insights
4.1. Porter’s Five Forces Analysis
4.2. Value Chain Analysis
4.3. Top Investment Pockets
4.3.1. Market Attractiveness Analysis By Application
4.3.2. Market Attractiveness Analysis By Product
4.3.3. Market Attractiveness Analysis By Region
4.4. Industry Trends
5. Market Dynamics
5.1. Market Evaluation
5.2. Market Evaluation
5.3. Drivers
5.3.1. The increasing demand for clean and potable water
5.3.2. The widespread adoption of biocides in the manufacturing of cleaning agents
5.4. Restraints
5.4.1. The variations in the raw material prices
5.4.2. The stringent regulation on toxic biocides
5.5. Opportunities
5.5.1. The increasing application of biocides in various fields
5.5.2. The new product launch by the players
6. Global Biocides Market Analysis and Forecast, By Application
6.1. Segment Overview
6.2. Personal Care
6.3. Water Treatment
6.4. Wood Preservation
6.5. Plastics
6.6. Boilers
6.7. Food & Beverages
6.8. Paints & Coatings
6.9. Oil & Gas
6.10. HVAC
6.11. Pulp & Paper
6.12. Fuels
6.13. Cleaning Products
6.14. Others
7. Global Biocides Market Analysis and Forecast, By Product
7.1. Segment Overview
7.2. Metallic Compounds
7.3. Halogen Compounds
7.4. Organosulfur
7.5. Quaternary Ammonium Compound
7.6. Nitrogen
7.7. Phenolic
7.8. Glutaraldehyde
7.9. Organic Acids
8. Global Biocides Market Analysis and Forecast, By Regional Analysis
8.1. Segment Overview
8.2. North America
8.2.1. U.S.
8.2.2. Canada
8.2.3. Mexico
8.3. Europe
8.3.1. Germany
8.3.2. France
8.3.3. U.K.
8.3.4. Italy
8.3.5. Spain
8.4. Asia-Pacific
8.4.1. Japan
8.4.2. China
8.4.3. India
8.5. South America
8.5.1. Brazil
8.6. Middle East and Africa
8.6.1. UAE
8.6.2. South Africa
9. Global Biocides Market-Competitive Landscape
9.1. Overview
9.2. Market Share of Key Players in Global Biocides Market
9.2.1. Global Company Market Share
9.2.2. North America Company Market Share
9.2.3. Europe Company Market Share
9.2.4. APAC Company Market Share
9.3. Competitive Situations and Trends
9.3.1. Product Launches and Developments
9.3.2. Partnerships, Collaborations, and Agreements
9.3.3. Mergers & Acquisitions
9.3.4. Expansions
10. Company Profiles
10.1. Neogen Corp.
10.1.1. Business Overview
10.1.2. Company Snapshot
10.1.3. Company Market Share Analysis
10.1.4. Company Product Portfolio
10.1.5. Recent Developments
10.1.6. SWOT Analysis
10.2. Troy Corp.
10.2.1. Business Overview
10.2.2. Company Snapshot
10.2.3. Company Market Share Analysis
10.2.4. Company Product Portfolio
10.2.5. Recent Developments
10.2.6. SWOT Analysis
10.3. Finoric LLC
10.3.1. Business Overview
10.3.2. Company Snapshot
10.3.3. Company Market Share Analysis
10.3.4. Company Product Portfolio
10.3.5. Recent Developments
10.3.6. SWOT Analysis
10.4. Shanghai Zhongxin Yuxiang Chemicals Co. Ltd
10.4.1. Business Overview
10.4.2. Company Snapshot
10.4.3. Company Market Share Analysis
10.4.4. Company Product Portfolio
10.4.5. Recent Developments
10.4.6. SWOT Analysis
10.5. Albemarle Corp.
10.5.1. Business Overview
10.5.2. Company Snapshot
10.5.3. Company Market Share Analysis
10.5.4. Company Product Portfolio
10.5.5. Recent Developments
10.5.6. SWOT Analysis
10.6. Iro Group Inc.
10.6.1. Business Overview
10.6.2. Company Snapshot
10.6.3. Company Market Share Analysis
10.6.4. Company Product Portfolio
10.6.5. Recent Developments
10.6.6. SWOT Analysis
10.7. Hubei Jinghong Chemicals Co. Ltd
10.7.1. Business Overview
10.7.2. Company Snapshot
10.7.3. Company Market Share Analysis
10.7.4. Company Product Portfolio
10.7.5. Recent Developments
10.7.6. SWOT Analysis
10.8. Lubrizol
10.8.1. Business Overview
10.8.2. Company Snapshot
10.8.3. Company Market Share Analysis
10.8.4. Company Product Portfolio
10.8.5. Recent Developments
10.8.6. SWOT Analysis
10.9. Solvay SA
10.9.1. Business Overview
10.9.2. Company Snapshot
10.9.3. Company Market Share Analysis
10.9.4. Company Product Portfolio
10.9.5. Recent Developments
10.9.6. SWOT Analysis
10.10. Lonza
10.10.1. Business Overview
10.10.2. Company Snapshot
10.10.3. Company Market Share Analysis
10.10.4. Company Product Portfolio
10.10.5. Recent Developments
10.10.6. SWOT Analysis
10.11. Wuxi Honor Shine Chemical Co. Ltd
10.11.1. Business Overview
10.11.2. Company Snapshot
10.11.3. Company Market Share Analysis
10.11.4. Company Product Portfolio
10.11.5. Recent Developments
10.11.6. SWOT Analysis
10.12. Lanxess AG
10.12.1. Business Overview
10.12.2. Company Snapshot
10.12.3. Company Market Share Analysis
10.12.4. Company Product Portfolio
10.12.5. Recent Developments
10.12.6. SWOT Analysis
10.13. BASF SE
10.13.1. Business Overview
10.13.2. Company Snapshot
10.13.3. Company Market Share Analysis
10.13.4. Company Product Portfolio
10.13.5. Recent Developments
10.13.6. SWOT Analysis
10.14. Chemtreat, Inc
10.14.1. Business Overview
10.14.2. Company Snapshot
10.14.3. Company Market Share Analysis
10.14.4. Company Product Portfolio
10.14.5. Recent Developments
10.14.6. SWOT Analysis
List of Table
1. Global Biocides Market, By Application, 2019-2032 (USD Billion)
2. Global Personal Care, Biocides Market, By Region, 2019-2032 (USD Billion)
3. Global Water Treatment, Biocides Market, By Region, 2019-2032 (USD Billion)
4. Global Wood Preservation, Biocides Market, By Region, 2019-2032 (USD Billion)
5. Global Plastics, Biocides Market, By Region, 2019-2032 (USD Billion)
6. Global Boilers, Biocides Market, By Region, 2019-2032 (USD Billion)
7. Global Food & Beverages, Biocides Market, By Region, 2019-2032 (USD Billion)
8. Global Paints & Coatings, Biocides Market, By Region, 2019-2032 (USD Billion)
9. Global Oil & Gas, Biocides Market, By Region, 2019-2032 (USD Billion)
10. Global HVAC, Biocides Market, By Region, 2019-2032 (USD Billion)
11. Global Pulp & Paper, Biocides Market, By Region, 2019-2032 (USD Billion)
12. Global Fuels, Biocides Market, By Region, 2019-2032 (USD Billion)
13. Global Cleaning Products, Biocides Market, By Region, 2019-2032 (USD Billion)
14. Global Others, Biocides Market, By Region, 2019-2032 (USD Billion)
15. Global Biocides Market, By Product, 2019-2032 (USD Billion)
16. Global Metallic Compounds, Biocides Market, By Region, 2019-2032 (USD Billion)
17. Global Halogen Compounds, Biocides Market, By Region, 2019-2032 (USD Billion)
18. Global Organosulfur, Biocides Market, By Region, 2019-2032 (USD Billion)
19. Global Quaternary Ammonium Compound, Biocides Market, By Region, 2019-2032 (USD Billion)
20. Global Nitrogen, Biocides Market, By Region, 2019-2032 (USD Billion)
21. Global Phenolic, Biocides Market, By Region, 2019-2032 (USD Billion)
22. Global Glutaraldehyde, Biocides Market, By Region, 2019-2032 (USD Billion)
23. Global Organic Acids, Biocides Market, By Region, 2019-2032 (USD Billion)
24. North America Biocides Market, By Application, 2019-2032 (USD Billion)
25. North America Biocides Market, By Product, 2019-2032 (USD Billion)
26. U.S. Biocides Market, By Application, 2019-2032 (USD Billion)
27. U.S. Biocides Market, By Product, 2019-2032 (USD Billion)
28. Canada Biocides Market, By Application, 2019-2032 (USD Billion)
29. Canada Biocides Market, By Product, 2019-2032 (USD Billion)
30. Mexico Biocides Market, By Application, 2019-2032 (USD Billion)
31. Mexico Biocides Market, By Product, 2019-2032 (USD Billion)
32. Europe Biocides Market, By Application, 2019-2032 (USD Billion)
33. Europe Biocides Market, By Product, 2019-2032 (USD Billion)
34. Germany Biocides Market, By Application, 2019-2032 (USD Billion)
35. Germany Biocides Market, By Product, 2019-2032 (USD Billion)
36. France Biocides Market, By Application, 2019-2032 (USD Billion)
37. France Biocides Market, By Product 2019-2032 (USD Billion)
38. U.K. Biocides Market, By Application, 2019-2032 (USD Billion)
39. U.K. Biocides Market, By Product 2019-2032 (USD Billion)
40. Italy Biocides Market, By Application, 2019-2032 (USD Billion)
41. Italy Biocides Market, By Product 2019-2032 (USD Billion)
42. Spain Biocides Market, By Application, 2019-2032 (USD Billion)
43. Spain Biocides Market, By Product 2019-2032 (USD Billion)
44. Asia Pacific Biocides Market, By Application, 2019-2032 (USD Billion)
45. Asia Pacific Biocides Market, By Product 2019-2032 (USD Billion)
46. Japan Biocides Market, By Application, 2019-2032 (USD Billion)
47. Japan Biocides Market, By Product 2019-2032 (USD Billion)
48. China Biocides Market, By Application, 2019-2032 (USD Billion)
49. China Biocides Market, By Product 2019-2032 (USD Billion)
50. India Biocides Market, By Application, 2019-2032 (USD Billion)
51. India Biocides Market, By Product 2019-2032 (USD Billion)
52. South America Biocides Market, By Application, 2019-2032 (USD Billion)
53. South America Biocides Market, By Product 2019-2032 (USD Billion)
54. Brazil Biocides Market, By Application, 2019-2032 (USD Billion)
55. Brazil Biocides Market, By Product 2019-2032 (USD Billion)
56. Middle East and Africa Biocides Market, By Application, 2019-2032 (USD Billion)
57. Middle East and Africa Biocides Market, By Product 2019-2032 (USD Billion)
58. UAE Biocides Market, By Application, 2019-2032 (USD Billion)
59. UAE Biocides Market, By Product 2019-2032 (USD Billion)
60. South Africa Biocides Market, By Application, 2019-2032 (USD Billion)
61. South Africa Biocides Market, By Product 2019-2032 (USD Billion)
List of Figures
1. Global Biocides Market Segmentation
2. Global Biocides Market: Research Methodology
3. Market Size Estimation Methodology: Bottom-Up Approach
4. Market Size Estimation Methodology: Top-Down Approach
5. Data Triangulation
6. Porter’s Five Forces Analysis
7. Value Chain Analysis
8. Global Biocides Market Attractiveness Analysis By Application
9. Global Biocides Market Attractiveness Analysis By Product
10. Global Biocides Market Attractiveness Analysis By Region
11. Global Biocides Market: Dynamics
12. Global Biocides Market Share By Application (2023 & 2032)
13. Global Biocides Market Share By Product (2023 & 2032)
14. Global Biocides Market Share By Regions (2023 & 2032)
15. Global Biocides Market Share By Company (2022)
This study forecasts revenue at global, regional, and country levels from 2019 to 2032. The Brainy Insights has segmented the global biocides based on below mentioned segments:
Global Biocides Market by Distribution Channel:
Global Biocides Market by Product:
Global Biocides by Region:
Research has its special purpose to undertake marketing efficiently. In this competitive scenario, businesses need information across all industry verticals; the information about customer wants, market demand, competition, industry trends, distribution channels etc. This information needs to be updated regularly because businesses operate in a dynamic environment. Our organization, The Brainy Insights incorporates scientific and systematic research procedures in order to get proper market insights and industry analysis for overall business success. The analysis consists of studying the market from a miniscule level wherein we implement statistical tools which helps us in examining the data with accuracy and precision.
Our research reports feature both; quantitative and qualitative aspects for any market. Qualitative information for any market research process are fundamental because they reveal the customer needs and wants, usage and consumption for any product/service related to a specific industry. This in turn aids the marketers/investors in knowing certain perceptions of the customers. Qualitative research can enlighten about the different product concepts and designs along with unique service offering that in turn, helps define marketing problems and generate opportunities. On the other hand, quantitative research engages with the data collection process through interviews, e-mail interactions, surveys and pilot studies. Quantitative aspects for the market research are useful to validate the hypotheses generated during qualitative research method, explore empirical patterns in the data with the help of statistical tools, and finally make the market estimations.
The Brainy Insights offers comprehensive research and analysis, based on a wide assortment of factual insights gained through interviews with CXOs and global experts and secondary data from reliable sources. Our analysts and industry specialist assume vital roles in building up statistical tools and analysis models, which are used to analyse the data and arrive at accurate insights with exceedingly informative research discoveries. The data provided by our organization have proven precious to a diverse range of companies, facilitating them to address issues such as determining which products/services are the most appealing, whether or not customers use the product in the manner anticipated, the purchasing intentions of the market and many others.
Our research methodology encompasses an idyllic combination of primary and secondary initiatives. Key phases involved in this process are listed below:

The phase involves the gathering and collecting of market data and its related information with the help of different sources & research procedures.

The data procurement stage involves in data gathering and collecting through various data sources.
This stage involves in extensive research. These data sources includes:
Purchased Database: Purchased databases play a crucial role in estimating the market sizes irrespective of the domain. Our purchased database includes:
Primary Research: The Brainy Insights interacts with leading companies and experts of the concerned domain to develop the analyst team’s market understanding and expertise. It improves and substantiates every single data presented in the market reports. Primary research mainly involves in telephonic interviews, E-mail interactions and face-to-face interviews with the raw material providers, manufacturers/producers, distributors, & independent consultants. The interviews that we conduct provides valuable data on market size and industry growth trends prevailing in the market. Our organization also conducts surveys with the various industry experts in order to gain overall insights of the industry/market. For instance, in healthcare industry we conduct surveys with the pharmacists, doctors, surgeons and nurses in order to gain insights and key information of a medical product/device/equipment which the customers are going to usage. Surveys are conducted in the form of questionnaire designed by our own analyst team. Surveys plays an important role in primary research because surveys helps us to identify the key target audiences of the market. Additionally, surveys helps to identify the key target audience engaged with the market. Our survey team conducts the survey by targeting the key audience, thus gaining insights from them. Based on the perspectives of the customers, this information is utilized to formulate market strategies. Moreover, market surveys helps us to understand the current competitive situation of the industry. To be precise, our survey process typically involve with the 360 analysis of the market. This analytical process begins by identifying the prospective customers for a product or service related to the market/industry to obtain data on how a product/service could fit into customers’ lives.

Secondary Research: The secondary data sources includes information published by the on-profit organizations such as World bank, WHO, company fillings, investor presentations, annual reports, national government documents, statistical databases, blogs, articles, white papers and others. From the annual report, we analyse a company’s revenue to understand the key segment and market share of that organization in a particular region. We analyse the company websites and adopt the product mapping technique which is important for deriving the segment revenue. In the product mapping method, we select and categorize the products offered by the companies catering to domain specific market, deduce the product revenue for each of the companies so as to get overall estimation of the market size. We also source data and analyses trends based on information received from supply side and demand side intermediaries in the value chain. The supply side denotes the data gathered from supplier, distributor, wholesaler and the demand side illustrates the data gathered from the end customers for respective market domain.

The supply side for a domain specific market is analysed by:
The demand side for the market is estimated through:
In-house Library: Apart from these third-party sources, we have our in-house library of qualitative and quantitative information. Our in-house database includes market data for various industry and domains. These data are updated on regular basis as per the changing market scenario. Our library includes, historic databases, internal audit reports and archives.
Sometimes there are instances where there is no metadata or raw data available for any domain specific market. For those cases, we use our expertise to forecast and estimate the market size in order to generate comprehensive data sets. Our analyst team adopt a robust research technique in order to produce the estimates:
Data Synthesis: This stage involves the analysis & mapping of all the information obtained from the previous step. It also involves in scrutinizing the data for any discrepancy observed while data gathering related to the market. The data is collected with consideration to the heterogeneity of sources. Robust scientific techniques are in place for synthesizing disparate data sets and provide the essential contextual information that can orient market strategies. The Brainy Insights has extensive experience in data synthesis where the data passes through various stages:


Market Deduction & Formulation: The final stage comprises of assigning data points at appropriate market spaces so as to deduce feasible conclusions. Analyst perspective & subject matter expert based holistic form of market sizing coupled with industry analysis also plays a crucial role in this stage.
This stage involves in finalization of the market size and numbers that we have collected from data integration step. With data interpolation, it is made sure that there is no gap in the market data. Successful trend analysis is done by our analysts using extrapolation techniques, which provide the best possible forecasts for the market.
Data Validation & Market Feedback: Validation is the most important step in the process. Validation & re-validation via an intricately designed process helps us finalize data-points to be used for final calculations.

The Brainy Insights interacts with leading companies and experts of the concerned domain to develop the analyst team’s market understanding and expertise. It improves and substantiates every single data presented in the market reports. The data validation interview and discussion panels are typically composed of the most experienced industry members. The participants include, however, are not limited to:
Moreover, we always validate our data and findings through primary respondents from all the major regions we are working on.


Free Customization
Fortune 500 Clients
Free Yearly Update On Purchase Of Multi/Corporate License
Companies Served Till Date