- +1-315-215-1633
- sales@thebrainyinsights.com

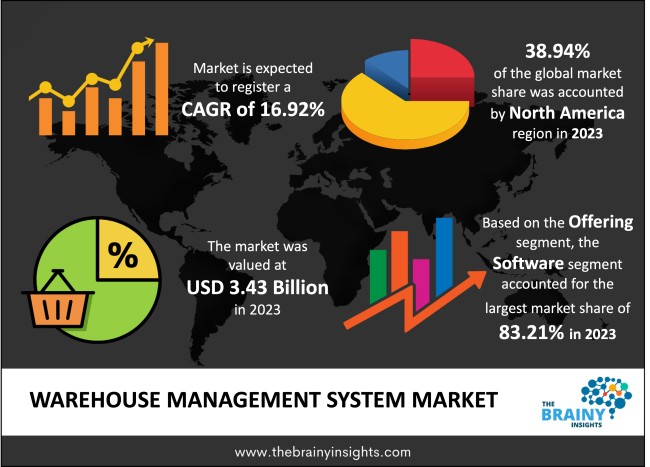
The global warehouse management system market was valued at USD 3.43 Billion in 2023 and grew at a CAGR of 16.92% from 2024 to 2033. The market is expected to reach USD 16.35 Billion by 2033. The demand for efficient logistics services among different end-user industries, such as manufacturing, healthcare, retail, food and beverages, etc., is driving the use of warehouse management systems. Further, favourable government policies and increasing foreign direct investments will provide lucrative opportunities to the market. Rising adoption of automation will act as a key driving factor in the market growth. This is because WMS can perform many tasks with less errors, which will increase the efficiency of the firm. Inventory management can also be done with the help of WMS. This can prevent overstocking and stockouts which will help the company in controlling the losses.
An organization can manage warehouse operations from when products or materials enter a warehouse until they leave using a warehouse management system. A warehouse management system ensures that supplies and items are transported through warehouses most effectively and economically. The warehouse management system manages various tasks, such as picking, inventory tracking, and receiving, in a way that makes these moves possible. Additionally, a warehouse management system offers visibility into an organization's inventory at any time and place, including while it is in transit at a facility. With the help of a warehouse management system, organizations can streamline the complete procedures, ranging from acquiring raw materials to exporting packaged products. WMS helps companies stand out from their competitors. WMS provides a variety of services such as faster order fulfillment and better customer service, which helps companies maximize profits and reduce losses. Faster order fulfillment leads to customer satisfaction which in turn leads to customer retention. In today's competitive world staying ahead of the competitors is very important.
Get an overview of this study by requesting a free sample
Increasing use of digital technology in warehouse management: The benefits of digital warehousing can help businesses increase productivity and efficiency while cutting expenses. The main advantages are improved accuracy and speed, expanded insight into supply chain processes, better customer service, and improved security and compliance. Businesses may more properly track their inventory in real-time using digital warehouse technologies. They can rapidly spot any differences or abnormalities in their supply chain activities due to the adoption of the warehouse management system. Digital warehouses can also assist them in processing shipments more rapidly and responding to consumer demands immediately. Businesses can get a comprehensive view of their supply chain activities due to digital warehouses. This allows them to monitor inventory levels closely, deal with problems as they develop, and spot improvement opportunities.
High investment: Entry-level systems typically cost less than $2,000, whereas enterprise platforms typically cost around $10,000 for installation and customization. Also, the cost of installing on-premise systems can be higher; these providers are more likely to include customized services in the installation package. The warehouse management system's cost depends on the required infrastructure.
Rising investment in the e-commerce industry: The notion that e-commerce will continue to grow rapidly was well-liked during the pandemic. Sales were rising, traffic was surging, and it appeared that e-commerce would succeed. The growth of eCommerce can be attributed to the increasing influence and reach of the online world. Customers frequently prefer eCommerce since they can compare prices between retailers and search for better bargains. Businesses are better equipped to provide these discounts since operating an online store rather than a physical one requires less money and resources. Social media is now intertwined with eCommerce due to platforms like Instagram Shop, Facebook Marketplace, and many more. The e-commerce platforms are beneficial for sellers as most of the customers frequently use these platforms.
The regions analyzed for the market include North America, Europe, South America, Asia Pacific, the Middle East, and Africa. North America emerged as the most significant warehouse management system market, with a 38.94% market revenue share in 2023.
North America region will account for the largest market share with revenue growth. Nations such as the U.S., Canada and Mexico have a tremendous demand for warehouse management systems due to well-developed logistics infrastructure and major e-commerce companies. The regional firms are opting for warehouse management systems to streamline their global operations. Industries such as food and beverages, retail and e-commerce, and healthcare require a continuous supply of products.
North America region Warehouse Management System Market Share in 2023 - 38.94%
www.thebrainyinsights.com
Check the geographical analysis of this market by requesting a free sample
The offering segment is divided into software and services. The software segment dominated the market, with a share of around 83.21% in 2023. The warehouse management software aids businesses in managing and controlling everyday warehouse operations related to supply chain management. WMS software systems provide real-time visibility into a company's complete inventory in transit and warehouses and are a crucial part of supply chain management.
The deployment mode segment is divided into on-premises and cloud. The on-premises segment dominated the market, with a share of around 65.12% in 2023. Software that is hosted and maintained locally utilizing the warehouse's servers is referred to as an on-premise warehouse management system. Due to their flexibility to be tailored to the unique workflows of a warehouse, on-premise systems are considered the industry standard.
The function segment is divided into analytics & optimization, labour management system, billing & yard management, consulting services and systems integration & maintenance. The analytics and optimization segment dominated the market, with a share of around 38.19% in 2023. Warehouse analytics can suggest moving products around or grouping a few frequently ordered products. The warehouses can be efficiently stocked and run more effectively with predictive analytics and optimization, increasing customer satisfaction.
The end-users segment is divided into healthcare, transport and logistics, food and beverages, retail & e-commerce and others. The transport and logistics segment dominated the market, with a share of around 32.05% in 2023. Warehouse management systems have been the mainstays of transportation supply chain technology for decades. Using legacy technology allows transportation providers to manage all aspects of their business through a single piece of software.
| Attribute | Description |
|---|---|
| Market Size | Revenue (USD Billion) |
| Market size value in 2023 | USD 3.43 Billion |
| Market size value in 2033 | USD 16.35 Billion |
| CAGR (2024 to 2033) | 16.92% |
| Historical data | 2020-2022 |
| Base Year | 2023 |
| Forecast | 2024-2033 |
| Region | The regions analyzed for the market are Asia Pacific, Europe, South America, North America, and Middle East & Africa. Furthermore, the regions are further analyzed at the country level. |
| Segments | Offering, Deployment Mode, Function and End-user |
As per The Brainy Insights, the size of the warehouse management system market was valued USD 3.43 billion in 2023 to USD 16.35 billion by 2033.
Global warehouse management system market is growing at a CAGR of 16.92% during the forecast period 2024-2033.
North America region emerged as the largest market for the warehouse management system.
The market's growth will be influenced by the rising usage of warehouse management systems across industries.
The high cost of installation can hamper the market growth.
The rising growth of e-commerce industry is providing lucrative opportunities to the market.
Key players are Körber AG, EPICOR, Infor, Manhattan Associates, Made4net, PSI Logistics, Oracle, SAP, Reply, Synergy Ltd., Softeon, Tecsys, Blue Yonder Group, Inc., IBM among others.
1. Introduction
1.1. Objectives of the Study
1.2. Market Definition
1.3. Research Scope
1.4. Currency
1.5. Key Target Audience
2. Research Methodology and Assumptions
3. Executive Summary
4. Premium Insights
4.1. Porter’s Five Forces Analysis
4.2. Value Chain Analysis
4.3. Top Investment Pockets
4.3.1. Market Attractiveness Analysis by Offering
4.3.2. Market Attractiveness Analysis by Deployment Mode
4.3.3. Market Attractiveness Analysis by Function
4.3.4. Market Attractiveness Analysis by End-users
4.3.5. Market Attractiveness Analysis by Region
4.4. Industry Trends
5. Market Dynamics
5.1. Market Evaluation
5.2. Drivers
5.2.1. Increasing usage of warehouse management system in different end-users
5.3. Restraints
5.3.1. High instalment cost
5.4. Opportunities
5.4.1. Increasing growth of e-commerce industry
5.5. Challenges
5.5.1. Lack of awareness
6. Global Warehouse Management System Market Analysis and Forecast, By Offering
6.1. Segment Overview
6.2. Software
6.3. Services
7. Global Warehouse Management System Market Analysis and Forecast, By Deployment Mode
7.1. Segment Overview
7.2. On-Premises
7.3. Cloud
8. Global Warehouse Management System Market Analysis and Forecast, By Function
8.1. Segment Overview
8.2. Analytics & Optimization
8.3. Labor Management System
8.4. Billing & Yard Management
8.5. Consulting Services
8.6. Systems Integration & Maintenance
9. Global Warehouse Management System Market Analysis and Forecast, By End-users
9.1. Segment Overview
9.2. Healthcare
9.3. Transport & Logistics
9.4. Food & Beverages
9.5. Retail & E-commerce
9.6. Others
10. Global Warehouse Management System Market Analysis and Forecast, By Regional Analysis
10.1. Segment Overview
10.2. North America
10.2.1. U.S.
10.2.2. Canada
10.2.3. Mexico
10.3. Europe
10.3.1. Germany
10.3.2. France
10.3.3. U.K.
10.3.4. Italy
10.3.5. Spain
10.4. Asia-Pacific
10.4.1. Japan
10.4.2. China
10.4.3. India
10.5. South America
10.5.1. Brazil
10.6. Middle East and Africa
10.6.1. UAE
10.6.2. South Africa
11. Global Warehouse Management System Market-Competitive Landscape
11.1. Overview
11.2. Market Share of Key Players in the Warehouse Management System Market
11.2.1. Global Company Market Share
11.2.2. North America Company Market Share
11.2.3. Europe Company Market Share
11.2.4. APAC Company Market Share
11.3. Competitive Situations and Trends
11.3.1. Product Launches and Developments
11.3.2. Partnerships, Collaborations, and Agreements
11.3.3. Mergers & Acquisitions
11.3.4. Expansions
12. Company Profiles
12.1. Körber AG
12.1.1. Business Overview
12.1.2. Company Snapshot
12.1.3. Company Market Share Analysis
12.1.4. Company Product Portfolio
12.1.5. Recent Developments
12.1.6. SWOT Analysis
12.2. EPICOR
12.2.1. Business Overview
12.2.2. Company Snapshot
12.2.3. Company Market Share Analysis
12.2.4. Company Product Portfolio
12.2.5. Recent Developments
12.2.6. SWOT Analysis
12.3. Infor
12.3.1. Business Overview
12.3.2. Company Snapshot
12.3.3. Company Market Share Analysis
12.3.4. Company Product Portfolio
12.3.5. Recent Developments
12.3.6. SWOT Analysis
12.4. Manhattan Associates
12.4.1. Business Overview
12.4.2. Company Snapshot
12.4.3. Company Market Share Analysis
12.4.4. Company Product Portfolio
12.4.5. Recent Developments
12.4.6. SWOT Analysis
12.5. Made4net
12.5.1. Business Overview
12.5.2. Company Snapshot
12.5.3. Company Market Share Analysis
12.5.4. Company Product Portfolio
12.5.5. Recent Developments
12.5.6. SWOT Analysis
12.6. PSI Logistics
12.6.1. Business Overview
12.6.2. Company Snapshot
12.6.3. Company Market Share Analysis
12.6.4. Company Product Portfolio
12.6.5. Recent Developments
12.6.6. SWOT Analysis
12.7. Oracle
12.7.1. Business Overview
12.7.2. Company Snapshot
12.7.3. Company Market Share Analysis
12.7.4. Company Product Portfolio
12.7.5. Recent Developments
12.7.6. SWOT Analysis
12.8. SAP
12.8.1. Business Overview
12.8.2. Company Snapshot
12.8.3. Company Market Share Analysis
12.8.4. Company Product Portfolio
12.8.5. Recent Developments
12.8.6. SWOT Analysis
12.9. Reply
12.9.1. Business Overview
12.9.2. Company Snapshot
12.9.3. Company Market Share Analysis
12.9.4. Company Product Portfolio
12.9.5. Recent Developments
12.9.6. SWOT Analysis
12.10. Synergy Ltd.
12.10.1. Business Overview
12.10.2. Company Snapshot
12.10.3. Company Market Share Analysis
12.10.4. Company Product Portfolio
12.10.5. Recent Developments
12.10.6. SWOT Analysis
12.11. Softeon
12.11.1. Business Overview
12.11.2. Company Snapshot
12.11.3. Company Market Share Analysis
12.11.4. Company Product Portfolio
12.11.5. Recent Developments
12.11.6. SWOT Analysis
12.12. Tecsys
12.12.1. Business Overview
12.12.2. Company Snapshot
12.12.3. Company Market Share Analysis
12.12.4. Company Product Portfolio
12.12.5. Recent Developments
12.12.6. SWOT Analysis
12.13. Blue Yonder Group, Inc.
12.13.1. Business Overview
12.13.2. Company Snapshot
12.13.3. Company Market Share Analysis
12.13.4. Company Product Portfolio
12.13.5. Recent Developments
12.13.6. SWOT Analysis
12.14. IBM
12.14.1. Business Overview
12.14.2. Company Snapshot
12.14.3. Company Market Share Analysis
12.14.4. Company Product Portfolio
12.14.5. Recent Developments
12.14.6. SWOT Analysis
List of Table
1. Global Warehouse Management System Market, By Offering, 2020-2033 (USD Billion)
2. Global Software, Warehouse Management System Market, By Region, 2020-2033 (USD Billion)
3. Global Services, Warehouse Management System Market, By Region, 2020-2033 (USD Billion)
4. Global Warehouse Management System Market, By Deployment Mode, 2020-2033 (USD Billion)
5. Global On-premises, Warehouse Management System Market, By Region, 2020-2033 (USD Billion)
6. Global Cloud, Warehouse Management System Market, By Region, 2020-2033 (USD Billion)
7. Global Warehouse Management System Market, By Function, 2020-2033 (USD Billion)
8. Global Analytics & Optimization, Warehouse Management System Market, By Region, 2020-2033 (USD Billion)
9. Global Labor Management System, Warehouse Management System Market, By Region, 2020-2033 (USD Billion)
10. Global Billing & Yard Management, Warehouse Management System Market, By Region, 2020-2033 (USD Billion)
11. Global Consulting Services, Warehouse Management System Market, By Region, 2020-2033 (USD Billion)
12. Global Systems Integration & Maintenance, Warehouse Management System Market, By Region, 2020-2033 (USD Billion)
13. Global Warehouse Management System Market, By End-users, 2020-2033 (USD Billion)
14. Global Healthcare, Warehouse Management System Market, By Region, 2020-2033 (USD Billion)
15. Global Transport & Logistics, Warehouse Management System Market, By Region, 2020-2033 (USD Billion)
16. Global Food & Beverages, Warehouse Management System Market, By Region, 2020-2033 (USD Billion)
17. Global Retail & E-commerce, Warehouse Management System Market, By Region, 2020-2033 (USD Billion)
18. Global Others, Warehouse Management System Market, By Region, 2020-2033 (USD Billion)
19. Global Warehouse Management System Market, By Region, 2020-2033 (USD Billion)
20. North America Warehouse Management System Market, By Offering, 2020-2033 (USD Billion)
21. North America Warehouse Management System Market, By Deployment Mode, 2020-2033 (USD Billion)
22. North America Warehouse Management System Market, By Function, 2020-2033 (USD Billion)
23. North America Warehouse Management System Market, By End-users, 2020-2033 (USD Billion)
24. U.S. Warehouse Management System Market, By Offering, 2020-2033 (USD Billion)
25. U.S. Warehouse Management System Market, By Deployment Mode, 2020-2033 (USD Billion)
26. U.S. Warehouse Management System Market, By Function, 2020-2033 (USD Billion)
27. U.S. Warehouse Management System Market, By End-users, 2020-2033 (USD Billion)
28. Canada Warehouse Management System Market, By Offering, 2020-2033 (USD Billion)
29. Canada Warehouse Management System Market, By Deployment Mode, 2020-2033 (USD Billion)
30. Canada Warehouse Management System Market, By Function, 2020-2033 (USD Billion)
31. Canada Warehouse Management System Market, By End-users, 2020-2033 (USD Billion)
32. Mexico Warehouse Management System Market, By Offering, 2020-2033 (USD Billion)
33. Mexico Warehouse Management System Market, By Deployment Mode, 2020-2033 (USD Billion)
34. Mexico Warehouse Management System Market, By Function, 2020-2033 (USD Billion)
35. Mexico Warehouse Management System Market, By End-users, 2020-2033 (USD Billion)
36. Europe Warehouse Management System Market, By Offering, 2020-2033 (USD Billion)
37. Europe Warehouse Management System Market, By Deployment Mode, 2020-2033 (USD Billion)
38. Europe Warehouse Management System Market, By Function, 2020-2033 (USD Billion)
39. Europe Warehouse Management System Market, By End-users, 2020-2033 (USD Billion)
40. Germany Warehouse Management System Market, By Offering, 2020-2033 (USD Billion)
41. Germany Warehouse Management System Market, By Deployment Mode, 2020-2033 (USD Billion)
42. Germany Warehouse Management System Market, By Function, 2020-2033 (USD Billion)
43. Germany Warehouse Management System Market, By End-users, 2020-2033 (USD Billion)
44. France Warehouse Management System Market, By Offering, 2020-2033 (USD Billion)
45. France Warehouse Management System Market, By Deployment Mode, 2020-2033 (USD Billion)
46. France Warehouse Management System Market, By Function, 2020-2033 (USD Billion)
47. France Warehouse Management System Market, By End-users, 2020-2033 (USD Billion)
48. U.K. Warehouse Management System Market, By Offering, 2020-2033 (USD Billion)
49. U.K. Warehouse Management System Market, By Deployment Mode, 2020-2033 (USD Billion)
50. U.K. Warehouse Management System Market, By Function, 2020-2033 (USD Billion)
51. U.K. Warehouse Management System Market, By End-users, 2020-2033 (USD Billion)
52. Italy Warehouse Management System Market, By Offering, 2020-2033 (USD Billion)
53. Italy Warehouse Management System Market, By Deployment Mode, 2020-2033 (USD Billion)
54. Italy Warehouse Management System Market, By Function, 2020-2033 (USD Billion)
55. Italy Warehouse Management System Market, By End-users, 2020-2033 (USD Billion)
56. Spain Warehouse Management System Market, By Offering, 2020-2033 (USD Billion)
57. Spain Warehouse Management System Market, By Deployment Mode, 2020-2033 (USD Billion)
58. Spain Warehouse Management System Market, By Function, 2020-2033 (USD Billion)
59. Spain Warehouse Management System Market, By End-users, 2020-2033 (USD Billion)
60. Asia Pacific Warehouse Management System Market, By Offering, 2020-2033 (USD Billion)
61. Asia Pacific Warehouse Management System Market, By Deployment Mode, 2020-2033 (USD Billion)
62. Asia Pacific Warehouse Management System Market, By Function, 2020-2033 (USD Billion)
63. Asia Pacific Warehouse Management System Market, By End-users, 2020-2033 (USD Billion)
64. Japan Warehouse Management System Market, By Offering, 2020-2033 (USD Billion)
65. Japan Warehouse Management System Market, By Deployment Mode, 2020-2033 (USD Billion)
66. Japan Warehouse Management System Market, By Function, 2020-2033 (USD Billion)
67. Japan Warehouse Management System Market, By End-users, 2020-2033 (USD Billion)
68. China Warehouse Management System Market, By Offering, 2020-2033 (USD Billion)
69. China Warehouse Management System Market, By Deployment Mode, 2020-2033 (USD Billion)
70. China Warehouse Management System Market, By Function, 2020-2033 (USD Billion)
71. China Warehouse Management System Market, By End-users, 2020-2033 (USD Billion)
72. India Warehouse Management System Market, By Offering, 2020-2033 (USD Billion)
73. India Warehouse Management System Market, By Deployment Mode, 2020-2033 (USD Billion)
74. India Warehouse Management System Market, By Function, 2020-2033 (USD Billion)
75. India Warehouse Management System Market, By End-users, 2020-2033 (USD Billion)
76. South America Warehouse Management System Market, By Offering, 2020-2033 (USD Billion)
77. South America Warehouse Management System Market, By Deployment Mode, 2020-2033 (USD Billion)
78. South America Warehouse Management System Market, By Function, 2020-2033 (USD Billion)
79. South America Warehouse Management System Market, By End-users, 2020-2033 (USD Billion)
80. Brazil Warehouse Management System Market, By Offering, 2020-2033 (USD Billion)
81. Brazil Warehouse Management System Market, By Deployment Mode, 2020-2033 (USD Billion)
82. Brazil Warehouse Management System Market, By Function, 2020-2033 (USD Billion)
83. Brazil Warehouse Management System Market, By End-users, 2020-2033 (USD Billion)
84. Middle East and Africa Warehouse Management System Market, By Offering, 2020-2033 (USD Billion)
85. Middle East and Africa Warehouse Management System Market, By Deployment Mode, 2020-2033 (USD Billion)
86. Middle East and Africa Warehouse Management System Market, By Function, 2020-2033 (USD Billion)
87. Middle East and Africa Warehouse Management System Market, By End-users, 2020-2033 (USD Billion)
88. UAE Warehouse Management System Market, By Offering, 2020-2033 (USD Billion)
89. UAE Warehouse Management System Market, By Deployment Mode, 2020-2033 (USD Billion)
90. UAE Warehouse Management System Market, By Function, 2020-2033 (USD Billion)
91. UAE Warehouse Management System Market, By End-users, 2020-2033 (USD Billion)
92. South Africa Warehouse Management System Market, By Offering, 2020-2033 (USD Billion)
93. South Africa Warehouse Management System Market, By Deployment Mode, 2020-2033 (USD Billion)
94. South Africa Warehouse Management System Market, By Function, 2020-2033 (USD Billion)
95. South Africa Warehouse Management System Market, By End-users, 2020-2033 (USD Billion)
List of Figures
1. Global Warehouse Management System Market Segmentation
2. Warehouse Management System Market: Research Methodology
3. Market Size Estimation Methodology: Bottom-Up Approach
4. Market Size Estimation Methodology: Top-Down Approach
5. Data Triangulation
6. Porter’s Five Forces Analysis
7. Value Chain Analysis
8. Global Warehouse Management System Market Attractiveness Analysis by Offering
9. Global Warehouse Management System Market Attractiveness Analysis by Deployment Mode
10. Global Warehouse Management System Market Attractiveness Analysis by Function
11. Global Warehouse Management System Market Attractiveness Analysis by End-users
12. Global Warehouse Management System Market Attractiveness Analysis by Region
13. Global Warehouse Management System Market: Dynamics
14. Global Warehouse Management System Market Share by Offering (2023 & 2033)
15. Global Warehouse Management System Market Share by Deployment Mode (2023 & 2033)
16. Global Warehouse Management System Market Share by Function (2023 & 2033)
17. Global Warehouse Management System Market Share by End-users (2023 & 2033)
18. Global Warehouse Management System Market Share by Regions (2023 & 2033)
19. Global Warehouse Management System Market Share by Company (2023)
This study forecasts revenue at global, regional, and country levels from 2019 to 2032. The Brainy Insights has segmented the global warehouse management system market based on below mentioned segments:
Global Warehouse Management System Market by Offering:
Global Warehouse Management System Market by Deployment Mode:
Global Warehouse Management System Market by Function:
Global Warehouse Management System Market by End-users:
Global Warehouse Management System Market by Region:
Research has its special purpose to undertake marketing efficiently. In this competitive scenario, businesses need information across all industry verticals; the information about customer wants, market demand, competition, industry trends, distribution channels etc. This information needs to be updated regularly because businesses operate in a dynamic environment. Our organization, The Brainy Insights incorporates scientific and systematic research procedures in order to get proper market insights and industry analysis for overall business success. The analysis consists of studying the market from a miniscule level wherein we implement statistical tools which helps us in examining the data with accuracy and precision.
Our research reports feature both; quantitative and qualitative aspects for any market. Qualitative information for any market research process are fundamental because they reveal the customer needs and wants, usage and consumption for any product/service related to a specific industry. This in turn aids the marketers/investors in knowing certain perceptions of the customers. Qualitative research can enlighten about the different product concepts and designs along with unique service offering that in turn, helps define marketing problems and generate opportunities. On the other hand, quantitative research engages with the data collection process through interviews, e-mail interactions, surveys and pilot studies. Quantitative aspects for the market research are useful to validate the hypotheses generated during qualitative research method, explore empirical patterns in the data with the help of statistical tools, and finally make the market estimations.
The Brainy Insights offers comprehensive research and analysis, based on a wide assortment of factual insights gained through interviews with CXOs and global experts and secondary data from reliable sources. Our analysts and industry specialist assume vital roles in building up statistical tools and analysis models, which are used to analyse the data and arrive at accurate insights with exceedingly informative research discoveries. The data provided by our organization have proven precious to a diverse range of companies, facilitating them to address issues such as determining which products/services are the most appealing, whether or not customers use the product in the manner anticipated, the purchasing intentions of the market and many others.
Our research methodology encompasses an idyllic combination of primary and secondary initiatives. Key phases involved in this process are listed below:

The phase involves the gathering and collecting of market data and its related information with the help of different sources & research procedures.

The data procurement stage involves in data gathering and collecting through various data sources.
This stage involves in extensive research. These data sources includes:
Purchased Database: Purchased databases play a crucial role in estimating the market sizes irrespective of the domain. Our purchased database includes:
Primary Research: The Brainy Insights interacts with leading companies and experts of the concerned domain to develop the analyst team’s market understanding and expertise. It improves and substantiates every single data presented in the market reports. Primary research mainly involves in telephonic interviews, E-mail interactions and face-to-face interviews with the raw material providers, manufacturers/producers, distributors, & independent consultants. The interviews that we conduct provides valuable data on market size and industry growth trends prevailing in the market. Our organization also conducts surveys with the various industry experts in order to gain overall insights of the industry/market. For instance, in healthcare industry we conduct surveys with the pharmacists, doctors, surgeons and nurses in order to gain insights and key information of a medical product/device/equipment which the customers are going to usage. Surveys are conducted in the form of questionnaire designed by our own analyst team. Surveys plays an important role in primary research because surveys helps us to identify the key target audiences of the market. Additionally, surveys helps to identify the key target audience engaged with the market. Our survey team conducts the survey by targeting the key audience, thus gaining insights from them. Based on the perspectives of the customers, this information is utilized to formulate market strategies. Moreover, market surveys helps us to understand the current competitive situation of the industry. To be precise, our survey process typically involve with the 360 analysis of the market. This analytical process begins by identifying the prospective customers for a product or service related to the market/industry to obtain data on how a product/service could fit into customers’ lives.

Secondary Research: The secondary data sources includes information published by the on-profit organizations such as World bank, WHO, company fillings, investor presentations, annual reports, national government documents, statistical databases, blogs, articles, white papers and others. From the annual report, we analyse a company’s revenue to understand the key segment and market share of that organization in a particular region. We analyse the company websites and adopt the product mapping technique which is important for deriving the segment revenue. In the product mapping method, we select and categorize the products offered by the companies catering to domain specific market, deduce the product revenue for each of the companies so as to get overall estimation of the market size. We also source data and analyses trends based on information received from supply side and demand side intermediaries in the value chain. The supply side denotes the data gathered from supplier, distributor, wholesaler and the demand side illustrates the data gathered from the end customers for respective market domain.

The supply side for a domain specific market is analysed by:
The demand side for the market is estimated through:
In-house Library: Apart from these third-party sources, we have our in-house library of qualitative and quantitative information. Our in-house database includes market data for various industry and domains. These data are updated on regular basis as per the changing market scenario. Our library includes, historic databases, internal audit reports and archives.
Sometimes there are instances where there is no metadata or raw data available for any domain specific market. For those cases, we use our expertise to forecast and estimate the market size in order to generate comprehensive data sets. Our analyst team adopt a robust research technique in order to produce the estimates:
Data Synthesis: This stage involves the analysis & mapping of all the information obtained from the previous step. It also involves in scrutinizing the data for any discrepancy observed while data gathering related to the market. The data is collected with consideration to the heterogeneity of sources. Robust scientific techniques are in place for synthesizing disparate data sets and provide the essential contextual information that can orient market strategies. The Brainy Insights has extensive experience in data synthesis where the data passes through various stages:


Market Deduction & Formulation: The final stage comprises of assigning data points at appropriate market spaces so as to deduce feasible conclusions. Analyst perspective & subject matter expert based holistic form of market sizing coupled with industry analysis also plays a crucial role in this stage.
This stage involves in finalization of the market size and numbers that we have collected from data integration step. With data interpolation, it is made sure that there is no gap in the market data. Successful trend analysis is done by our analysts using extrapolation techniques, which provide the best possible forecasts for the market.
Data Validation & Market Feedback: Validation is the most important step in the process. Validation & re-validation via an intricately designed process helps us finalize data-points to be used for final calculations.

The Brainy Insights interacts with leading companies and experts of the concerned domain to develop the analyst team’s market understanding and expertise. It improves and substantiates every single data presented in the market reports. The data validation interview and discussion panels are typically composed of the most experienced industry members. The participants include, however, are not limited to:
Moreover, we always validate our data and findings through primary respondents from all the major regions we are working on.


Free Customization
Fortune 500 Clients
Free Yearly Update On Purchase Of Multi/Corporate License
Companies Served Till Date