- +1-315-215-1633
- sales@thebrainyinsights.com

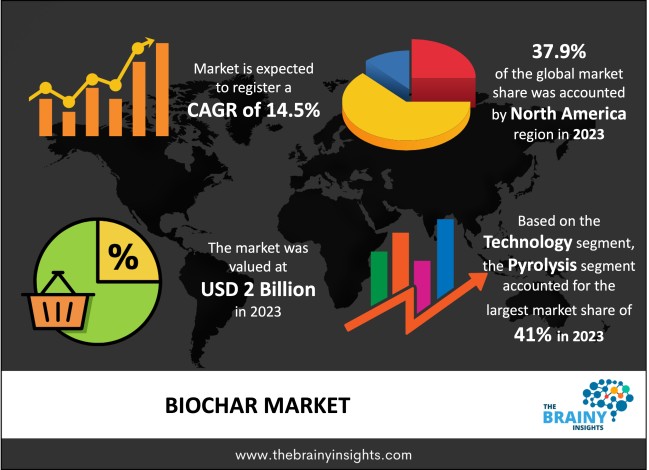
The global biochar market was valued at USD 2 billion in 2023 and is anticipated to grow at a CAGR of 14.5% from 2024 to 2033. The global biochar market is expected to reach USD 7.7 billion by 2033. North America is expected to grow the fastest during the forecast period. Biochar is also used to improve the quality of soil. Biochar increases nutrients in the soil, which can reduce the use of chemical fertilizers, which will not harm the health of the soil. Organic farming is very popular these days. This is why it is also being adopted. Biochar is also used in organic farming. With its help, the quality of the soil can be improved. Biochar also benefits the environment. Biochar removes carbon dioxide from the atmosphere, which can lead to changes in the climate.
The term "biochar" describes the fine-grained biomass produced by burning wood, animal manure, waste from forests, and other agricultural byproducts in an atmosphere with little oxygen. It is a porous material that can keep nutrients and water in the soil for plant uptake. In addition to increasing soil carbon sequestration, biochar primarily lowers pollution levels, hazardous substances in the ground, and soil leaching. When looking at the long-term effects, biochar has the potential to dramatically lessen the atmospheric greenhouse effect while also enhancing water quality and agricultural output. Biochar is charcoal produced by carefully heating waste products, including animal dung, wood refuse, and agricultural waste. More significant opportunities for market expansion are anticipated to result from environmental awareness, lower raw material costs, and unified government policies for waste management. Expanding agriculture is one of the leading forces propelling the global biochar market. The demand for biochar in the agricultural industry is strongly influenced by rising consumer desire for natural and organic food products and a growing need to improve soil fertility and crop growth. Additionally, organic farming methods are increasingly popular as a strategy for sustainable development. Rising urbanisation in developing countries has favoured biochar's adoption as a suitable alternative to chemical fertilisers. In addition, the use of biochar as insulation in the construction sector, for energy storage in supercapacitors, for the production of food packaging material, as a feed additive, and as an air purifier is boosting industry growth. In the upcoming years, it is anticipated that additional factors, such as extensive research and development (R&D) and the implementation of favourable government policies to encourage the use of biochar to increase land productivity, will further propel the market. Due to the absence of many large-scale manufacturers and the rising number of small- and medium-sized businesses, particularly in North America, the industry is divided into organised and unorganised sectors. Due to a lack of knowledge about the advantages of the products and their long-term benefits, the economies of the Asia Pacific and Middle Eastern countries are predicted to grow more slowly. High-quality biochar must be produced with significant financial commitment. It caused several businesses to abandon the industry during the past several years. In cooperation with research organisations and institutions, a sizable portion of this product is produced in rural areas of nations like China, Japan, Brazil, and Mexico. Biochar benefits farmers by making the soil very fertile. It also helps the farmers to grow healthy crops, increasing the land's productivity and profits.
Get an overview of this study by requesting a free sample
Burgeoning usage for various applications – Sales of biochar as a charcoal substitute and its developing utility in power generation are primarily driven by its rising popularity. Non-energy uses continue to increase demand for biochar. The agriculture market is driven by biochar's carbon sequestration and water retention capabilities. Government agencies' continued study in this field is anticipated to lead to an increase in the industrial applications of biochar. The market is expanding because of rising gasification system adoption, rising biochar sales in agriculture, and rising demand for biochar in the production of power.
Growing demand for environment-friendly products - Carbon dioxide levels in the atmosphere rise due to the combustion of fossil fuels and the breakdown of biomass. However, because biochar may retain up to 50% of the carbon from its feedstock, adding it to these soils can help reduce carbon dioxide emissions. By doing this, organic decomposition's carbon dioxide emissions are significantly reduced. It's crucial for controlling soil emissions of methane and nitric oxide. Utilizing biochar in the soil can aid in lowering off-site pollution. It enhances the soil's capacity to hold onto nutrients like nitrogen and phosphorus. This lessens soil nutrient loss to groundwater and aids in preventing nutrient loss from surface water flow-induced erosion.
High costs of biochar - The manufacture of biochar is a pricey process that requires a range of high-end, expensive pyrolysis equipment. Furthermore, it costs money to store and transport the pyrolysis gas produced during the manufacturing of biochar since it needs an oxygen-free environment kept at a certain temperature. Because of this, it is challenging for producers with low starting capital to enter the biochar industry.
Development of biochar - The market players have more lucrative chances due to the increased interest in turning biochar into novel goods based on its distinct chemical features. For example, activated carbon, which is frequently used in wastewater treatment facilities to absorb impurities and minimise odours, might be replaced with it.
Technological barriers - A further drawback for the biochar industry will be the technological limitations in far-off places. As a result, this element will pose a threat to the growth pace of the biochar industry. Additionally, it is predicted that the market expansion will be constrained by the lack of understanding about the benefits of the product.
The regions analyzed for the market include North America, Europe, South America, Asia Pacific, the Middle East, and Africa. North America emerged as the largest market for the global biochar market, with a 37.9% share of the market revenue in 2023.
Due to its high meat consumption and rising desire for organic food, North America has been the region that has consumed most of the product. In comparison to other areas, awareness of biochar is exceptionally high in this one, and the farming community is more informed about the product and its advantages. Additionally, it is anticipated that decreasing livestock feed costs would increase usage in this industry. Due to widespread product knowledge in the nation, the U.S. has been producing the highest income globally. Many domestic and foreign small and big-scale manufacturers have facilitated the market's growth.
The Asia Pacific is expected to be the fastest-growing region. Due to a sizable and expanding agriculture sector in rising nations like China and India, the Asia Pacific region is predicted to have extraordinarily high development. It is anticipated that several R&D projects and government initiatives will help raise awareness of biochar and its advantages among farmers, enhancing demand. The third-largest producer of organic foods worldwide is China. Adopting genetically modified crops has impacted the country's agricultural areas' soil and crop yield. It is anticipated that a combination of biochar in farming, driven by many national research projects, will raise awareness of the product and spur consumption.
North America Region Biochar Market Share in 2023 - 37.9%
www.thebrainyinsights.com
Check the geographical analysis of this market by requesting a free sample
The technology segment is divided into pyrolysis, gasification systems, and others. The pyrolysis segment dominated, with a market share of around 41% in 2023. Pyrolysis is the most productive manufacturing technology now accessible because of its high end-product yield, high carbon content, and process stability, which propels the segment’s growth.
The application segment is divided into agriculture, animal farming, industrial uses, and others. Over the forecast period, the agriculture segment is expected to grow at the fastest CAGR of 15.8%. By increasing the soil's biological productivity and water and nutrient holding capacity, biochar aids in supplying crops with nourishment and hastening growth. This is expected to drive the segment’s growth.
| Attribute | Description |
|---|---|
| Market Size | Revenue (USD Billion) |
| Market size value in 2023 | USD 2 Billion |
| Market size value in 2033 | USD 7.7 Billion |
| CAGR (2024 to 2033) | 14.5% |
| Historical data | 2020-2022 |
| Base Year | 2023 |
| Forecast | 2024-2033 |
| Regional Segments | North America, Asia Pacific, Europe, Latin America, Middle East and Africa |
| Segments | Technology, Application |
As per The Brainy Insights, the size of the Biochar market was valued at USD 2 billion in 2023 to USD 7.7 billion by 2033.
The global biochar market is growing at a CAGR of 14.5% during the forecast period 2024-2033.
North America emerged as the largest market for biochar.
1. Introduction
1.1. Objectives of the Study
1.2. Market Definition
1.3. Research Scope
1.4. Currency
1.5. Key Target Audience
2. Research Methodology and Assumptions
3. Executive Summary
4. Premium Insights
4.1. Porter’s Five Forces Analysis
4.2. Value Chain Analysis
4.3. Top Investment Pockets
4.3.1. Market Attractiveness Analysis By Technology
4.3.2. Market Attractiveness Analysis By Application
4.3.3. Market Attractiveness Analysis By Region
4.4. Industry Trends
5. Market Dynamics
5.1. Market Evaluation
5.2. Drivers
5.2.1. Burgeoning Usage for various Applications
5.2.2. Growing Demand for Environment-Friendly Products
5.3. Restraints
5.3.1. High Costs of Biochar
5.4. Opportunities
5.4.1. Development of Biochars
5.5. Challenges
5.5.1. Technological Barriers
6. Global Biochar Market Analysis and Forecast, By Technology
6.1. Segment Overview
6.2. Pyrolysis
6.3. Gasification Systems
6.4. Others
7. Global Biochar Market Analysis and Forecast, By Application
7.1. Segment Overview
7.2. Agriculture
7.3. Animal Farming
7.4. Industrial Uses
7.5. Others
8. Global Biochar Market Analysis and Forecast, By Regional Analysis
8.1. Segment Overview
8.2. North America
8.2.1. U.S.
8.2.2. Canada
8.2.3. Mexico
8.3. Europe
8.3.1. Germany
8.3.2. France
8.3.3. U.K.
8.3.4. Italy
8.3.5. Spain
8.4. Asia-Pacific
8.4.1. Japan
8.4.2. China
8.4.3. India
8.5. South America
8.5.1. Brazil
8.6. Middle East and Africa
8.6.1. UAE
8.6.2. South Africa
9. Global Biochar Market-Competitive Landscape
9.1. Overview
9.2. Market Share of Key Players in Global Biochar Market
9.2.1. Global Company Market Share
9.2.2. North America Company Market Share
9.2.3. Europe Company Market Share
9.2.4. APAC Company Market Share
9.3. Competitive Situations and Trends
9.3.1. Product Launches and Developments
9.3.2. Partnerships, Collaborations, and Agreements
9.3.3. Mergers & Acquisitions
9.3.4. Expansions
10. Company Profiles
10.1. Black Owl Biochar
10.1.1. Business Overview
10.1.2. Company Snapshot
10.1.3. Company Market Share Analysis
10.1.4. Company Product Portfolio
10.1.5. Recent Developments
10.1.6. SWOT Analysis
10.2. CharGrow USA LLC
10.2.1. Business Overview
10.2.2. Company Snapshot
10.2.3. Company Market Share Analysis
10.2.4. Company Product Portfolio
10.2.5. Recent Developments
10.2.6. SWOT Analysis
10.3. Cool Planet
10.3.1. Business Overview
10.3.2. Company Snapshot
10.3.3. Company Market Share Analysis
10.3.4. Company Product Portfolio
10.3.5. Recent Developments
10.3.6. SWOT Analysis
10.4. Earth Systems Consulting Pty Ltd
10.4.1. Business Overview
10.4.2. Company Snapshot
10.4.3. Company Market Share Analysis
10.4.4. Company Product Portfolio
10.4.5. Recent Developments
10.4.6. SWOT Analysis
10.5. Pacific Biochar Benefit Corporation.
10.5.1. Business Overview
10.5.2. Company Snapshot
10.5.3. Company Market Share Analysis
10.5.4. Company Product Portfolio
10.5.5. Recent Developments
10.5.6. SWOT Analysis
10.6. Pacific Pyrolysis Pty Ltd
10.6.1. Business Overview
10.6.2. Company Snapshot
10.6.3. Company Market Share Analysis
10.6.4. Company Product Portfolio
10.6.5. Recent Developments
10.6.6. SWOT Analysis
10.7. Phoenix Energy
10.7.1. Business Overview
10.7.2. Company Snapshot
10.7.3. Company Market Share Analysis
10.7.4. Company Product Portfolio
10.7.5. Recent Developments
10.7.6. SWOT Analysis
10.8. Arstaeco
10.8.1. Business Overview
10.8.2. Company Snapshot
10.8.3. Company Market Share Analysis
10.8.4. Company Product Portfolio
10.8.5. Recent Developments
10.8.6. SWOT Analysis
10.9. Genesis Industries Inc
10.9.1. Business Overview
10.9.2. Company Snapshot
10.9.3. Company Market Share Analysis
10.9.4. Company Product Portfolio
10.9.5. Recent Developments
10.9.6. SWOT Analysis
10.10. Biochar Now, L.L.C.
10.10.1. Business Overview
10.10.2. Company Snapshot
10.10.3. Company Market Share Analysis
10.10.4. Company Product Portfolio
10.10.5. Recent Developments
10.10.6. SWOT Analysis
10.11. Airex Énergie Inc.
10.11.1. Business Overview
10.11.2. Company Snapshot
10.11.3. Company Market Share Analysis
10.11.4. Company Product Portfolio
10.11.5. Recent Developments
10.11.6. SWOT Analysis
10.12. American BioChar Company.
10.12.1. Business Overview
10.12.2. Company Snapshot
10.12.3. Company Market Share Analysis
10.12.4. Company Product Portfolio
10.12.5. Recent Developments
10.12.6. SWOT Analysis
10.13. Bioforcetech Corporation
10.13.1. Business Overview
10.13.2. Company Snapshot
10.13.3. Company Market Share Analysis
10.13.4. Company Product Portfolio
10.13.5. Recent Developments
10.13.6. SWOT Analysis
List of Table
1. Global Biochar Market, By Technology, 2020-2033 (USD Billion)
2. Global Pyrolysis, Biochar Market, By Region, 2020-2033 (USD Billion)
3. Global Gasification Systems, Biochar Market, By Region, 2020-2033 (USD Billion)
4. Global Others, Biochar Market, By Region, 2020-2033 (USD Billion)
5. Global Biochar Market, By Application, 2020-2033 (USD Billion)
6. Global Agriculture, Biochar Market, By Region, 2020-2033 (USD Billion)
7. Global Animal Farming, Biochar Market, By Region, 2020-2033 (USD Billion)
8. Global Industrial Uses, Biochar Market, By Region, 2020-2033 (USD Billion)
9. Global Others, Biochar Market, By Region, 2020-2033 (USD Billion)
10. North America Biochar Market, By Technology, 2020-2033 (USD Billion)
11. North America Biochar Market, By Application, 2020-2033 (USD Billion)
12. U.S. Biochar Market, By Technology, 2020-2033 (USD Billion)
13. U.S. Biochar Market, By Application, 2020-2033 (USD Billion)
14. Canada Biochar Market, By Technology, 2020-2033 (USD Billion)
15. Canada Biochar Market, By Application, 2020-2033 (USD Billion)
16. Mexico Biochar Market, By Technology, 2020-2033 (USD Billion)
17. Mexico Biochar Market, By Application, 2020-2033 (USD Billion)
18. Europe Biochar Market, By Technology, 2020-2033 (USD Billion)
19. Europe Biochar Market, By Application, 2020-2033 (USD Billion)
20. Germany Biochar Market, By Technology, 2020-2033 (USD Billion)
21. Germany Biochar Market, By Application, 2020-2033 (USD Billion)
22. France Biochar Market, By Technology, 2020-2033 (USD Billion)
23. France Biochar Market, By Application, 2020-2033 (USD Billion)
24. U.K. Biochar Market, By Technology, 2020-2033 (USD Billion)
25. U.K. Biochar Market, By Application, 2020-2033 (USD Billion)
26. Italy Biochar Market, By Technology, 2020-2033 (USD Billion)
27. Italy Biochar Market, By Application, 2020-2033 (USD Billion)
28. Spain Biochar Market, By Technology, 2020-2033 (USD Billion)
29. Spain Biochar Market, By Application, 2020-2033 (USD Billion)
30. Asia Pacific Biochar Market, By Technology, 2020-2033 (USD Billion)
31. Asia Pacific Biochar Market, By Application, 2020-2033 (USD Billion)
32. Japan Biochar Market, By Technology, 2020-2033 (USD Billion)
33. Japan Biochar Market, By Application, 2020-2033 (USD Billion)
34. China Biochar Market, By Technology, 2020-2033 (USD Billion)
35. China Biochar Market, By Application, 2020-2033 (USD Billion)
36. India Biochar Market, By Technology, 2020-2033 (USD Billion)
37. India Biochar Market, By Application, 2020-2033 (USD Billion)
38. South America Biochar Market, By Technology, 2020-2033 (USD Billion)
39. South America Biochar Market, By Application, 2020-2033 (USD Billion)
40. Brazil Biochar Market, By Technology, 2020-2033 (USD Billion)
41. Brazil Biochar Market, By Application, 2020-2033 (USD Billion)
42. Middle East and Africa Biochar Market, By Technology, 2020-2033 (USD Billion)
43. Middle East and Africa Biochar Market, By Application, 2020-2033 (USD Billion)
44. UAE Biochar Market, By Technology, 2020-2033 (USD Billion)
45. UAE Biochar Market, By Application, 2020-2033 (USD Billion)
46. South Africa Biochar Market, By Technology, 2020-2033 (USD Billion)
47. South Africa Biochar Market, By Application, 2020-2033 (USD Billion)
List of Figures
1. Global Biochar Market Segmentation
2. Global Biochar Market: Research Methodology
3. Market Size Estimation Methodology: Bottom-Up Approach
4. Market Size Estimation Methodology: Top-Down Approach
5. Data Triangulation
6. Porter’s Five Forces Analysis
7. Value Chain Analysis
8. Global Biochar Market Attractiveness Analysis By Technology
9. Global Biochar Market Attractiveness Analysis By Application
10. Global Biochar Market Attractiveness Analysis By Region
11. Global Biochar Market: Dynamics
12. Global Biochar Market Share By Technology (2023 & 2033)
13. Global Biochar Market Share By Application (2023 & 2033)
14. Global Biochar Market Share By Regions (2023 & 2033)
15. Global Biochar Market Share By Company (2023)
This study forecasts global, regional, and country revenue from 2020 to 2033. Brainy Insights has segmented the global biochar market based on the below-mentioned segments:
Global Biochar Market by Technology:
Global Biochar Market by Application:
Global Biochar Market by Region:
Research has its special purpose to undertake marketing efficiently. In this competitive scenario, businesses need information across all industry verticals; the information about customer wants, market demand, competition, industry trends, distribution channels etc. This information needs to be updated regularly because businesses operate in a dynamic environment. Our organization, The Brainy Insights incorporates scientific and systematic research procedures in order to get proper market insights and industry analysis for overall business success. The analysis consists of studying the market from a miniscule level wherein we implement statistical tools which helps us in examining the data with accuracy and precision.
Our research reports feature both; quantitative and qualitative aspects for any market. Qualitative information for any market research process are fundamental because they reveal the customer needs and wants, usage and consumption for any product/service related to a specific industry. This in turn aids the marketers/investors in knowing certain perceptions of the customers. Qualitative research can enlighten about the different product concepts and designs along with unique service offering that in turn, helps define marketing problems and generate opportunities. On the other hand, quantitative research engages with the data collection process through interviews, e-mail interactions, surveys and pilot studies. Quantitative aspects for the market research are useful to validate the hypotheses generated during qualitative research method, explore empirical patterns in the data with the help of statistical tools, and finally make the market estimations.
The Brainy Insights offers comprehensive research and analysis, based on a wide assortment of factual insights gained through interviews with CXOs and global experts and secondary data from reliable sources. Our analysts and industry specialist assume vital roles in building up statistical tools and analysis models, which are used to analyse the data and arrive at accurate insights with exceedingly informative research discoveries. The data provided by our organization have proven precious to a diverse range of companies, facilitating them to address issues such as determining which products/services are the most appealing, whether or not customers use the product in the manner anticipated, the purchasing intentions of the market and many others.
Our research methodology encompasses an idyllic combination of primary and secondary initiatives. Key phases involved in this process are listed below:

The phase involves the gathering and collecting of market data and its related information with the help of different sources & research procedures.

The data procurement stage involves in data gathering and collecting through various data sources.
This stage involves in extensive research. These data sources includes:
Purchased Database: Purchased databases play a crucial role in estimating the market sizes irrespective of the domain. Our purchased database includes:
Primary Research: The Brainy Insights interacts with leading companies and experts of the concerned domain to develop the analyst team’s market understanding and expertise. It improves and substantiates every single data presented in the market reports. Primary research mainly involves in telephonic interviews, E-mail interactions and face-to-face interviews with the raw material providers, manufacturers/producers, distributors, & independent consultants. The interviews that we conduct provides valuable data on market size and industry growth trends prevailing in the market. Our organization also conducts surveys with the various industry experts in order to gain overall insights of the industry/market. For instance, in healthcare industry we conduct surveys with the pharmacists, doctors, surgeons and nurses in order to gain insights and key information of a medical product/device/equipment which the customers are going to usage. Surveys are conducted in the form of questionnaire designed by our own analyst team. Surveys plays an important role in primary research because surveys helps us to identify the key target audiences of the market. Additionally, surveys helps to identify the key target audience engaged with the market. Our survey team conducts the survey by targeting the key audience, thus gaining insights from them. Based on the perspectives of the customers, this information is utilized to formulate market strategies. Moreover, market surveys helps us to understand the current competitive situation of the industry. To be precise, our survey process typically involve with the 360 analysis of the market. This analytical process begins by identifying the prospective customers for a product or service related to the market/industry to obtain data on how a product/service could fit into customers’ lives.

Secondary Research: The secondary data sources includes information published by the on-profit organizations such as World bank, WHO, company fillings, investor presentations, annual reports, national government documents, statistical databases, blogs, articles, white papers and others. From the annual report, we analyse a company’s revenue to understand the key segment and market share of that organization in a particular region. We analyse the company websites and adopt the product mapping technique which is important for deriving the segment revenue. In the product mapping method, we select and categorize the products offered by the companies catering to domain specific market, deduce the product revenue for each of the companies so as to get overall estimation of the market size. We also source data and analyses trends based on information received from supply side and demand side intermediaries in the value chain. The supply side denotes the data gathered from supplier, distributor, wholesaler and the demand side illustrates the data gathered from the end customers for respective market domain.

The supply side for a domain specific market is analysed by:
The demand side for the market is estimated through:
In-house Library: Apart from these third-party sources, we have our in-house library of qualitative and quantitative information. Our in-house database includes market data for various industry and domains. These data are updated on regular basis as per the changing market scenario. Our library includes, historic databases, internal audit reports and archives.
Sometimes there are instances where there is no metadata or raw data available for any domain specific market. For those cases, we use our expertise to forecast and estimate the market size in order to generate comprehensive data sets. Our analyst team adopt a robust research technique in order to produce the estimates:
Data Synthesis: This stage involves the analysis & mapping of all the information obtained from the previous step. It also involves in scrutinizing the data for any discrepancy observed while data gathering related to the market. The data is collected with consideration to the heterogeneity of sources. Robust scientific techniques are in place for synthesizing disparate data sets and provide the essential contextual information that can orient market strategies. The Brainy Insights has extensive experience in data synthesis where the data passes through various stages:


Market Deduction & Formulation: The final stage comprises of assigning data points at appropriate market spaces so as to deduce feasible conclusions. Analyst perspective & subject matter expert based holistic form of market sizing coupled with industry analysis also plays a crucial role in this stage.
This stage involves in finalization of the market size and numbers that we have collected from data integration step. With data interpolation, it is made sure that there is no gap in the market data. Successful trend analysis is done by our analysts using extrapolation techniques, which provide the best possible forecasts for the market.
Data Validation & Market Feedback: Validation is the most important step in the process. Validation & re-validation via an intricately designed process helps us finalize data-points to be used for final calculations.

The Brainy Insights interacts with leading companies and experts of the concerned domain to develop the analyst team’s market understanding and expertise. It improves and substantiates every single data presented in the market reports. The data validation interview and discussion panels are typically composed of the most experienced industry members. The participants include, however, are not limited to:
Moreover, we always validate our data and findings through primary respondents from all the major regions we are working on.


Free Customization
Fortune 500 Clients
Free Yearly Update On Purchase Of Multi/Corporate License
Companies Served Till Date