- +1-315-215-1633
- sales@thebrainyinsights.com

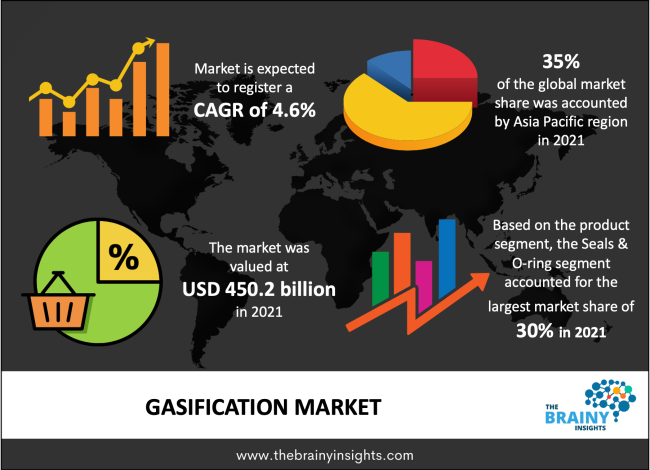
The Gasification market was estimated at around 450.2 billion in 2021, growing at a CAGR of nearly 4.6% during 2022-2030. The market is projected to reach approximately USD 692.3 billion by 2030.
Organic waste and compost are transformed into syngas and chemicals including methane, ethylene, fatty acids, detergents, and plasticizers through the thermochemical process known as gasification. Syngas, sometimes referred to as producer gas, synthetic gas, synthesis gas, and product gas, is made up mostly of the hydrocarbons CH4, C2H4, and C2H6 and contains very minor amounts of tars, H2S, and NH3. By oxidising pelletized or crushed biomass with a gasification agent in a gasifier plant, the biomass gasification process produces combustible gases. An efficient and productive method for producing hydrogen from feedstock is gasification. Using catalysis, syngas is converted in a gasification reaction, followed by gas separation and purification.
The size of the worldwide gasification market was quite healthy in 2021, and it is anticipated that it would grow quickly in terms of revenue over the forecast period. A significant driver propelling market revenue growth over the forecast period is the rising demand for clean energy sources.
Get an overview of this study by requesting a free sample
There have been effects on numerous marketing industries during the COVID-19 epidemic. One of them was the Biomass Gasification industry Trends. Early social segregation practises, shutdowns, lockdowns, and other limitations in many places have hampered the expansion of the global market in 2020. Due to the lockout during this time, the Biomass Gasification Market Trends has lost several investors and projects. Additionally, there have been issues with productivity, sales, transportation, personnel, etc. on the worldwide market. The epidemic has also interfered with the worldwide market's supply lines.
The administration expressed hope for the revival of the world market when it chose to open up the market with a number of restrictions. However, the global economy has encountered significant difficulties in rehiring the workforce.
Increasing awareness to accelerate the market’s growth
Gasification is becoming more popular as a clean energy replacement due to rising environmental consciousness and increased understanding of sustainability. Gasification procedures are being installed in production and manufacturing facilities as a result of rapid industrialization, expanding electricity, chemical, oil, and gas sectors, and technological advancements. Due to the widespread use of gasification for waste disposal and the recycling of complex compost, demand for gasification is rising quickly in the municipal sector. Additionally, gasifiers are a versatile, effective, and dependable choice for thermal applications since they can be simply retrofitted into already installed and operational gas-fueled equipment, such furnaces and boilers, in order to switch fossil fuels out for syngas. Additionally, the production of energy from fossil fuels, methane, liquid fuels, and ammonia is largely accomplished by gasification procedures.
The Gasification market is segmented into the product, and application. Over the projected period, the biomass segment is anticipated to account for the greatest revenue share by feedstock type. In addition to resources like animal manure, paper, cotton, food scraps, agricultural waste, crops, and wood residues like sawdust and firewood, biomass of bio feed provides a clean alternative to coal based feedstock. The use of biomass gasification in numerous industries throughout the world has been further spurred by growing environmental concerns and rising greenhouse gas and carbon emissions.
Since gasification is becoming more and more popular for producing high-value products like methanol, the chemicals segment is anticipated to experience significant revenue increase over the projected period. Due to its cheap operating costs, great power efficiency, and need for low-value waste and feedstock in order to produce high-value chemicals, the gasification process is becoming more and more popular in the chemical and packaging sectors. High feedstock flexibility while generating chemicals using the gasification process is another aspect that is anticipated to greatly boost this segment's revenue growth.
Over the forecast period, Europe is anticipated to experience a considerable revenue CAGR. Gasification is being more widely used in the area as the need for eco-friendly solutions and sustainable energy sources to replace fossil fuels grows. Additionally, it is anticipated that expanding trade activities will accelerate gasification operations in the market due to the increased demand for syngas and other chemicals in European nations. Additionally, the presence of numerous coal reserves in the area and rising energy demand are some additional factors influencing market revenue growth over the projection period.
The global Gasification market is segmented as follows:
By Product
By Application
By Region/Geography
| Attribute | Description |
|---|---|
| Base Year | 2021 |
| Forecast period | 2022-2030 |
| Report Coverage | Revenue estimation and forecast, company profile, competitive landscape, growth factors, and recent trends |
| Regional scope | North America, Europe, Asia Pacific, Middle East & Africa, and Latin America |
| Market Size(unit) | USD Billion |
| CAGR (2022 to 2030) | 4.6% |
| Segments Covered |
By Product |
1. Introduction
1.1. Objectives of the Study
1.2. Market Definition
1.3. Research Scope
2. Research Methodology and Assumptions
3. Executive Summary
4. Premium Insights
4.1. Porter’s Five Forces Analysis
4.2. Value Chain Analysis
4.3. Top Investment Pockets
4.3.1. Market Attractiveness Analysis By Product
4.3.2. Market Attractiveness Analysis By Application
4.4. Industry Trends
5. Market Dynamics
5.1. Market Evaluation
5.2. Drivers
5.2.1. Increasing awareness to accelerate the market’s growth
5.3. Restrains
5.3.1. Availability of substitute materials would hamper the market
5.4. Opportunities
5.4.1. Growing market
6. Global Gasification Market Analysis and Forecast, By Product
6.1. Segment Overview
6.2. Biomass
6.3. Coal
6.4. Natural Gas and
6.5. Petroleum
7. Global Gasification Market Analysis and Forecast, By Application
7.1. Segment Overview
7.2. Chemicals
7.3. Gas Fuels
7.4. Power
7.5. Liquid Fuels
7.6. Others
8. Global Gasification Market Analysis and Forecast, By Regional Analysis
8.1. Segment Overview
8.2. North America
8.2.1. U.S.
8.2.2. Canada
8.2.3. Mexico
8.3. Europe
8.3.1. Germany
8.3.2. France
8.3.3. U.K.
8.3.4. Italy
8.3.5. Spain
8.3.6. Rest of Europe
8.4. Asia-Pacific
8.4.1. Japan
8.4.2. China
8.4.3. India
8.4.4. Australia
8.4.5. South Korea
8.4.6. Rest of Asia-Pacific
8.5. South America
8.5.1. Brazil
8.5.2. Argentina
8.5.3. Rest of South America
8.6. Middle East and Africa
8.6.1. UAE
8.6.2. South Africa
8.6.3. Egypt
8.6.4. Kuwait
8.6.5. Saudi Arabia
8.6.6. Rest of Middle East & Africa
9. Global Gasification Market-Competitive Landscape
9.1. Overview
9.2. Market Share of Key Players in the Gasification market
9.2.1. Global Company Market Share
9.2.2. North America Company Market Share
9.2.3. Europe Company Market Share
9.2.4. APAC Company Market Share
9.3. Competitive Situations and Trends
9.3.1. Product Launches and Developments
9.3.2. Partnerships, Collaborations, and Agreements
9.3.3. Mergers & Acquisitions
9.3.4. Expansions
10. Company Profiles
10.1. Cameron International
10.1.1. Business Overview
10.1.2. Company Snapshot
10.1.3. Company Market Share Analysis
10.1.4. Company Application Portfolio
10.1.5. Recent Developments
10.1.6. SWOT Analysis
10.2. Aker Solutions
10.2.1. Business Overview
10.2.2. Company Snapshot
10.2.3. Company Market Share Analysis
10.2.4. Company Application Portfolio
10.2.5. Recent Developments
10.2.6. SWOT Analysis
10.3. HCS Control Systems
10.3.1. Business Overview
10.3.2. Company Snapshot
10.3.3. Company Market Share Analysis
10.3.4. Company Application Portfolio
10.3.5. Recent Developments
10.3.6. SWOT Analysis
10.4. General Electric Company
10.4.1. Business Overview
10.4.2. Company Snapshot
10.4.3. Company Market Share Analysis
10.4.4. Company Application Portfolio
10.4.5. Recent Developments
10.4.6. SWOT Analysis
10.5. Zetechtics Ltd.
10.5.1. Business Overview
10.5.2. Company Snapshot
10.5.3. Company Market Share Analysis
10.5.4. Company Application Portfolio
10.5.5. Recent Developments
10.5.6. SWOT Analysis
10.6. KW Ltd.
10.6.1. Business Overview
10.6.2. Company Snapshot
10.6.3. Company Market Share Analysis
10.6.4. Company Application Portfolio
10.6.5. Recent Developments
10.6.6. SWOT Analysis
10.7. FMC Technologies
10.7.1. Business Overview
10.7.2. Company Snapshot
10.7.3. Company Market Share Analysis
10.7.4. Company Application Portfolio
10.7.5. Recent Developments
10.7.6. SWOT Analysis
10.8. Royal Dutch Shell
10.8.1. Business Overview
10.8.2. Company Snapshot
10.8.3. Company Market Share Analysis
10.8.4. Company Application Portfolio
10.8.5. Recent Developments
10.8.6. SWOT Analysis
10.9. Air Liquide
10.9.1. Business Overview
10.9.2. Company Snapshot
10.9.3. Company Market Share Analysis
10.9.4. Company Application Portfolio
10.9.5. Recent Developments
10.9.6. SWOT Analysis
10.10. SEDIN Engineering Company Limited
10.10.1. Business Overview
10.10.2. Company Snapshot
10.10.3. Company Market Share Analysis
10.10.4. Company Application Portfolio
10.10.5. Recent Developments
10.10.6. SWOT Analysis
List of Table
1. Global Gasification Market, By Product, 2022-2030(USD Billion)
2. Global Biomass Gasification Market, By Region, 2022-2030(USD Billion)
3. Global Coal Gasification Market, By Region, 2022-2030(USD Billion)
4. Global Natural Gas Gasification Market, By Region, 2022-2030(USD Billion)
5. Global Petroleum Gasification Market, By Region, 2022-2030(USD Billion)
6. Global Gasification Market, By Application, 2022-2030(USD Billion)
7. Global Chemicals Gasification Market, By Region, 2022-2030(USD Billion)
8. Global Gas Fuels Gasification Market, By Region, 2022-2030(USD Billion)
9. Global Power Gasification Market, By Region, 2022-2030(USD Billion)
10. Global Liquid fuels Gasification Market, By Region, 2022-2030(USD Billion)
11. Global Others Gasification Market, By Region, 2022-2030(USD Billion)
12. Global Gasification Market, By Region, 2022-2030(USD Billion)
13. Global Gasification Market, By North America, 2022-2030(USD Billion)
14. North America Gasification Market, By Product, 2022-2030(USD Billion)
15. North America Gasification Market, By Application, 2022-2030(USD Billion)
16. U.S. Gasification Market, By Product, 2022-2030(USD Billion)
17. U.S. Gasification Market, By Application, 2022-2030(USD Billion)
18. Canada Gasification Market, By Product, 2022-2030(USD Billion)
19. Canada Gasification Market, By Application, 2022-2030(USD Billion)
20. Mexico Gasification Market, By Product, 2022-2030(USD Billion)
21. Mexico Gasification Market, By Application, 2022-2030(USD Billion)
22. Europe Gasification Market, By Product, 2022-2030(USD Billion)
23. Europe Gasification Market, By Application, 2022-2030(USD Billion)
24. Germany Gasification Market, By Product, 2022-2030(USD Billion)
25. Germany Gasification Market, By Application, 2022-2030(USD Billion)
26. France Gasification Market, By Product, 2022-2030(USD Billion)
27. France Gasification Market, By Application, 2022-2030(USD Billion)
28. U.K. Gasification Market, By Product, 2022-2030(USD Billion)
29. U.K. Gasification Market, By Application, 2022-2030(USD Billion)
30. Italy Gasification Market, By Product, 2022-2030(USD Billion)
31. Italy Gasification Market, By Application, 2022-2030(USD Billion)
32. Spain Gasification Market, By Product, 2022-2030(USD Billion)
33. Spain Gasification Market, By Application, 2022-2030(USD Billion)
34. Rest of Europe Gasification Market, By Product, 2022-2030(USD Billion)
35. Rest of Europe Gasification Market, By Application, 2022-2030(USD Billion)
36. Asia Pacific Gasification Market, By Product, 2022-2030(USD Billion)
37. Asia Pacific Gasification Market, By Application, 2022-2030(USD Billion)
38. Japan Gasification Market, By Product, 2022-2030(USD Billion)
39. Japan Gasification Market, By Application, 2022-2030(USD Billion)
40. China Gasification Market, By Product, 2022-2030(USD Billion)
41. China Gasification Market, By Application, 2022-2030(USD Billion)
42. India Gasification Market, By Product, 2022-2030(USD Billion)
43. India Gasification Market, By Application, 2022-2030(USD Billion)
44. Australia Gasification Market, By Product, 2022-2030(USD Billion)
45. Australia Gasification Market, By Application, 2022-2030(USD Billion)
46. South Korea Gasification Market, By Product, 2022-2030(USD Billion)
47. South Korea Gasification Market, By Application, 2022-2030(USD Billion)
48. Rest of Asia-Pacific Gasification Market, By Product, 2022-2030(USD Billion)
49. Rest of Asia-Pacific Gasification Market, By Application, 2022-2030(USD Billion)
50. South America Gasification Market, By Product, 2022-2030(USD Billion)
51. South America Gasification Market, By Application, 2022-2030(USD Billion)
52. Brazil Gasification Market, By Product, 2022-2030(USD Billion)
53. Brazil Gasification Market, By Application, 2022-2030(USD Billion)
54. Argentina Gasification Market, By Product, 2022-2030(USD Billion)
55. Argentina Gasification Market, By Application, 2022-2030(USD Billion)
56. Rest of Latin America Gasification Market, By Product, 2022-2030(USD Billion)
57. Rest of Latin America Gasification Market, By Application, 2022-2030(USD Billion)
58. Middle East and Africa Gasification Market, By Product, 2022-2030(USD Billion)
59. Middle East and Africa Gasification Market, By Application, 2022-2030(USD Billion)
60. UAE Gasification Market, By Product, 2022-2030(USD Billion)
61. UAE Gasification Market, By Application, 2022-2030(USD Billion)
62. South Africa Gasification Market, By Product, 2022-2030(USD Billion)
63. South Africa Gasification Market, By Application, 2022-2030(USD Billion)
64. Egypt Gasification Market, By Product, 2022-2030(USD Billion)
65. Egypt Gasification Market, By Application, 2022-2030(USD Billion)
66. Kuwait Gasification Market, By Product, 2022-2030(USD Billion)
67. Kuwait Gasification Market, By Application, 2022-2030(USD Billion)
68. Saudi Arabia Gasification Market, By Product, 2022-2030(USD Billion)
69. Saudi Arabia Gasification Market, By Application, 2022-2030(USD Billion)
70. Rest of Middle East Gasification Market, By Product, 2022-2030(USD Billion)
71. Rest of Middle East Gasification Market, By Application, 2022-2030(USD Billion)
List of Figures
1. Global Gasification Market Segmentation
2. Gasification Market: Research Methodology
3. Market Size Estimation Methodology: Bottom-Up Approach
4. Market Size Estimation Methodology: Top-Down Approach
5. Data Triangulation
6. Porter’s Five Forces Analysis
7. Value Chain Analysis
8. Global Gasification Market Attractiveness Analysis By Product
9. Global Gasification Market Attractiveness Analysis By Application
10. Global Gasification Market Attractiveness Analysis By Region
11. Global Gasification Market: Dynamics
12. Global Gasification Market Share By Product(2022 & 2030)
13. Global Gasification Market Share By Application(2022 & 2030)
14. Global Gasification Market Share by Regions (2022 & 2030)
15. Global Gasification Market Share by Company (2021)
By Product
By Application
By Region/Geography
Research has its special purpose to undertake marketing efficiently. In this competitive scenario, businesses need information across all industry verticals; the information about customer wants, market demand, competition, industry trends, distribution channels etc. This information needs to be updated regularly because businesses operate in a dynamic environment. Our organization, The Brainy Insights incorporates scientific and systematic research procedures in order to get proper market insights and industry analysis for overall business success. The analysis consists of studying the market from a miniscule level wherein we implement statistical tools which helps us in examining the data with accuracy and precision.
Our research reports feature both; quantitative and qualitative aspects for any market. Qualitative information for any market research process are fundamental because they reveal the customer needs and wants, usage and consumption for any product/service related to a specific industry. This in turn aids the marketers/investors in knowing certain perceptions of the customers. Qualitative research can enlighten about the different product concepts and designs along with unique service offering that in turn, helps define marketing problems and generate opportunities. On the other hand, quantitative research engages with the data collection process through interviews, e-mail interactions, surveys and pilot studies. Quantitative aspects for the market research are useful to validate the hypotheses generated during qualitative research method, explore empirical patterns in the data with the help of statistical tools, and finally make the market estimations.
The Brainy Insights offers comprehensive research and analysis, based on a wide assortment of factual insights gained through interviews with CXOs and global experts and secondary data from reliable sources. Our analysts and industry specialist assume vital roles in building up statistical tools and analysis models, which are used to analyse the data and arrive at accurate insights with exceedingly informative research discoveries. The data provided by our organization have proven precious to a diverse range of companies, facilitating them to address issues such as determining which products/services are the most appealing, whether or not customers use the product in the manner anticipated, the purchasing intentions of the market and many others.
Our research methodology encompasses an idyllic combination of primary and secondary initiatives. Key phases involved in this process are listed below:

The phase involves the gathering and collecting of market data and its related information with the help of different sources & research procedures.

The data procurement stage involves in data gathering and collecting through various data sources.
This stage involves in extensive research. These data sources includes:
Purchased Database: Purchased databases play a crucial role in estimating the market sizes irrespective of the domain. Our purchased database includes:
Primary Research: The Brainy Insights interacts with leading companies and experts of the concerned domain to develop the analyst team’s market understanding and expertise. It improves and substantiates every single data presented in the market reports. Primary research mainly involves in telephonic interviews, E-mail interactions and face-to-face interviews with the raw material providers, manufacturers/producers, distributors, & independent consultants. The interviews that we conduct provides valuable data on market size and industry growth trends prevailing in the market. Our organization also conducts surveys with the various industry experts in order to gain overall insights of the industry/market. For instance, in healthcare industry we conduct surveys with the pharmacists, doctors, surgeons and nurses in order to gain insights and key information of a medical product/device/equipment which the customers are going to usage. Surveys are conducted in the form of questionnaire designed by our own analyst team. Surveys plays an important role in primary research because surveys helps us to identify the key target audiences of the market. Additionally, surveys helps to identify the key target audience engaged with the market. Our survey team conducts the survey by targeting the key audience, thus gaining insights from them. Based on the perspectives of the customers, this information is utilized to formulate market strategies. Moreover, market surveys helps us to understand the current competitive situation of the industry. To be precise, our survey process typically involve with the 360 analysis of the market. This analytical process begins by identifying the prospective customers for a product or service related to the market/industry to obtain data on how a product/service could fit into customers’ lives.

Secondary Research: The secondary data sources includes information published by the on-profit organizations such as World bank, WHO, company fillings, investor presentations, annual reports, national government documents, statistical databases, blogs, articles, white papers and others. From the annual report, we analyse a company’s revenue to understand the key segment and market share of that organization in a particular region. We analyse the company websites and adopt the product mapping technique which is important for deriving the segment revenue. In the product mapping method, we select and categorize the products offered by the companies catering to domain specific market, deduce the product revenue for each of the companies so as to get overall estimation of the market size. We also source data and analyses trends based on information received from supply side and demand side intermediaries in the value chain. The supply side denotes the data gathered from supplier, distributor, wholesaler and the demand side illustrates the data gathered from the end customers for respective market domain.

The supply side for a domain specific market is analysed by:
The demand side for the market is estimated through:
In-house Library: Apart from these third-party sources, we have our in-house library of qualitative and quantitative information. Our in-house database includes market data for various industry and domains. These data are updated on regular basis as per the changing market scenario. Our library includes, historic databases, internal audit reports and archives.
Sometimes there are instances where there is no metadata or raw data available for any domain specific market. For those cases, we use our expertise to forecast and estimate the market size in order to generate comprehensive data sets. Our analyst team adopt a robust research technique in order to produce the estimates:
Data Synthesis: This stage involves the analysis & mapping of all the information obtained from the previous step. It also involves in scrutinizing the data for any discrepancy observed while data gathering related to the market. The data is collected with consideration to the heterogeneity of sources. Robust scientific techniques are in place for synthesizing disparate data sets and provide the essential contextual information that can orient market strategies. The Brainy Insights has extensive experience in data synthesis where the data passes through various stages:


Market Deduction & Formulation: The final stage comprises of assigning data points at appropriate market spaces so as to deduce feasible conclusions. Analyst perspective & subject matter expert based holistic form of market sizing coupled with industry analysis also plays a crucial role in this stage.
This stage involves in finalization of the market size and numbers that we have collected from data integration step. With data interpolation, it is made sure that there is no gap in the market data. Successful trend analysis is done by our analysts using extrapolation techniques, which provide the best possible forecasts for the market.
Data Validation & Market Feedback: Validation is the most important step in the process. Validation & re-validation via an intricately designed process helps us finalize data-points to be used for final calculations.

The Brainy Insights interacts with leading companies and experts of the concerned domain to develop the analyst team’s market understanding and expertise. It improves and substantiates every single data presented in the market reports. The data validation interview and discussion panels are typically composed of the most experienced industry members. The participants include, however, are not limited to:
Moreover, we always validate our data and findings through primary respondents from all the major regions we are working on.


Free Customization
Fortune 500 Clients
Free Yearly Update On Purchase Of Multi/Corporate License
Companies Served Till Date