- +1-315-215-1633
- sales@thebrainyinsights.com

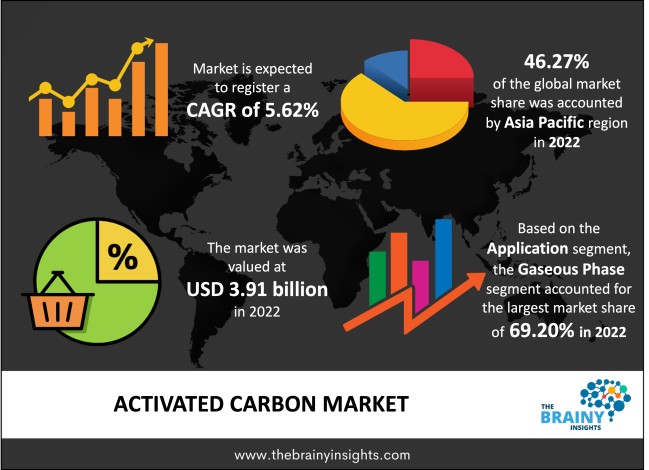
The global activated carbon market was valued at USD 3.91 Billion in 2022 and grew at a CAGR of 5.62% from 2023 to 2032. The market is expected to reach USD 6.75 Billion by 2032. The demand for activated carbon is increasing among end-user industries, such as automotive, water treatment, healthcare, food and beverages. Further, increasing investment in the sustainable energy sector will provide lucrative opportunities to the market.
Activated carbons are produced when carbonaceous materials with a low ash content, high carbon content, and significant volatile matter are subjected to chemical, physical, or a combination of the two processes. At water treatment facilities, activated carbon treatment removes manufactured organic pollutants, taste and odour compounds, and natural organic compounds. The activated carbon adsorption physically bonds molecules from the gas or liquid phase to the material's surface. Pollutant gases are brought down to very low quantities using various forms of activated carbon, primarily granular, cloth, pelletized, etc. To maximize the adsorption of gases and vapours, activated carbons typically need to be extremely microporous. Activated carbon is used in various gas purification procedures, the most significant of which include the elimination of hydrogen sulphide from natural gas and the filtration of indoor air in air-conditioning units.
Get an overview of this study by requesting a free sample
Increasing use of activated carbon in wastewater management: The aquatic ecosystem is currently affected by pharmaceutical residuals, endocrine chemicals, and X-ray contrast agents that enter the water cycle. The use of specialized powdered activated carbon is an efficient and cost-efficient method for their removal because these trace compounds are regularly found in the outflow of municipal wastewater treatment plants. Additionally, industrial effluent is cleaned with activated carbon to be used again in manufacturing. Industrial water pollution treatments are the most common application of activated carbon due to the reuse of industrial discharge water and water pollution controls. As a result, one of the major reasons fueling the market's expansion is the rising demand for activated carbon filters for wastewater treatment.
Fluctuating cost of raw materials: Various activated carbon products are manufactured using raw materials such as peat, pitch, coconut shell charcoal, petroleum, wood chips, phenolic resin, and viscose rayon. Using a high quantity of raw materials can result in a high yield of activated carbon. Therefore, key manufacturers need help with the quality of raw materials as it directly impacts the performance of end products. Furthermore, a considerable gap in the supply resulted in the fluctuation in the price of raw materials. Therefore, raw material price fluctuation is one of the key factors that may hamper the market's growth.
Rising investment in activated carbon for the automotive industry: Activated carbon is used in the automotive sector to reduce emissions, eliminate volatile organic compounds, and enhance cabin air quality. In gasoline-powered automobiles, activated carbon can effectively reduce evaporative loss emissions. Activated carbons are thought to be the most effective at reducing air pollution, largely caused by motor vehicle emissions. The market for activated carbon is expanding at the fastest rate because of the high need for activated carbon to reduce vehicle emissions. This substance's active use in the automotive industry will increase future demand for activated carbon. Nowadays, many manufacturers offer specialized, high-performance solutions for contemporary vehicles to control emissions in line with strict emission regulations.
The regions analyzed for the market include North America, Europe, South America, Asia Pacific, the Middle East, and Africa. Asia-Pacific emerged as the most significant activated carbon market, with a 46.27% market revenue share in 2022.
Asia-Pacific region will account for the largest market share with revenue growth. Nations such as India, China and Japan have a tremendous demand for activated carbon due to growing usage in wastewater management to increase the supply of pure water. Further, abundant raw materials have led to a high production of activated carbon in the region. The regional agencies support initiatives for the usage of activated carbon in several industries. Further, many production companies are entering into joint ventures and mergers, providing lucrative opportunities for the activated carbon market.
Asia-Pacific region Activated Carbon Market Share in 2022 - 46.27%
www.thebrainyinsights.com
Check the geographical analysis of this market by requesting a free sample
The form segment is divided into powdered, granular, and others. The powdered segment dominated the market, with a share of around 68.02% in 2022. PAC is a carbon and water mixture that can be employed as a dry or wet slurry. Due to its simplicity of use and cost benefits, powdered activated carbon has been a treatment option for a long time. Powdered activated carbon is used in wastewater treatment methods in which an aerobic or anaerobic treatment system is supplemented with powdered activated carbon.
The raw material segment is divided into coconut shell, coal, wood, peat and others. The coal segment dominated the market, with a share of around 48.11% in 2022. High-quality anthracite coal is used to make the coal-based powder-activated carbon, which is refined by a specific production process. The product looks like black powder, yet it is not dissolved in the general solution.
The application segment is divided into liquid phase and gaseous phase. The gaseous phase segment dominated the market, with a share of around 69.20% in 2022. The most significant activated carbon gas purification operations include the removal of hydrogen sulphide from natural gas and the filtration of breathing air in air conditioning systems, including removing radon, odours, and other contaminants in recirculated air.
The end-users segment is divided into food & beverages, pharmaceutical & healthcare, automotive, water treatment, air & gas purification and others. The water treatment segment dominated the market, with a share of around 35.79% in 2022. The activated carbon is widely used to treat wastewater in the industries. The wastewater is discharged into the water body without treating it, contaminating the water body and can harm the organisms inside. The liquid and gas-phase activated mobile can be readily used in water pipelines.
| Attribute | Description |
|---|---|
| Market Size | Revenue (USD Billion) |
| Market size value in 2022 | USD 3.91 Billion |
| Market size value in 2032 | USD 6.75 Billion |
| CAGR (2023 to 2032) | 5.62% |
| Historical data | 2019-2021 |
| Base Year | 2022 |
| Forecast | 2023-2032 |
| Region | The regions analyzed for the market are Asia Pacific, Europe, South America, North America, and Middle East & Africa. Furthermore, the regions are further analyzed at the country level. |
| Segments | Form, Raw Material, Application and End-users |
As per The Brainy Insights, the size of the activated carbon market was valued USD 3.91 billion in 2022 to USD 6.75 billion by 2032.
Global activated carbon market is growing at a CAGR of 5.62% during the forecast period 2023-2032.
Asia-Pacific region emerged as the largest market for the activated carbon.
The market's growth will be influenced by the rising usage of activated carbon in different applications.
The fluctuating cost of raw materials can hamper the market growth.
The rising investment in wastewater management is providing lucrative opportunities to the market.
1. Introduction
1.1. Objectives of the Study
1.2. Market Definition
1.3. Research Scope
1.4. Currency
1.5. Key Target Audience
2. Research Methodology and Assumptions
3. Executive Summary
4. Premium Insights
4.1. Porter’s Five Forces Analysis
4.2. Value Chain Analysis
4.3. Top Investment Pockets
4.3.1. Market Attractiveness Analysis by Form
4.3.2. Market Attractiveness Analysis by Raw Material
4.3.3. Market Attractiveness Analysis by Application
4.3.4. Market Attractiveness Analysis by End-users
4.3.5. Market Attractiveness Analysis by Region
4.4. Industry Trends
5. Market Dynamics
5.1. Market Evaluation
5.2. Drivers
5.2.1. Increasing usage of activated carbon in different end-users
5.3. Restraints
5.3.1. Fluctuating cost of raw materials
5.4. Opportunities
5.4.1. Increasing investment in wastewater management
5.5. Challenges
5.5.1. Supply disruptions
6. Global Activated Carbon Market Analysis and Forecast, By Form
6.1. Segment Overview
6.2. Powdered
6.3. Granular
6.4. Others
7. Global Activated Carbon Market Analysis and Forecast, By Raw Material
7.1. Segment Overview
7.2. Coconut Shell
7.3. Coal
7.4. Wood
7.5. Peat
7.6. Others
8. Global Activated Carbon Market Analysis and Forecast, By Application
8.1. Segment Overview
8.2. Liquid Phase
8.3. Gaseous Phase
9. Global Activated Carbon Market Analysis and Forecast, By End-users
9.1. Segment Overview
9.2. Food & Beverages
9.3. Pharmaceutical & Healthcare
9.4. Automotive
9.5. Water Treatment
9.6. Air & Gas Purification
9.7. Others
10. Global Activated Carbon Market Analysis and Forecast, By Regional Analysis
10.1. Segment Overview
10.2. North America
10.2.1. U.S.
10.2.2. Canada
10.2.3. Mexico
10.3. Europe
10.3.1. Germany
10.3.2. France
10.3.3. U.K.
10.3.4. Italy
10.3.5. Spain
10.4. Asia-Pacific
10.4.1. Japan
10.4.2. China
10.4.3. India
10.5. South America
10.5.1. Brazil
10.6. Middle East and Africa
10.6.1. UAE
10.6.2. South Africa
11. Global Activated Carbon Market-Competitive Landscape
11.1. Overview
11.2. Market Share of Key Players in the Activated Carbon Market
11.2.1. Global Company Market Share
11.2.2. North America Company Market Share
11.2.3. Europe Company Market Share
11.2.4. APAC Company Market Share
11.3. Competitive Situations and Trends
11.3.1. Product Launches and Developments
11.3.2. Partnerships, Collaborations, and Agreements
11.3.3. Mergers & Acquisitions
11.3.4. Expansions
12. Company Profiles
12.1. CarbPure Technologies
12.1.1. Business Overview
12.1.2. Company Snapshot
12.1.3. Company Market Share Analysis
12.1.4. Company Product Portfolio
12.1.5. Recent Developments
12.1.6. SWOT Analysis
12.2. Cabot Corporation
12.2.1. Business Overview
12.2.2. Company Snapshot
12.2.3. Company Market Share Analysis
12.2.4. Company Product Portfolio
12.2.5. Recent Developments
12.2.6. SWOT Analysis
12.3. Boyce Carbon
12.3.1. Business Overview
12.3.2. Company Snapshot
12.3.3. Company Market Share Analysis
12.3.4. Company Product Portfolio
12.3.5. Recent Developments
12.3.6. SWOT Analysis
12.4. Kuraray Co.
12.4.1. Business Overview
12.4.2. Company Snapshot
12.4.3. Company Market Share Analysis
12.4.4. Company Product Portfolio
12.4.5. Recent Developments
12.4.6. SWOT Analysis
12.5. Donau Chemie AG
12.5.1. Business Overview
12.5.2. Company Snapshot
12.5.3. Company Market Share Analysis
12.5.4. Company Product Portfolio
12.5.5. Recent Developments
12.5.6. SWOT Analysis
12.6. CarboTech AC GmbH
12.6.1. Business Overview
12.6.2. Company Snapshot
12.6.3. Company Market Share Analysis
12.6.4. Company Product Portfolio
12.6.5. Recent Developments
12.6.6. SWOT Analysis
12.7. Haycarb Ltd.
12.7.1. Business Overview
12.7.2. Company Snapshot
12.7.3. Company Market Share Analysis
12.7.4. Company Product Portfolio
12.7.5. Recent Developments
12.7.6. SWOT Analysis
12.8. Kureha Corporation
12.8.1. Business Overview
12.8.2. Company Snapshot
12.8.3. Company Market Share Analysis
12.8.4. Company Product Portfolio
12.8.5. Recent Developments
12.8.6. SWOT Analysis
12.9. Jacobi Carbons Group
12.9.1. Business Overview
12.9.2. Company Snapshot
12.9.3. Company Market Share Analysis
12.9.4. Company Product Portfolio
12.9.5. Recent Developments
12.9.6. SWOT Analysis
12.10. Osaka Gas Chemicals Co. Ltd.
12.10.1. Business Overview
12.10.2. Company Snapshot
12.10.3. Company Market Share Analysis
12.10.4. Company Product Portfolio
12.10.5. Recent Developments
12.10.6. SWOT Analysis
12.11. Oxbow Activated Carbon LLC
12.11.1. Business Overview
12.11.2. Company Snapshot
12.11.3. Company Market Share Analysis
12.11.4. Company Product Portfolio
12.11.5. Recent Developments
12.11.6. SWOT Analysis
12.12. Evoqua Water Technologies LLC
12.12.1. Business Overview
12.12.2. Company Snapshot
12.12.3. Company Market Share Analysis
12.12.4. Company Product Portfolio
12.12.5. Recent Developments
12.12.6. SWOT Analysis
12.13. Hangzhou Nature Technology Co. Ltd.
12.13.1. Business Overview
12.13.2. Company Snapshot
12.13.3. Company Market Share Analysis
12.13.4. Company Product Portfolio
12.13.5. Recent Developments
12.13.6. SWOT Analysis
12.14. Carbon Activated Corporation
12.14.1. Business Overview
12.14.2. Company Snapshot
12.14.3. Company Market Share Analysis
12.14.4. Company Product Portfolio
12.14.5. Recent Developments
12.14.6. SWOT Analysis
12.15. Datong Coal Jinding Activated Carbon Co.
12.15.1. Business Overview
12.15.2. Company Snapshot
12.15.3. Company Market Share Analysis
12.15.4. Company Product Portfolio
12.15.5. Recent Developments
12.15.6. SWOT Analysis
12.16. Sorbent JSC
12.16.1. Business Overview
12.16.2. Company Snapshot
12.16.3. Company Market Share Analysis
12.16.4. Company Product Portfolio
12.16.5. Recent Developments
12.16.6. SWOT Analysis
List of Table
1. Global Activated Carbon Market, By Form, 2019-2032 (USD Billion)
2. Global Powdered, Activated Carbon Market, By Region, 2019-2032 (USD Billion)
3. Global Granular, Activated Carbon Market, By Region, 2019-2032 (USD Billion)
4. Global Others, Activated Carbon Market, By Region, 2019-2032 (USD Billion)
5. Global Activated Carbon Market, By Raw Material, 2019-2032 (USD Billion)
6. Global Coconut Shell, Activated Carbon Market, By Region, 2019-2032 (USD Billion)
7. Global Coal, Activated Carbon Market, By Region, 2019-2032 (USD Billion)
8. Global Wood, Activated Carbon Market, By Region, 2019-2032 (USD Billion)
9. Global Peat, Activated Carbon Market, By Region, 2019-2032 (USD Billion)
10. Global Others, Activated Carbon Market, By Region, 2019-2032 (USD Billion)
11. Global Activated Carbon Market, By Application, 2019-2032 (USD Billion)
12. Global Liquid Phase, Activated Carbon Market, By Region, 2019-2032 (USD Billion)
13. Global Gaseous Phase, Activated Carbon Market, By Region, 2019-2032 (USD Billion)
14. Global Activated Carbon Market, By End-users, 2019-2032 (USD Billion)
15. Global Food & Beverages, Activated Carbon Market, By Region, 2019-2032 (USD Billion)
16. Global Pharmaceutical & Healthcare, Activated Carbon Market, By Region, 2019-2032 (USD Billion)
17. Global Automotive, Activated Carbon Market, By Region, 2019-2032 (USD Billion)
18. Global Water Treatment, Activated Carbon Market, By Region, 2019-2032 (USD Billion)
19. Global Air & Gas Purification, Activated Carbon Market, By Region, 2019-2032 (USD Billion)
20. Global Others, Activated Carbon Market, By Region, 2019-2032 (USD Billion)
21. Global Activated Carbon Market, By Region, 2019-2032 (USD Billion)
22. North America Activated Carbon Market, By Form, 2019-2032 (USD Billion)
23. North America Activated Carbon Market, By Raw Material, 2019-2032 (USD Billion)
24. North America Activated Carbon Market, By Application, 2019-2032 (USD Billion)
25. North America Activated Carbon Market, By End-users, 2019-2032 (USD Billion)
26. U.S. Activated Carbon Market, By Form, 2019-2032 (USD Billion)
27. U.S. Activated Carbon Market, By Raw Material, 2019-2032 (USD Billion)
28. U.S. Activated Carbon Market, By Application, 2019-2032 (USD Billion)
29. U.S. Activated Carbon Market, By End-users, 2019-2032 (USD Billion)
30. Canada Activated Carbon Market, By Form, 2019-2032 (USD Billion)
31. Canada Activated Carbon Market, By Raw Material, 2019-2032 (USD Billion)
32. Canada Activated Carbon Market, By Application, 2019-2032 (USD Billion)
33. Canada Activated Carbon Market, By End-users, 2019-2032 (USD Billion)
34. Mexico Activated Carbon Market, By Form, 2019-2032 (USD Billion)
35. Mexico Activated Carbon Market, By Raw Material, 2019-2032 (USD Billion)
36. Mexico Activated Carbon Market, By Application, 2019-2032 (USD Billion)
37. Mexico Activated Carbon Market, By End-users, 2019-2032 (USD Billion)
38. Europe Activated Carbon Market, By Form, 2019-2032 (USD Billion)
39. Europe Activated Carbon Market, By Raw Material, 2019-2032 (USD Billion)
40. Europe Activated Carbon Market, By Application, 2019-2032 (USD Billion)
41. Europe Activated Carbon Market, By End-users, 2019-2032 (USD Billion)
42. Germany Activated Carbon Market, By Form, 2019-2032 (USD Billion)
43. Germany Activated Carbon Market, By Raw Material, 2019-2032 (USD Billion)
44. Germany Activated Carbon Market, By Application, 2019-2032 (USD Billion)
45. Germany Activated Carbon Market, By End-users, 2019-2032 (USD Billion)
46. France Activated Carbon Market, By Form, 2019-2032 (USD Billion)
47. France Activated Carbon Market, By Raw Material, 2019-2032 (USD Billion)
48. France Activated Carbon Market, By Application, 2019-2032 (USD Billion)
49. France Activated Carbon Market, By End-users, 2019-2032 (USD Billion)
50. U.K. Activated Carbon Market, By Form, 2019-2032 (USD Billion)
51. U.K. Activated Carbon Market, By Raw Material, 2019-2032 (USD Billion)
52. U.K. Activated Carbon Market, By Application, 2019-2032 (USD Billion)
53. U.K. Activated Carbon Market, By End-users, 2019-2032 (USD Billion)
54. Italy Activated Carbon Market, By Form, 2019-2032 (USD Billion)
55. Italy Activated Carbon Market, By Raw Material, 2019-2032 (USD Billion)
56. Italy Activated Carbon Market, By Application, 2019-2032 (USD Billion)
57. Italy Activated Carbon Market, By End-users, 2019-2032 (USD Billion)
58. Spain Activated Carbon Market, By Form, 2019-2032 (USD Billion)
59. Spain Activated Carbon Market, By Raw Material, 2019-2032 (USD Billion)
60. Spain Activated Carbon Market, By Application, 2019-2032 (USD Billion)
61. Spain Activated Carbon Market, By End-users, 2019-2032 (USD Billion)
62. Asia Pacific Activated Carbon Market, By Form, 2019-2032 (USD Billion)
63. Asia Pacific Activated Carbon Market, By Raw Material, 2019-2032 (USD Billion)
64. Asia Pacific Activated Carbon Market, By Application, 2019-2032 (USD Billion)
65. Asia Pacific Activated Carbon Market, By End-users, 2019-2032 (USD Billion)
66. Japan Activated Carbon Market, By Form, 2019-2032 (USD Billion)
67. Japan Activated Carbon Market, By Raw Material, 2019-2032 (USD Billion)
68. Japan Activated Carbon Market, By Application, 2019-2032 (USD Billion)
69. Japan Activated Carbon Market, By End-users, 2019-2032 (USD Billion)
70. China Activated Carbon Market, By Form, 2019-2032 (USD Billion)
71. China Activated Carbon Market, By Raw Material, 2019-2032 (USD Billion)
72. China Activated Carbon Market, By Application, 2019-2032 (USD Billion)
73. China Activated Carbon Market, By End-users, 2019-2032 (USD Billion)
74. India Activated Carbon Market, By Form, 2019-2032 (USD Billion)
75. India Activated Carbon Market, By Raw Material, 2019-2032 (USD Billion)
76. India Activated Carbon Market, By Application, 2019-2032 (USD Billion)
77. India Activated Carbon Market, By End-users, 2019-2032 (USD Billion)
78. South America Activated Carbon Market, By Form, 2019-2032 (USD Billion)
79. South America Activated Carbon Market, By Raw Material, 2019-2032 (USD Billion)
80. South America Activated Carbon Market, By Application, 2019-2032 (USD Billion)
81. South America Activated Carbon Market, By End-users, 2019-2032 (USD Billion)
82. Brazil Activated Carbon Market, By Form, 2019-2032 (USD Billion)
83. Brazil Activated Carbon Market, By Raw Material, 2019-2032 (USD Billion)
84. Brazil Activated Carbon Market, By Application, 2019-2032 (USD Billion)
85. BrazilActivated Carbon Market, By End-users, 2019-2032 (USD Billion)
86. Middle East and Africa Activated Carbon Market, By Form, 2019-2032 (USD Billion)
87. Middle East and Africa Activated Carbon Market, By Raw Material, 2019-2032 (USD Billion)
88. Middle East and Africa Activated Carbon Market, By Application, 2019-2032 (USD Billion)
89. Middle East and Africa Activated Carbon Market, By End-users, 2019-2032 (USD Billion)
90. UAE Activated Carbon Market, By Form, 2019-2032 (USD Billion)
91. UAE Activated Carbon Market, By Raw Material, 2019-2032 (USD Billion)
92. UAE Activated Carbon Market, By Application, 2019-2032 (USD Billion)
93. UAE Activated Carbon Market, By End-users, 2019-2032 (USD Billion)
94. South Africa Activated Carbon Market, By Form, 2019-2032 (USD Billion)
95. South Africa Activated Carbon Market, By Raw Material, 2019-2032 (USD Billion)
96. South Africa Activated Carbon Market, By Application, 2019-2032 (USD Billion)
97. South Africa Activated Carbon Market, By End-users, 2019-2032 (USD Billion)
List of Figures
1. Global Activated Carbon Market Segmentation
2. Activated Carbon Market: Research Methodology
3. Market Size Estimation Methodology: Bottom-Up Approach
4. Market Size Estimation Methodology: Top-Down Approach
5. Data Triangulation
6. Porter’s Five Forces Analysis
7. Value Chain Analysis
8. Global Activated Carbon Market Attractiveness Analysis by Form
9. Global Activated Carbon Market Attractiveness Analysis by Raw Material
10. Global Activated Carbon Market Attractiveness Analysis by Application
11. Global Activated Carbon Market Attractiveness Analysis by End-users
12. Global Activated Carbon Market Attractiveness Analysis by Region
13. Global Activated Carbon Market: Dynamics
14. Global Activated Carbon Market Share by Form (2022 & 2032)
15. Global Activated Carbon Market Share by Raw Material (2022 & 2032)
16. Global Activated Carbon Market Share by Application (2022 & 2032)
17. Global Activated Carbon Market Share by End-users (2022 & 2032)
18. Global Activated Carbon Market Share by Regions (2022 & 2032)
19. Global Activated Carbon Market Share by Company (2022)
This study forecasts revenue at global, regional, and country levels from 2019 to 2032. The Brainy Insights has segmented the global activated carbon market based on below mentioned segments:
Global Activated Carbon Market by Form:
Global Activated Carbon Market by Raw Material:
Global Activated Carbon Market by Application:
Global Activated Carbon Market by End-users:
Global Activated Carbon Market by Region:
Research has its special purpose to undertake marketing efficiently. In this competitive scenario, businesses need information across all industry verticals; the information about customer wants, market demand, competition, industry trends, distribution channels etc. This information needs to be updated regularly because businesses operate in a dynamic environment. Our organization, The Brainy Insights incorporates scientific and systematic research procedures in order to get proper market insights and industry analysis for overall business success. The analysis consists of studying the market from a miniscule level wherein we implement statistical tools which helps us in examining the data with accuracy and precision.
Our research reports feature both; quantitative and qualitative aspects for any market. Qualitative information for any market research process are fundamental because they reveal the customer needs and wants, usage and consumption for any product/service related to a specific industry. This in turn aids the marketers/investors in knowing certain perceptions of the customers. Qualitative research can enlighten about the different product concepts and designs along with unique service offering that in turn, helps define marketing problems and generate opportunities. On the other hand, quantitative research engages with the data collection process through interviews, e-mail interactions, surveys and pilot studies. Quantitative aspects for the market research are useful to validate the hypotheses generated during qualitative research method, explore empirical patterns in the data with the help of statistical tools, and finally make the market estimations.
The Brainy Insights offers comprehensive research and analysis, based on a wide assortment of factual insights gained through interviews with CXOs and global experts and secondary data from reliable sources. Our analysts and industry specialist assume vital roles in building up statistical tools and analysis models, which are used to analyse the data and arrive at accurate insights with exceedingly informative research discoveries. The data provided by our organization have proven precious to a diverse range of companies, facilitating them to address issues such as determining which products/services are the most appealing, whether or not customers use the product in the manner anticipated, the purchasing intentions of the market and many others.
Our research methodology encompasses an idyllic combination of primary and secondary initiatives. Key phases involved in this process are listed below:

The phase involves the gathering and collecting of market data and its related information with the help of different sources & research procedures.

The data procurement stage involves in data gathering and collecting through various data sources.
This stage involves in extensive research. These data sources includes:
Purchased Database: Purchased databases play a crucial role in estimating the market sizes irrespective of the domain. Our purchased database includes:
Primary Research: The Brainy Insights interacts with leading companies and experts of the concerned domain to develop the analyst team’s market understanding and expertise. It improves and substantiates every single data presented in the market reports. Primary research mainly involves in telephonic interviews, E-mail interactions and face-to-face interviews with the raw material providers, manufacturers/producers, distributors, & independent consultants. The interviews that we conduct provides valuable data on market size and industry growth trends prevailing in the market. Our organization also conducts surveys with the various industry experts in order to gain overall insights of the industry/market. For instance, in healthcare industry we conduct surveys with the pharmacists, doctors, surgeons and nurses in order to gain insights and key information of a medical product/device/equipment which the customers are going to usage. Surveys are conducted in the form of questionnaire designed by our own analyst team. Surveys plays an important role in primary research because surveys helps us to identify the key target audiences of the market. Additionally, surveys helps to identify the key target audience engaged with the market. Our survey team conducts the survey by targeting the key audience, thus gaining insights from them. Based on the perspectives of the customers, this information is utilized to formulate market strategies. Moreover, market surveys helps us to understand the current competitive situation of the industry. To be precise, our survey process typically involve with the 360 analysis of the market. This analytical process begins by identifying the prospective customers for a product or service related to the market/industry to obtain data on how a product/service could fit into customers’ lives.

Secondary Research: The secondary data sources includes information published by the on-profit organizations such as World bank, WHO, company fillings, investor presentations, annual reports, national government documents, statistical databases, blogs, articles, white papers and others. From the annual report, we analyse a company’s revenue to understand the key segment and market share of that organization in a particular region. We analyse the company websites and adopt the product mapping technique which is important for deriving the segment revenue. In the product mapping method, we select and categorize the products offered by the companies catering to domain specific market, deduce the product revenue for each of the companies so as to get overall estimation of the market size. We also source data and analyses trends based on information received from supply side and demand side intermediaries in the value chain. The supply side denotes the data gathered from supplier, distributor, wholesaler and the demand side illustrates the data gathered from the end customers for respective market domain.

The supply side for a domain specific market is analysed by:
The demand side for the market is estimated through:
In-house Library: Apart from these third-party sources, we have our in-house library of qualitative and quantitative information. Our in-house database includes market data for various industry and domains. These data are updated on regular basis as per the changing market scenario. Our library includes, historic databases, internal audit reports and archives.
Sometimes there are instances where there is no metadata or raw data available for any domain specific market. For those cases, we use our expertise to forecast and estimate the market size in order to generate comprehensive data sets. Our analyst team adopt a robust research technique in order to produce the estimates:
Data Synthesis: This stage involves the analysis & mapping of all the information obtained from the previous step. It also involves in scrutinizing the data for any discrepancy observed while data gathering related to the market. The data is collected with consideration to the heterogeneity of sources. Robust scientific techniques are in place for synthesizing disparate data sets and provide the essential contextual information that can orient market strategies. The Brainy Insights has extensive experience in data synthesis where the data passes through various stages:


Market Deduction & Formulation: The final stage comprises of assigning data points at appropriate market spaces so as to deduce feasible conclusions. Analyst perspective & subject matter expert based holistic form of market sizing coupled with industry analysis also plays a crucial role in this stage.
This stage involves in finalization of the market size and numbers that we have collected from data integration step. With data interpolation, it is made sure that there is no gap in the market data. Successful trend analysis is done by our analysts using extrapolation techniques, which provide the best possible forecasts for the market.
Data Validation & Market Feedback: Validation is the most important step in the process. Validation & re-validation via an intricately designed process helps us finalize data-points to be used for final calculations.

The Brainy Insights interacts with leading companies and experts of the concerned domain to develop the analyst team’s market understanding and expertise. It improves and substantiates every single data presented in the market reports. The data validation interview and discussion panels are typically composed of the most experienced industry members. The participants include, however, are not limited to:
Moreover, we always validate our data and findings through primary respondents from all the major regions we are working on.


Free Customization
Fortune 500 Clients
Free Yearly Update On Purchase Of Multi/Corporate License
Companies Served Till Date