- +1-315-215-1633
- sales@thebrainyinsights.com

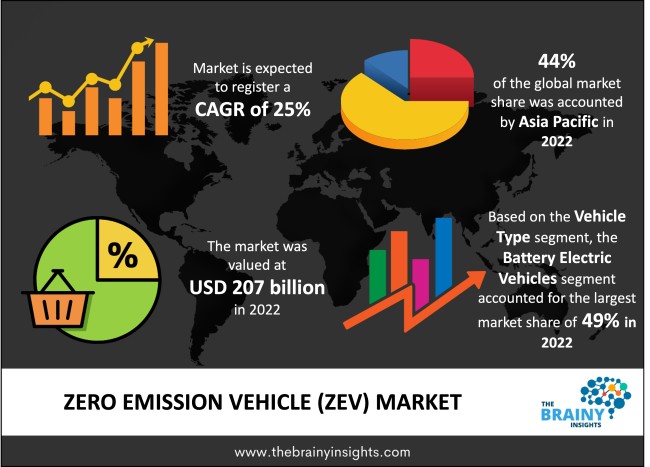
The global zero emission vehicle (ZEV) market is expected to grow from USD 207 billion in 2022 to USD 1927.83 billion by 2032, at a CAGR of 25% during the forecast period 2023-2032. The increasing demand for electric cars will drive the global zero-emission vehicle (ZEV) market.
As the term suggests, a zero-emission vehicle is an automobile that emits no greenhouse gases or any form of exhaust. The power source of these vehicles is environmentally friendly, sustainable, and efficient. They do not emit residual exhaust, smoke, or undesirable particles from the vehicle's tailpipe. The power source can be chemical batteries, solar cells, or hydrogen fuel cells. The battery electric vehicles use solid-state batteries, lithium-ion-based or lead-based batteries as their power sources. This battery provides direct transmission of energy to the vehicle. Direct transmission saves a considerable amount of energy, thereby delivering efficiency, smoother drive, and enhanced fuel economy. The demand for ZEVs will boost with the increase in fossil fuel prices and the friendly policies of governments worldwide. ZEVs are the ideal solution for urban mobility because it combines the emission-free drive with the ease and convenience delivered by the smart features of the new fourth-generation models. With the advancement in technologies, better components and assembly processes are being developed, which has led to the launch of fourth-generation electric vehicles. The market players continue to contribute new advancements with their extensive R&D. With the eye for capturing the market share the major players of the industry are coming with variations in designs, different models, increased comfort, and appealing aesthetic, all of which will provide increased choices for consumers, thereby driving the market’s growth.
Get an overview of this study by requesting a free sample
January 2023 - The next generation of zero-emission vans from First Hydrogen, an automobile and energy developer, has been previewed for the first time. The designs created with EDAG Group are teased in the Generation II photos. Worldwide mobility engineers EDAG were hired by First Hydrogen in 2022 to create the design and style for its zero-emission light commercial vehicles. EDAG is renowned for its top-level concept car development, prototypes, and knowledge in the global automotive industry (LCV). The front and back details of the newest generation are displayed in these earliest pictures. A smart digital screen is visible in the front view, displaying the daytime running light (DRL) configuration to give the van a recognizable face, identity, and exceptional visibility. The regional lithium-ion battery industry will also be driven by the increased push toward building infrastructure for renewable energy sources. Technological improvements in the Chinese and Japanese sectors drive the regional lithium-ion battery industry.
January 2023 - The California Energy Commission (CEC) authorized the funding of USD 2.9 billion for California's zero-emission transportation infrastructure in the middle of December 2022. The money will go towards installing more EV chargers, zero-emission vehicles, transit buses, school buses, and hydrogen refueling equipment. California will receive an additional 90,000 EV chargers with the increased financing. The expected required investment for 90,000 more chargers will be USD 900 million. Currently, California has roughly 80,000 EV chargers. Infrastructure for medium- and heavy-duty ZEVs will get USD 1.7 billion in support. CEC approved ZEV infrastructure and USD 1.4 billion in funding for 2021.
The increasing demand for electric-powered vehicles – the climate change crisis has prompted global government institutions to formulate sustainable and environmentally friendly national policies. The growing emphasis on the green economy has witnessed many economic changes, ranging from the energy and power sectors to the automotive and industrial ones. Conventional fossil fuel vehicles significantly contribute to the increasing greenhouse gas emissions in the environment. A renewed push for designing, developing, and manufacturing electric-powered vehicles that offer better fuel economy, smoother rides, a sustainable environment, and efficient engines has garnered pace in recent years. The technological advancements in lithium-ion batteries, solar power cells, etc., have enabled manufacturers to reduce capital costs and improve efficiency on these non-conventional vehicles. The rising demand for electric vehicles is complementing the supply side. The rising crude oil and energy prices given their non-renewable nature as well as the volatility brought on by the Russia-Ukraine war, have burnt a hole in the average consumer's budget. The long-term costs of electric vehicles are lesser than those of conventional vehicles. Their popularity and adoption have also increased, given the government subsidies offered on their purchase and the increased awareness about climate change amongst the populace. Therefore, the well-segmented supply and demand of electric and non-conventional vehicles, essentially zero-emission vehicles, will drive the market's growth.
High costs of production – the technologies used in the design, development, and production of zero-emission vehicles are highly sophisticated pieces of machinery. They are expensive. Furthermore, the nascent stage of the industry translates to high capital costs and less than anticipated revenue from the market, increasing the manufacturers' liabilities. Therefore, the high capital costs will limit the market's growth. The lack of infrastructure, such as charging stations, servicing centers, and after-delivery consultations, will add to the market's limitations.
The environmental concerns about the disposal of electricals – electric vehicles are the most popular zero-emission vehicles in the market. Lithium-ion batteries primarily power them. Lithium-ion batteries are made or assembled using a variety of chemicals or acids. Used batteries must be properly disposed of to protect people and the environment. They contain environmentally unfavorable cobalt, nickel, and manganese. Batteries that are disposed of carelessly have the risk of catching fire, which can occasionally result in damage to property or fatalities. The vapors harm human health, which can lead to respiratory issues. These batteries are now under closer scrutiny and surveillance due to their detrimental impact on the environment, which will restrain the market's expansion.
Favorable government policies – The effects of climate change are witnessed worldwide with the rising flash floods, fires, droughts, and unseasonal rainfall. These events have devasting impacts on the national economies in terms of lives, property, and capital. The climate change crisis is a global phenomenon, and no nation is isolated from its consequences. Multilateral forums push green investments toward developing renewable energy sources, electric vehicles, and other sustainable practices. The rationale is to invest money now and avoid capital losses in the future brought on by the climate change crisis. The governments are encouraging producing and consuming electric vehicles and using solar power and hydrogen as fuel. The federal institutions have increased the funding, subsidies, and incentives for the automotive industry pushing them towards non-conventional vehicles that generate zero emissions. The governments are also encouraging consumers to adopt these automobiles by offering subsidies and other benefits linked to EV purchases. The increased government funding for research and development of zero-emission vehicles will also positively affect the market. Therefore, favorable government policies for the global zero-emission vehicles (ZEV) market will offer lucrative opportunities in the forecast period.
The rising instances of EVs catching fire – zero-emission vehicles emit no greenhouse gases from their tailpipe, making them dependent on solar, electric, or other forms of fuel, unlike conventional vehicles that use crude oil and gas. The EVs use electric-powered batteries like lithium-ion. Lithium-ion batteries are complexly engineered and put together by pieces of machinery. When they are overworked or overheated, they are susceptible to catching fire. When their production process is not carried out with the utmost care, they are also more likely to catch fire, which could result in dangerous manufacturing abnormalities. Lithium-ion batteries need to be kept dry and in the shade, because they cannot withstand high temperatures. These safety precautions are occasionally disregarded because of carelessness, which results in fires. Lithium-ion battery fires are now often reported on by news outlets. Such negative media coverage damages the product's brand and decreases its adoption rate. Therefore, the market's expansion will be constrained by the rising number of lithium-ion battery fires.
The regions analyzed for the market include North America, Europe, South America, Asia Pacific, the Middle East, and Africa. The Asia Pacific region emerged as the most significant global zero-emission vehicle (ZEV) market, with a 44% market revenue share in 2022. China will dominate the zero-emission vehicle (ZEV) market in the Asia Pacific region. Japan has a strong presence in the regional market as well. Chinese and Japanese businesses produce the most cutting-edge electronics and technology. The region's zero-emission vehicles (ZEV) market is being supported by the demand for these products worldwide, fuelled by their enhanced features and competitive pricing strategies. China is the world's largest producer and consumer of electric vehicles, which accounts for the area's dominance in the market. China and India are two of the world's top polluters, and it is up to them to reduce their carbon emissions to stop climate change. Government programs that provide subsidies and incentives to promote the manufacturing and consumer demand for electric vehicles in their domestic markets are working successfully in the Indian and Chinese automotive industries. The regional zero-emission vehicle (ZEV) industry will similarly be driven by the increased push toward building renewable energy infrastructure and a green economy. A potential consumer market for electronics and electric cars exists in the region, given its large population and expanding economy augmented by a rising disposable income. The need for passenger automobiles has increased due to rising consumer disposable income, resulting in the Asia Pacific region dominating the zero-emission vehicles (ZEV) market.
Asia Pacific region Zero Emission Vehicle (ZEV) Market Share in 2022 - 44%
www.thebrainyinsights.com
Check the geographical analysis of this market by requesting a free sample
The vehicle type segment is divided into battery electric vehicles, plug-in hybrid electric vehicles, hybrid electric vehicles, solar vehicles, and fuel cell electric vehicles. The battery electric vehicles segment dominated the market with a revenue share of around 49% in 2022. Battery electric vehicles run only on the chemical energy stored in rechargeable batteries. The components in the product utilize this chemical energy and produce electric and mechanical energy to operate the vehicle. These vehicles do not have an alternate source of energy or fuel and are solely dependent on the batteries. They are environmentally friendly and smooth and offer better fuel economy, energy saving, and engine performance. The technological advancements in the research, design, and development of sophisticated batteries and their efficient components have led to the production of high-end battery electric vehicles, propelling the segment's growth. Given the fuel economy and no carbon emissions, the increasing demand for battery-operated EVs will drive the segment's dominance in the forecast period.
The price segment is divided into mid-price and luxury. The mid-price segment dominated the market with a revenue share of around 74% in 2022. Most of the population earns an average income which explains the dominance of mid-priced ZEVs. Additionally, the governments incentivize mid-price ZEVs to increase their adoption in the larger population to realize the benefits of reduced emissions unlike in the case of a few luxury car owners.
The top speed segment is divided into less than 100 MPH, 100 to 125 MPH, and more than 125 MPH. MPH stands for miles per hour. The more than 125 MPH segment dominated the market with a revenue share of around 46% in 2022.
The vehicle class segment is divided into commercial vehicles, passenger vehicles, and two-wheelers. The commercial vehicles segment dominated the market with a revenue share of around 44% in 2022. The government initiatives aimed at encouraging the production and consumption of zero-emission vehicles have resulted in the public sectors and institutions adopting electric vehicles in their daily operations. For instance, the use of electric buses and rails in the urban mobility space, along with government incentives associated with purchasing electric taxis and rickshaws, have propelled the segment's growth in the global market. They are also being utilized in other government-operated, owned, or controlled industries to set an example for the commercial and private sectors of the economy. Furthermore, the increasing crude oil and gas prices incentivize commercial operators to switch to electric vehicles to save long-term operational costs.
The vehicle drive type segment is divided into front-wheel drive, rear-wheel drive, and all-wheel drive. The all-wheel drive segment dominated the market with a revenue share of around 54% in 2022. all-wheel drive cars or vehicles power all the wheels of the automobile, offering better control on difficult roads. They offer the best experience for on-road travel. They are the most dominant and emerging segment type in the global market.
| Attribute | Description |
|---|---|
| Market Size | Revenue (USD Billion) |
| Market size value in 2022 | USD 207 Billion |
| Market size value in 2032 | USD 1927.83 Billion |
| CAGR (2023 to 2032) | 25% |
| Historical data | 2019-2021 |
| Base Year | 2022 |
| Forecast | 2023-2032 |
| Region | The regions examined for the market are Europe, Asia Pacific, North America, South America, and Middle East & Africa. |
| Segments | The research segment is based on vehicle type, price, top speed, vehicle class, and vehicle drive type. |
As per The Brainy Insights, the size of the zero-emission vehicle (ZEV) market was valued at USD 207 billion in 2022 to USD 1927.83 billion by 2032.
The global zero-emission vehicle (ZEV) market is growing at a CAGR of 25% during the forecast period 2023-2032.
The market's growth will be influenced by the increasing demand for electric-powered vehicles.
High costs of production could hamper market growth.
1. Introduction
1.1. Objectives of the Study
1.2. Market Definition
1.3. Research Scope
1.4. Currency
1.5. Key Target Audience
2. Research Methodology and Assumptions
3. Executive Summary
4. Premium Insights
4.1. Porter’s Five Forces Analysis
4.2. Value Chain Analysis
4.3. Top Investment Pockets
4.3.1. Market Attractiveness Analysis by Vehicle Type
4.3.2. Market Attractiveness Analysis by Price
4.3.3. Market Attractiveness Analysis by Top Speed
4.3.4. Market Attractiveness Analysis by Vehicle Class
4.3.5. Market Attractiveness Analysis by Vehicle Drive Type
4.3.6. Market Attractiveness Analysis by Region
4.4. Industry Trends
5. Market Dynamics
5.1. Market Evaluation
5.2. Drivers
5.2.1. The increasing demand for electric powered vehicles
5.3. Restraints
5.3.1. High costs of production
5.3.2. The environmental concerns about disposal of electricals
5.4. Opportunities
5.4.1. Favourable government policies
5.5. Challenges
5.5.1. The rising instances of EVs catching fire
6. Global Zero Emission Vehicle (ZEV) Market Analysis and Forecast, By Vehicle Type
6.1. Segment Overview
6.2. Battery Electric Vehicle
6.3. Plug-In Hybrid Electric Vehicle
6.4. Hybrid Electric Vehicle
6.5. Solar Vehicle
6.6. Fuel Cell Electric Vehicle
7. Global Zero Emission Vehicle (ZEV) Market Analysis and Forecast, By Price
7.1. Segment Overview
7.2. Mid-Price
7.3. luxury
8. Global Zero Emission Vehicle (ZEV) Market Analysis and Forecast, By Top Speed
8.1. Segment Overview
8.2. less than 100 MPH
8.3. 100-125 MPH
8.4. More than 125 MPH
9. Global Zero Emission Vehicle (ZEV) Market Analysis and Forecast, By Vehicle Class
9.1. Segment Overview
9.2. Commercial Vehicles
9.3. Passenger Vehicles
9.4. Two-Wheelers
10. Global Zero Emission Vehicle (ZEV) Market Analysis and Forecast, By Vehicle Drive Type
10.1. Segment Overview
10.2. Front Wheel Drive
10.3. Rear Wheel Drive
10.4. All-Wheel Drive
1. Global Zero Emission Vehicle (ZEV) Market Analysis and Forecast, By Regional Analysis
1.1. Segment Overview
1.2. North America
1.2.1. U.S.
1.2.2. Canada
1.2.3. Mexico
1.3. Europe
1.3.1. Germany
1.3.2. France
1.3.3. U.K.
1.3.4. Italy
1.3.5. Spain
1.4. Asia-Pacific
1.4.1. Japan
1.4.2. China
1.4.3. India
1.5. South America
1.5.1. Brazil
1.6. Middle East and Africa
1.6.1. UAE
1.6.2. South Africa
2. Global Zero Emission Vehicle (ZEV) Market-Competitive Landscape
2.1. Overview
2.2. Market Share of Key Players in the Zero Emission Vehicle (ZEV) Market
2.2.1. Global Company Market Share
2.2.2. North America Company Market Share
2.2.3. Europe Company Market Share
2.2.4. APAC Company Market Share
2.3. Competitive Situations and Trends
2.3.1. Product Launches and Developments
2.3.2. Partnerships, Collaborations, and Agreements
2.3.3. Mergers & Acquisitions
2.3.4. Expansions
3. Company Profiles
3.1. BMW AG
3.1.1. Business Overview
3.1.2. Company Snapshot
3.1.3. Company Market Share Analysis
3.1.4. Company Product Portfolio
3.1.5. Recent Developments
3.1.6. SWOT Analysis
3.2. Chevrolet Motor Company
3.2.1. Business Overview
3.2.2. Company Snapshot
3.2.3. Company Market Share Analysis
3.2.4. Company Product Portfolio
3.2.5. Recent Developments
3.2.6. SWOT Analysis
3.3. Ford Motor Company
3.3.1. Business Overview
3.3.2. Company Snapshot
3.3.3. Company Market Share Analysis
3.3.4. Company Product Portfolio
3.3.5. Recent Developments
3.3.6. SWOT Analysis
3.4. General Motors
3.4.1. Business Overview
3.4.2. Company Snapshot
3.4.3. Company Market Share Analysis
3.4.4. Company Product Portfolio
3.4.5. Recent Developments
3.4.6. SWOT Analysis
3.5. Hero Electric
3.5.1. Business Overview
3.5.2. Company Snapshot
3.5.3. Company Market Share Analysis
3.5.4. Company Product Portfolio
3.5.5. Recent Developments
3.5.6. SWOT Analysis
3.6. Hyundai Motor Company
3.6.1. Business Overview
3.6.2. Company Snapshot
3.6.3. Company Market Share Analysis
3.6.4. Company Product Portfolio
3.6.5. Recent Developments
3.6.6. SWOT Analysis
3.7. Mahindra Electric Mobility Limited
3.7.1. Business Overview
3.7.2. Company Snapshot
3.7.3. Company Market Share Analysis
3.7.4. Company Product Portfolio
3.7.5. Recent Developments
3.7.6. SWOT Analysis
3.8. Tata Motors
3.8.1. Business Overview
3.8.2. Company Snapshot
3.8.3. Company Market Share Analysis
3.8.4. Company Product Portfolio
3.8.5. Recent Developments
3.8.6. SWOT Analysis
3.9. Tesla Inc.
3.9.1. Business Overview
3.9.2. Company Snapshot
3.9.3. Company Market Share Analysis
3.9.4. Company Product Portfolio
3.9.5. Recent Developments
3.9.6. SWOT Analysis
3.10. Toyota Motor Corporation
3.10.1. Business Overview
3.10.2. Company Snapshot
3.10.3. Company Market Share Analysis
3.10.4. Company Product Portfolio
3.10.5. Recent Developments
3.10.6. SWOT Analysis
List of Table
1. Global Zero Emission Vehicle (ZEV) Market, By Vehicle Type, 2019-2032 (USD Billion)
2. Global Battery Electric Vehicle Zero Emission Vehicle (ZEV) Market, By Region, 2019-2032
3. Global Plug-In Hybrid Electric Vehicle Zero Emission Vehicle (ZEV) Market, By Region, 2019-2032
4. Global Hybrid Electric Vehicle Zero Emission Vehicle (ZEV) Market, By Region, 2019-2032
5. Global Solar Vehicle Zero Emission Vehicle (ZEV) Market, By Region, 2019-2032
6. Global Fuel Cell Electric Vehicle Zero Emission Vehicle (ZEV) Market, By Region, 2019-2032
7. Global Zero Emission Vehicle (ZEV) Market, By Price, 2019-2032 (USD Billion)
8. Global Mid-Price Zero Emission Vehicle (ZEV) Market, By Region, 2019-2032
9. Global luxury Zero Emission Vehicle (ZEV) Market, By Region, 2019-2032
10. Global Zero Emission Vehicle (ZEV) Market, By Top Speed, 2019-2032 (USD Billion)
11. Global less than 100 MPH Zero Emission Vehicle (ZEV) Market, By Region, 2019-2032
12. Global 100-125 MPH Zero Emission Vehicle (ZEV) Market, By Region, 2019-2032
13. Global More than 125 MPH Zero Emission Vehicle (ZEV) Market, By Region, 2019-2032
14. Global Zero Emission Vehicle (ZEV) Market, By Vehicle Class, 2019-2032 (USD Billion)
15. Global Commercial Vehicles Zero Emission Vehicle (ZEV) Market, By Region, 2019-2032
16. Global Passenger Vehicles Zero Emission Vehicle (ZEV) Market, By Region, 2019-2032
17. Global Two-Wheelers Zero Emission Vehicle (ZEV) Market, By Region, 2019-2032
18. Global Zero Emission Vehicle (ZEV) Market, By Vehicle Drive Type, 2019-2032 (USD Billion)
19. Global Front Wheel Drive Zero Emission Vehicle (ZEV) Market, By Region, 2019-2032
20. Global Rear Wheel Drive Zero Emission Vehicle (ZEV) Market, By Region, 2019-2032
21. Global All-Wheel Drive Zero Emission Vehicle (ZEV) Market, By Region, 2019-2032
22. Global Zero Emission Vehicle (ZEV) Market, By Region, 2019-2032 (USD Billion)
23. North America Zero Emission Vehicle (ZEV) Market, By Vehicle Type, 2019-2032 (USD Billion)
24. North America Zero Emission Vehicle (ZEV) Market, By Price, 2019-2032 (USD Billion)
25. North America Zero Emission Vehicle (ZEV) Market, By Top Speed, 2019-2032 (USD Billion)
26. North America Zero Emission Vehicle (ZEV) Market, By Vehicle Class, 2019-2032 (USD Billion)
27. North America Zero Emission Vehicle (ZEV) Market, By Vehicle Drive Type, 2019-2032 (USD Billion)
28. U.S. Zero Emission Vehicle (ZEV) Market, By Vehicle Type, 2019-2032 (USD Billion)
29. U.S. Zero Emission Vehicle (ZEV) Market, By Price, 2019-2032 (USD Billion)
30. U.S. Zero Emission Vehicle (ZEV) Market, By Top Speed, 2019-2032 (USD Billion)
31. U.S. Zero Emission Vehicle (ZEV) Market, By Vehicle Class, 2019-2032 (USD Billion)
32. U.S. Zero Emission Vehicle (ZEV) Market, By Vehicle Drive Type, 2019-2032 (USD Billion)
33. Canada Zero Emission Vehicle (ZEV) Market, By Vehicle Type, 2019-2032 (USD Billion)
34. Canada Zero Emission Vehicle (ZEV) Market, By Price, 2019-2032 (USD Billion)
35. Canada Zero Emission Vehicle (ZEV) Market, By Top Speed, 2019-2032 (USD Billion)
36. Canada Zero Emission Vehicle (ZEV) Market, By Vehicle Class, 2019-2032 (USD Billion)
37. Canada Zero Emission Vehicle (ZEV) Market, By Vehicle Drive Type, 2019-2032 (USD Billion)
38. Mexico Zero Emission Vehicle (ZEV) Market, By Vehicle Type, 2019-2032 (USD Billion)
39. Mexico Zero Emission Vehicle (ZEV) Market, By Price, 2019-2032 (USD Billion)
40. Mexico Zero Emission Vehicle (ZEV) Market, By Top Speed, 2019-2032 (USD Billion)
41. Mexico Zero Emission Vehicle (ZEV) Market, By Vehicle Class, 2019-2032 (USD Billion)
42. Mexico Zero Emission Vehicle (ZEV) Market, By Vehicle Drive Type, 2019-2032 (USD Billion)
43. Europe Zero Emission Vehicle (ZEV) Market, By Vehicle Type, 2019-2032 (USD Billion)
44. Europe Zero Emission Vehicle (ZEV) Market, By Price, 2019-2032 (USD Billion)
45. Europe Zero Emission Vehicle (ZEV) Market, By Top Speed, 2019-2032 (USD Billion)
46. Europe Zero Emission Vehicle (ZEV) Market, By Vehicle Class, 2019-2032 (USD Billion)
47. Europe Zero Emission Vehicle (ZEV) Market, By Vehicle Drive Type, 2019-2032 (USD Billion)
48. Germany Zero Emission Vehicle (ZEV) Market, By Vehicle Type, 2019-2032 (USD Billion)
49. Germany Zero Emission Vehicle (ZEV) Market, By Price, 2019-2032 (USD Billion)
50. Germany Zero Emission Vehicle (ZEV) Market, By Top Speed, 2019-2032 (USD Billion)
51. Germany Zero Emission Vehicle (ZEV) Market, By Vehicle Class, 2019-2032 (USD Billion)
52. Germany Zero Emission Vehicle (ZEV) Market, By Vehicle Drive Type, 2019-2032 (USD Billion)
53. France Zero Emission Vehicle (ZEV) Market, By Vehicle Type, 2019-2032 (USD Billion)
54. France Zero Emission Vehicle (ZEV) Market, By Price, 2019-2032 (USD Billion)
55. France Zero Emission Vehicle (ZEV) Market, By Top Speed, 2019-2032 (USD Billion)
56. France Zero Emission Vehicle (ZEV) Market, By Vehicle Class, 2019-2032 (USD Billion)
57. France Zero Emission Vehicle (ZEV) Market, By Vehicle Drive Type, 2019-2032 (USD Billion)
58. U.K. Zero Emission Vehicle (ZEV) Market, By Vehicle Type, 2019-2032 (USD Billion)
59. U.K. Zero Emission Vehicle (ZEV) Market, By Price, 2019-2032 (USD Billion)
60. U.K. Zero Emission Vehicle (ZEV) Market, By Top Speed, 2019-2032 (USD Billion)
61. U.K. Zero Emission Vehicle (ZEV) Market, By Vehicle Class, 2019-2032 (USD Billion)
62. U.K. Zero Emission Vehicle (ZEV) Market, By Vehicle Drive Type, 2019-2032 (USD Billion)
63. Italy Zero Emission Vehicle (ZEV) Market, By Vehicle Type, 2019-2032 (USD Billion)
64. Italy Zero Emission Vehicle (ZEV) Market, By Price, 2019-2032 (USD Billion)
65. Italy Zero Emission Vehicle (ZEV) Market, By Top Speed, 2019-2032 (USD Billion)
66. Italy Zero Emission Vehicle (ZEV) Market, By Vehicle Class, 2019-2032 (USD Billion)
67. Italy America Zero Emission Vehicle (ZEV) Market, By Vehicle Drive Type, 2019-2032 (USD Billion)
68. Spain Zero Emission Vehicle (ZEV) Market, By Vehicle Type, 2019-2032 (USD Billion)
69. Spain Zero Emission Vehicle (ZEV) Market, By Price, 2019-2032 (USD Billion)
70. Spain Zero Emission Vehicle (ZEV) Market, By Top Speed, 2019-2032 (USD Billion)
71. Spain Zero Emission Vehicle (ZEV) Market, By Vehicle Class, 2019-2032 (USD Billion)
72. Spain Zero Emission Vehicle (ZEV) Market, By Vehicle Drive Type, 2019-2032 (USD Billion)
73. Asia Pacific Zero Emission Vehicle (ZEV) Market, By Vehicle Type, 2019-2032 (USD Billion)
74. Asia Pacific Zero Emission Vehicle (ZEV) Market, By Price, 2019-2032 (USD Billion)
75. Asia Pacific Zero Emission Vehicle (ZEV) Market, By Top Speed, 2019-2032 (USD Billion)
76. Asia Pacific Zero Emission Vehicle (ZEV) Market, By Vehicle Class, 2019-2032 (USD Billion)
77. Asia Pacific Zero Emission Vehicle (ZEV) Market, By Vehicle Drive Type, 2019-2032 (USD Billion)
78. Japan Zero Emission Vehicle (ZEV) Market, By Vehicle Type, 2019-2032 (USD Billion)
79. Japan Zero Emission Vehicle (ZEV) Market, By Price, 2019-2032 (USD Billion)
80. Japan Zero Emission Vehicle (ZEV) Market, By Top Speed, 2019-2032 (USD Billion)
81. Japan Zero Emission Vehicle (ZEV) Market, By Vehicle Class, 2019-2032 (USD Billion)
82. Japan Zero Emission Vehicle (ZEV) Market, By Vehicle Drive Type, 2019-2032 (USD Billion)
83. China Zero Emission Vehicle (ZEV) Market, By Vehicle Type, 2019-2032 (USD Billion)
84. China Zero Emission Vehicle (ZEV) Market, By Price, 2019-2032 (USD Billion)
85. China Zero Emission Vehicle (ZEV) Market, By Top Speed, 2019-2032 (USD Billion)
86. China Zero Emission Vehicle (ZEV) Market, By Vehicle Class, 2019-2032 (USD Billion)
87. China Zero Emission Vehicle (ZEV) Market, By Vehicle Drive Type, 2019-2032 (USD Billion)
88. India Zero Emission Vehicle (ZEV) Market, By Vehicle Type, 2019-2032 (USD Billion)
89. India Zero Emission Vehicle (ZEV) Market, By Price, 2019-2032 (USD Billion)
90. India Zero Emission Vehicle (ZEV) Market, By Top Speed, 2019-2032 (USD Billion)
91. India Zero Emission Vehicle (ZEV) Market, By Vehicle Class, 2019-2032 (USD Billion)
92. India Zero Emission Vehicle (ZEV) Market, By Vehicle Drive Type, 2019-2032 (USD Billion)
93. South America Zero Emission Vehicle (ZEV) Market, By Vehicle Type, 2019-2032 (USD Billion)
94. South America Zero Emission Vehicle (ZEV) Market, By Price, 2019-2032 (USD Billion)
95. South America Zero Emission Vehicle (ZEV) Market, By Top Speed, 2019-2032 (USD Billion)
96. South America Zero Emission Vehicle (ZEV) Market, By Vehicle Class, 2019-2032 (USD Billion)
97. South America Zero Emission Vehicle (ZEV) Market, By Vehicle Drive Type, 2019-2032 (USD Billion)
98. Brazil Zero Emission Vehicle (ZEV) Market, By Vehicle Type, 2019-2032 (USD Billion)
99. Brazil Zero Emission Vehicle (ZEV) Market, By Price, 2019-2032 (USD Billion)
100. Brazil Zero Emission Vehicle (ZEV) Market, By Top Speed, 2019-2032 (USD Billion)
101. Brazil Zero Emission Vehicle (ZEV) Market, By Vehicle Class, 2019-2032 (USD Billion)
102. Brazil Zero Emission Vehicle (ZEV) Market, By Vehicle Drive Type, 2019-2032 (USD Billion)
103. Middle East and Africa Zero Emission Vehicle (ZEV) Market, By Vehicle Type, 2019-2032 (USD Billion)
104. Middle East and Africa Zero Emission Vehicle (ZEV) Market, By Price, 2019-2032 (USD Billion)
105. Middle East and Africa Zero Emission Vehicle (ZEV) Market, By Top Speed, 2019-2032 (USD Billion)
106. Middle East and Africa Zero Emission Vehicle (ZEV) Market, By Vehicle Class, 2019-2032 (USD Billion)
107. Middle East and Africa Zero Emission Vehicle (ZEV) Market, By Vehicle Drive Type, 2019-2032 (USD Billion)
108. UAE Zero Emission Vehicle (ZEV) Market, By Vehicle Type, 2019-2032 (USD Billion)
109. UAE Zero Emission Vehicle (ZEV) Market, By Price, 2019-2032 (USD Billion)
110. UAE Zero Emission Vehicle (ZEV) Market, By Top Speed, 2019-2032 (USD Billion)
111. UAE Zero Emission Vehicle (ZEV) Market, By Vehicle Class, 2019-2032 (USD Billion)
112. UAE Zero Emission Vehicle (ZEV) Market, By Vehicle Drive Type, 2019-2032 (USD Billion)
113. South Africa Zero Emission Vehicle (ZEV) Market, By Vehicle Type, 2019-2032 (USD Billion)
114. South Africa Zero Emission Vehicle (ZEV) Market, By Price, 2019-2032 (USD Billion)
115. South Africa Zero Emission Vehicle (ZEV) Market, By Top Speed, 2019-2032 (USD Billion)
116. South Africa Zero Emission Vehicle (ZEV) Market, By Vehicle Class, 2019-2032 (USD Billion)
117. South Africa Zero Emission Vehicle (ZEV) Market, By Vehicle Drive Type, 2019-2032 (USD Billion)
List of Figures
1. Global Zero Emission Vehicle (ZEV) Market Segmentation
2. Zero Emission Vehicle (ZEV) Market: Research Methodology
3. Market Size Estimation Methodology: Bottom-Up Approach
4. Market Size Estimation Methodology: Top-Down Approach
5. Data Triangulation
6. Porter’s Five Forces Analysis
7. Value Chain Analysis
8. Global Zero Emission Vehicle (ZEV) Market Attractiveness Analysis by Vehicle Type
9. Global Zero Emission Vehicle (ZEV) Market Attractiveness Analysis by Price
10. Global Zero Emission Vehicle (ZEV) Market Attractiveness Analysis by Top Speed
11. Global Zero Emission Vehicle (ZEV) Market Attractiveness Analysis by Vehicle Class
12. Global Zero Emission Vehicle (ZEV) Market Attractiveness Analysis by Vehicle Drive Type
13. Global Zero Emission Vehicle (ZEV) Market Attractiveness Analysis by Region
14. Global Zero Emission Vehicle (ZEV) Market: Dynamics
15. Global Zero Emission Vehicle (ZEV) Market Share by Vehicle Type (2022 & 2032)
16. Global Zero Emission Vehicle (ZEV) Market Share by Price (2022 & 2032)
17. Global Zero Emission Vehicle (ZEV) Market Share by Top Speed (2022 & 2032)
18. Global Zero Emission Vehicle (ZEV) Market Share by Vehicle Class (2022 & 2032)
19. Global Zero Emission Vehicle (ZEV) Market Share by Vehicle Drive Type (2022 & 2032)
20. Global Zero Emission Vehicle (ZEV) Market Share by Regions (2022 & 2032)
21. Global Zero Emission Vehicle (ZEV) Market Share by Company (2022)
This study forecasts revenue at global, regional, and country levels from 2019 to 2032. The Brainy Insights has segmented the zero emission vehicle (ZEV) market based on below mentioned segments:
Zero Emission Vehicle (ZEV) Market by Vehicle Type:
Zero Emission Vehicle (ZEV) Market by Price:
Zero Emission Vehicle (ZEV) Market by Top Speed:
Zero Emission Vehicle (ZEV) Market by Vehicle Class:
Zero Emission Vehicle (ZEV) Market by Vehicle Drive Type:
Zero Emission Vehicle (ZEV) Market by Region:
Research has its special purpose to undertake marketing efficiently. In this competitive scenario, businesses need information across all industry verticals; the information about customer wants, market demand, competition, industry trends, distribution channels etc. This information needs to be updated regularly because businesses operate in a dynamic environment. Our organization, The Brainy Insights incorporates scientific and systematic research procedures in order to get proper market insights and industry analysis for overall business success. The analysis consists of studying the market from a miniscule level wherein we implement statistical tools which helps us in examining the data with accuracy and precision.
Our research reports feature both; quantitative and qualitative aspects for any market. Qualitative information for any market research process are fundamental because they reveal the customer needs and wants, usage and consumption for any product/service related to a specific industry. This in turn aids the marketers/investors in knowing certain perceptions of the customers. Qualitative research can enlighten about the different product concepts and designs along with unique service offering that in turn, helps define marketing problems and generate opportunities. On the other hand, quantitative research engages with the data collection process through interviews, e-mail interactions, surveys and pilot studies. Quantitative aspects for the market research are useful to validate the hypotheses generated during qualitative research method, explore empirical patterns in the data with the help of statistical tools, and finally make the market estimations.
The Brainy Insights offers comprehensive research and analysis, based on a wide assortment of factual insights gained through interviews with CXOs and global experts and secondary data from reliable sources. Our analysts and industry specialist assume vital roles in building up statistical tools and analysis models, which are used to analyse the data and arrive at accurate insights with exceedingly informative research discoveries. The data provided by our organization have proven precious to a diverse range of companies, facilitating them to address issues such as determining which products/services are the most appealing, whether or not customers use the product in the manner anticipated, the purchasing intentions of the market and many others.
Our research methodology encompasses an idyllic combination of primary and secondary initiatives. Key phases involved in this process are listed below:

The phase involves the gathering and collecting of market data and its related information with the help of different sources & research procedures.

The data procurement stage involves in data gathering and collecting through various data sources.
This stage involves in extensive research. These data sources includes:
Purchased Database: Purchased databases play a crucial role in estimating the market sizes irrespective of the domain. Our purchased database includes:
Primary Research: The Brainy Insights interacts with leading companies and experts of the concerned domain to develop the analyst team’s market understanding and expertise. It improves and substantiates every single data presented in the market reports. Primary research mainly involves in telephonic interviews, E-mail interactions and face-to-face interviews with the raw material providers, manufacturers/producers, distributors, & independent consultants. The interviews that we conduct provides valuable data on market size and industry growth trends prevailing in the market. Our organization also conducts surveys with the various industry experts in order to gain overall insights of the industry/market. For instance, in healthcare industry we conduct surveys with the pharmacists, doctors, surgeons and nurses in order to gain insights and key information of a medical product/device/equipment which the customers are going to usage. Surveys are conducted in the form of questionnaire designed by our own analyst team. Surveys plays an important role in primary research because surveys helps us to identify the key target audiences of the market. Additionally, surveys helps to identify the key target audience engaged with the market. Our survey team conducts the survey by targeting the key audience, thus gaining insights from them. Based on the perspectives of the customers, this information is utilized to formulate market strategies. Moreover, market surveys helps us to understand the current competitive situation of the industry. To be precise, our survey process typically involve with the 360 analysis of the market. This analytical process begins by identifying the prospective customers for a product or service related to the market/industry to obtain data on how a product/service could fit into customers’ lives.

Secondary Research: The secondary data sources includes information published by the on-profit organizations such as World bank, WHO, company fillings, investor presentations, annual reports, national government documents, statistical databases, blogs, articles, white papers and others. From the annual report, we analyse a company’s revenue to understand the key segment and market share of that organization in a particular region. We analyse the company websites and adopt the product mapping technique which is important for deriving the segment revenue. In the product mapping method, we select and categorize the products offered by the companies catering to domain specific market, deduce the product revenue for each of the companies so as to get overall estimation of the market size. We also source data and analyses trends based on information received from supply side and demand side intermediaries in the value chain. The supply side denotes the data gathered from supplier, distributor, wholesaler and the demand side illustrates the data gathered from the end customers for respective market domain.

The supply side for a domain specific market is analysed by:
The demand side for the market is estimated through:
In-house Library: Apart from these third-party sources, we have our in-house library of qualitative and quantitative information. Our in-house database includes market data for various industry and domains. These data are updated on regular basis as per the changing market scenario. Our library includes, historic databases, internal audit reports and archives.
Sometimes there are instances where there is no metadata or raw data available for any domain specific market. For those cases, we use our expertise to forecast and estimate the market size in order to generate comprehensive data sets. Our analyst team adopt a robust research technique in order to produce the estimates:
Data Synthesis: This stage involves the analysis & mapping of all the information obtained from the previous step. It also involves in scrutinizing the data for any discrepancy observed while data gathering related to the market. The data is collected with consideration to the heterogeneity of sources. Robust scientific techniques are in place for synthesizing disparate data sets and provide the essential contextual information that can orient market strategies. The Brainy Insights has extensive experience in data synthesis where the data passes through various stages:


Market Deduction & Formulation: The final stage comprises of assigning data points at appropriate market spaces so as to deduce feasible conclusions. Analyst perspective & subject matter expert based holistic form of market sizing coupled with industry analysis also plays a crucial role in this stage.
This stage involves in finalization of the market size and numbers that we have collected from data integration step. With data interpolation, it is made sure that there is no gap in the market data. Successful trend analysis is done by our analysts using extrapolation techniques, which provide the best possible forecasts for the market.
Data Validation & Market Feedback: Validation is the most important step in the process. Validation & re-validation via an intricately designed process helps us finalize data-points to be used for final calculations.

The Brainy Insights interacts with leading companies and experts of the concerned domain to develop the analyst team’s market understanding and expertise. It improves and substantiates every single data presented in the market reports. The data validation interview and discussion panels are typically composed of the most experienced industry members. The participants include, however, are not limited to:
Moreover, we always validate our data and findings through primary respondents from all the major regions we are working on.


Free Customization
Fortune 500 Clients
Free Yearly Update On Purchase Of Multi/Corporate License
Companies Served Till Date