- +1-315-215-1633
- sales@thebrainyinsights.com

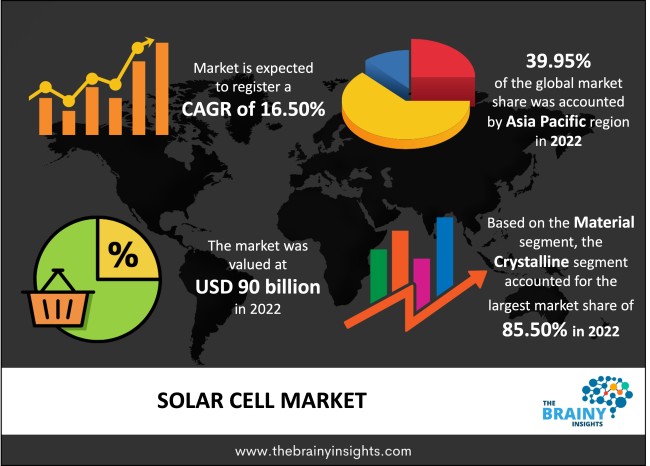
The global solar cell market was valued at USD 90 billion in 2022 and growing at a CAGR of 16.50% from 2023 to 2032. The market is expected to reach USD 414.5 billion by 2032. Solar cells, also known as photovoltaic cells, convert sun energy into electrical energy utilizing the photovoltaic effect. The biggest arrangement of solar cells are called arrays, which are comprised of thousands of individual cells and can be assembled into solar farms to change over sunlight into power for huge-scale commercial, industrial and residential use.
Solar cells, called photovoltaic cells, convert sun energy into electrical energy utilizing the photovoltaic impact. The majority of these are silicon cells, which can be either amorphous (non-crystalline) or polycrystalline (single crystal) and have varying conversion efficiencies and costs. However, with technological advances, these boards' sunlight-based productivity is supposed to rise. The biggest arrangement of solar cells is called arrays, which are comprised of thousands of individual cells and can be assembled into solar farms to change over daylight into power for large-scale commercial, industrial and residential use. Solar cell panels, or, more frequently, solar panels, are smaller groups of cells. The various types of solar panels have different purposes, from being put on housetops to supplant or enhance a homegrown power supply or to give electric capacity where regular sources are inaccessible or costly to introduce. On the littlest level, solar cells are utilized in numerous consumer products, including toys, calculators and radios.
Get an overview of this study by requesting a free sample
Rising Environmental Concerns- Solar energy is a clean and renewable energy source that produces power without discharging ozone-depleting substances or other harmful pollutants. There is a growing demand for cleaner energy options as the global community becomes more aware of the environmental issues caused by fossil fuels. Solar cells are viewed as a manageable solution to reduce carbon emissions and combat climate change. Solar power age lessens the carbon impression of power creation. By harnessing energy from the sun, solar cells assist with diminishing the dependence on petroleum products, which are the primary source of carbon dioxide emissions. This decrease in carbon emissions aligns with global climate goals and commitments making solar energy an attractive decision for both individuals and governments.
High Initial Costs- The expense of buying and installing solar panels can be substantial, especially for residential and small-scale consumers. This upfront cost incorporates the cost of solar cells, inverters, mounting systems, wiring, and installation labor. Individuals or businesses may not consider solar energy due to these costs. Numerous customers see solar energy as a luxury instead of a reasonable choice. This perception can discourage them from exploring solar as an energy source, in any event, when it very well might be financially beneficial over the long haul. Although solar energy can prompt long-haul savings on electricity bills, the payback period, or the time it takes to recover the underlying venture, can be somewhat extended. Depending upon factors like location, energy consumption, and local incentives, the reserve funds might require a long while or even a decade to balance the underlying venture. This extended payback period can discourage potential customers.
Government Incentives- Government incentives can fundamentally improve the ROI for solar panel installations. By decreasing the payback period and increasing the long-term savings on electricity bills, these incentives make solar energy more monetarily appealing to buyers and organizations. Governments often provide financial incentives, for example, tax reductions or refunds, to diminish the expense of buying and installing solar panels. These incentives effectively lower down the upfront investment required for solar installations, making them more reasonable for people and organizations. In the solar industry, government support can encourage research and development. This advancement can prompt the improvement of more proficient and savvy solar cell innovations, further supporting the market's development potential. Government motivations align with ecological objectives, such as reducing greenhouse gas emissions and combating climate change. Governments can contribute to environmental sustainability and lessen the impact of energy production on the environment by promoting clean energy sources like solar power.
The regions analyzed for the market include North America, Europe, South America, Asia Pacific, the Middle East, and Africa. Asia Pacific emerged as the largest market for the global solar cell market, with a 39.95% share of the market revenue in 2022.
Asia-Pacific region will represent the most significant portion of the overall industry with income development. The Asia Pacific region has arisen as a critical participant in the global solar cell market, with a few nations encountering significant development in solar energy capacity. China, India, Japan, and Australia were among the main nations in the locale driving the development of solar energy establishments. China has reliably been the most prominent solar cell market in the Asia Pacific and the world. The Chinese government had set ambitious goals for renewable energy and provided various incentives and subsidies to the domestic solar industry. The region's solar cell market has grown as a result of advancements in solar technology, such as energy storage solutions and more effective solar panels. Governments in these countries have been implementing policies and regulatory frameworks to facilitate solar investments, attract foreign capital, and expand their renewable energy portfolios.
Asia Pacific Region Solar Cell Market Share in 2022 - 39.95%
www.thebrainyinsights.com
Check the geographical analysis of this market by requesting a free sample
The material segment is divided into crystalline and thin film. The crystalline is further divided into N material and P material. The crystalline segment dominated the market, with a market share of around 85.50% in 2022. Crystalline silicon solar cells have a high energy transformation productivity, implying they can change over a critical part of daylight into power. Because of their high efficiency, many applications, including residential, commercial, and utility-scale solar installations, favour them. Crystalline silicon solar cell technology has been in need for a long time and is deeply rooted. It has a demonstrated history of unwavering quality and strength, which is fundamental for long-haul energy creation.
The product segment is divided into BSF, PERC/PERL/PERT/TOPCON, HJT, IBC & MWT and others. The BSF segment dominated the market, with a market share of around 27.56% in 2022. BSF (Back Surface Field) is a plan highlight utilized in the production of crystalline silicon solar cells. This method is used to boost these solar cells' performance and effectiveness. BSF contributes to the reduction of recombination losses, which improves the solar cell's efficiency as a whole. More electrons and openings are gathered and changed over into power. BSF can help the open-circuit voltage of the solar cell, which is a significant boundary for its presentation. Executing BSF innovation in solar cell manufacturing can be financially savvy since it further develops cell effectiveness without requiring tremendous changes in the assembling system.
The technology segment is divided into monocrystalline, polycrystalline, cadmium telluride (CDTE), amorphous silicon (A-Si) and copper indium gallium diselenide. The monocrystalline segment dominated the market, with a market share of around 28.12% in 2022. Monocrystalline solar cells regularly have higher energy change proficiency contrasted with different sorts of solar cells, like polycrystalline and thin-film. Monocrystalline cells are space-efficient, making them reasonable for establishments with restricted rooftop or ground space. They can create more power per square foot compared to some other technologies. Monocrystalline solar cells perform well under low-light conditions, like cloudy days or during the early morning and late afternoon when the angle of sunlight is less favorable.
The end user segment is divided into residential, commercial and utility. The utility segment dominated the market, with a market share of around 42.14% in 2022. The utility area is one of the biggest clients of solar cells and sun powered energy in light of multiple factors. Utility-scale solar power plants can be huge, with the ability to produce a lot of power. These huge establishments can create many megawatts (MW) to gigawatts (GW) of power, making them equipped for meeting the energy needs of thousands of homes and organizations. Because it reduces reliance on imported fossil fuels, the production of solar power gives utilities a degree of energy independence. This autonomy can improve energy security, especially in districts with international energy supply concerns.
| Attribute | Description |
|---|---|
| Market Size | Revenue (USD Billion) |
| Market size value in 2022 | USD 90 Billion |
| Market size value in 2032 | USD 414.5 Billion |
| CAGR (2023 to 2032) | 16.50% |
| Historical data | 2019-2021 |
| Base Year | 2022 |
| Forecast | 2023-2032 |
| Region | The regions analyzed for the market are Asia Pacific, Europe, South America, North America, and Middle East & Africa. Furthermore, the regions are further analyzed at the country level. |
| Segments | Material, Product, Technology, End User |
As per The Brainy Insights, the size of the solar cell market was valued at USD 90 billion in 2022 to USD 414.5 billion by 2032.
The global solar cell market is growing at a CAGR of 16.50% during the forecast period 2023-2032.
The Asia Pacific region emerged as the largest market for the solar cell.
The rising environmental concerns will influence the market's growth.
1. Introduction
1.1. Objectives of the Study
1.2. Market Definition
1.3. Research Scope
1.4. Currency
1.5. Key Target Audience
2. Research Methodology and Assumptions
3. Executive Summary
4. Premium Insights
4.1. Porter’s Five Forces Analysis
4.2. Value Chain Analysis
4.3. Top Investment Pockets
4.3.1. Market Attractiveness Analysis by Material
4.3.2. Market Attractiveness Analysis by Product
4.3.3. Market Attractiveness Analysis by Technology
4.3.4. Market Attractiveness Analysis by End User
4.3.5. Market Attractiveness Analysis by Region
4.4. Industry Trends
5. Market Dynamics
5.1. Market Evaluation
5.2. Drivers
5.2.1. Rising Environmental Concerns
5.3. Restraints
5.3.1. High Initial Costs
5.4. Opportunities
5.4.1. Government Incentives
5.5. Challenges
5.5.1. Regulatory Uncertainty
6. Global Solar Cell Market Analysis and Forecast, By Material
6.1. Segment Overview
6.2. Crystalline
6.2.1. N Material
6.2.2. P Material
6.3. Thin Film
7. Global Solar Cell Market Analysis and Forecast, By Product
7.1. Segment Overview
7.2. BSF
7.3. PERC/PERL/PERT/TOPCON
7.4. HJT
7.5. IBC & MWT
7.6. Others
8. Global Solar Cell Market Analysis and Forecast, By Technology
8.1. Segment Overview
8.2. Monocrystalline
8.3. Polycrystalline
8.4. Cadmium Telluride (CDTE)
8.5. Amorphous Silicon (A-Si)
8.6. Copper Indium Gallium Diselenide
9. Global Solar Cell Market Analysis and Forecast, By End User
9.1. Segment Overview
9.2. Residential
9.3. Commercial
9.4. Utility
10. Global Solar Cell Market Analysis and Forecast, By Regional Analysis
10.1. Segment Overview
10.2. North America
10.2.1. U.S.
10.2.2. Canada
10.2.3. Mexico
10.3. Europe
10.3.1. Germany
10.3.2. France
10.3.3. U.K.
10.3.4. Italy
10.3.5. Spain
10.4. Asia-Pacific
10.4.1. Japan
10.4.2. China
10.4.3. India
10.5. South America
10.5.1. Brazil
10.6. Middle East and Africa
10.6.1. UAE
10.6.2. South Africa
11. Global Solar Cell Market-Competitive Landscape
11.1. Overview
11.2. Market Share of Key Players in the Solar Cell Market
11.2.1. Global Company Market Share
11.2.2. North America Company Market Share
11.2.3. Europe Company Market Share
11.2.4. APAC Company Market Share
11.3. Competitive Situations and Trends
11.3.1. Product Launches and Developments
11.3.2. Partnerships, Collaborations, and Agreements
11.3.3. Mergers & Acquisitions
11.3.4. Expansions
12. Company Profiles
12.1. Panasonic Corporation
12.1.1. Business Overview
12.1.2. Company Snapshot
12.1.3. Company Market Share Analysis
12.1.4. Company Product Portfolio
12.1.5. Recent Developments
12.1.6. SWOT Analysis
12.2. JINERGY
12.2.1. Business Overview
12.2.2. Company Snapshot
12.2.3. Company Market Share Analysis
12.2.4. Company Product Portfolio
12.2.5. Recent Developments
12.2.6. SWOT Analysis
12.3. First Solar
12.3.1. Business Overview
12.3.2. Company Snapshot
12.3.3. Company Market Share Analysis
12.3.4. Company Product Portfolio
12.3.5. Recent Developments
12.3.6. SWOT Analysis
12.4. SunPower Corporation
12.4.1. Business Overview
12.4.2. Company Snapshot
12.4.3. Company Market Share Analysis
12.4.4. Company Product Portfolio
12.4.5. Recent Developments
12.4.6. SWOT Analysis
12.5. Premier Energies
12.5.1. Business Overview
12.5.2. Company Snapshot
12.5.3. Company Market Share Analysis
12.5.4. Company Product Portfolio
12.5.5. Recent Developments
12.5.6. SWOT Analysis
12.6. JinkoSolar
12.6.1. Business Overview
12.6.2. Company Snapshot
12.6.3. Company Market Share Analysis
12.6.4. Company Product Portfolio
12.6.5. Recent Developments
12.6.6. SWOT Analysis
12.7. SolarWorld AG
12.7.1. Business Overview
12.7.2. Company Snapshot
12.7.3. Company Market Share Analysis
12.7.4. Company Product Portfolio
12.7.5. Recent Developments
12.7.6. SWOT Analysis
12.8. SunEdison, Inc
12.8.1. Business Overview
12.8.2. Company Snapshot
12.8.3. Company Market Share Analysis
12.8.4. Company Product Portfolio
12.8.5. Recent Developments
12.8.6. SWOT Analysis
12.9. Tata Power Systems Limited
12.9.1. Business Overview
12.9.2. Company Snapshot
12.9.3. Company Market Share Analysis
12.9.4. Company Product Portfolio
12.9.5. Recent Developments
12.9.6. SWOT Analysis
12.10. Sharp Corporation
12.10.1. Business Overview
12.10.2. Company Snapshot
12.10.3. Company Market Share Analysis
12.10.4. Company Product Portfolio
12.10.5. Recent Developments
12.10.6. SWOT Analysis
12.11. Trina Solar Limited
12.11.1. Business Overview
12.11.2. Company Snapshot
12.11.3. Company Market Share Analysis
12.11.4. Company Product Portfolio
12.11.5. Recent Developments
12.11.6. SWOT Analysis
12.12. Yingli
12.12.1. Business Overview
12.12.2. Company Snapshot
12.12.3. Company Market Share Analysis
12.12.4. Company Product Portfolio
12.12.5. Recent Developments
12.12.6. SWOT Analysis
12.13. ReneSola
12.13.1. Business Overview
12.13.2. Company Snapshot
12.13.3. Company Market Share Analysis
12.13.4. Company Product Portfolio
12.13.5. Recent Developments
12.13.6. SWOT Analysis
12.14. Canadian Solar Inc.
12.14.1. Business Overview
12.14.2. Company Snapshot
12.14.3. Company Market Share Analysis
12.14.4. Company Product Portfolio
12.14.5. Recent Developments
12.14.6. SWOT Analysis
12.15. Indosolar Limited
12.15.1. Business Overview
12.15.2. Company Snapshot
12.15.3. Company Market Share Analysis
12.15.4. Company Product Portfolio
12.15.5. Recent Developments
12.15.6. SWOT Analysis
List of Tables
1. Global Solar Cell Market, By Material, 2019-2032 (USD Billion)
2. Global Crystalline, Solar Cell Market, By Region, 2019-2032 (USD Billion)
3. Global Thin Film, Solar Cell Market, By Region, 2019-2032 (USD Billion)
4. Global Solar Cell Market, By Product, 2019-2032 (USD Billion)
5. Global BSF, Solar Cell Market, By Region, 2019-2032 (USD Billion)
6. Global PERC/PERL/PERT/TOPCON, Solar Cell Market, By Region, 2019-2032 (USD Billion)
7. Global HJT, Solar Cell Market, By Region, 2019-2032 (USD Billion)
8. Global IBC & MWT, Solar Cell Market, By Region, 2019-2032 (USD Billion)
9. Global Others, Solar Cell Market, By Region, 2019-2032 (USD Billion)
10. Global Solar Cell Market, By Technology, 2019-2032 (USD Billion)
11. Global Monocrystalline, Solar Cell Market, By Region, 2019-2032 (USD Billion)
12. Global Polycrystalline, Solar Cell Market, By Region, 2019-2032 (USD Billion)
13. Global Cadmium Telluride (CDTE), Solar Cell Market, By Region, 2019-2032 (USD Billion)
14. Global Amorphous Silicon (A-Si), Solar Cell Market, By Region, 2019-2032 (USD Billion)
15. Global Copper Indium Gallium Diselenide, Solar Cell Market, By Region, 2019-2032 (USD Billion)
16. Global Solar Cell Market, By End User, 2019-2032 (USD Billion)
17. Global Residential, Solar Cell Market, By Region, 2019-2032 (USD Billion)
18. Global Commercial, Solar Cell Market, By Region, 2019-2032 (USD Billion)
19. Global Utility, Solar Cell Market, By Region, 2019-2032 (USD Billion)
20. Global Solar Cell Market, By Region, 2019-2032 (USD Billion)
21. North America Solar Cell Market, By Material, 2019-2032 (USD Billion)
22. North America Solar Cell Market, By Product, 2019-2032 (USD Billion)
23. North America Solar Cell Market, By Technology, 2019-2032 (USD Billion)
24. North America Solar Cell Market, By End User, 2019-2032 (USD Billion)
25. U.S. Solar Cell Market, By Material, 2019-2032 (USD Billion)
26. U.S. Solar Cell Market, By Product, 2019-2032 (USD Billion)
27. U.S. Solar Cell Market, By Technology, 2019-2032 (USD Billion)
28. U.S. Solar Cell Market, By End User, 2019-2032 (USD Billion)
29. Canada Solar Cell Market, By Material, 2019-2032 (USD Billion)
30. Canada Solar Cell Market, By Product, 2019-2032 (USD Billion)
31. Canada Solar Cell Market, By Technology, 2019-2032 (USD Billion)
32. Canada Solar Cell Market, By End User, 2019-2032 (USD Billion)
33. Mexico Solar Cell Market, By Material, 2019-2032 (USD Billion)
34. Mexico Solar Cell Market, By Product, 2019-2032 (USD Billion)
35. Mexico Solar Cell Market, By Technology, 2019-2032 (USD Billion)
36. Mexico Solar Cell Market, By End User, 2019-2032 (USD Billion)
37. Europe Solar Cell Market, By Material, 2019-2032 (USD Billion)
38. Europe Solar Cell Market, By Product, 2019-2032 (USD Billion)
39. Europe Solar Cell Market, By Technology, 2019-2032 (USD Billion)
40. Europe Solar Cell Market, By End User, 2019-2032 (USD Billion)
41. Germany Solar Cell Market, By Material, 2019-2032 (USD Billion)
42. Germany Solar Cell Market, By Product, 2019-2032 (USD Billion)
43. Germany Solar Cell Market, By Technology, 2019-2032 (USD Billion)
44. Germany Solar Cell Market, By End User, 2019-2032 (USD Billion)
45. France Solar Cell Market, By Material, 2019-2032 (USD Billion)
46. France Solar Cell Market, By Product, 2019-2032 (USD Billion)
47. France Solar Cell Market, By Technology, 2019-2032 (USD Billion)
48. France Solar Cell Market, By End User, 2019-2032 (USD Billion)
49. U.K. Solar Cell Market, By Material, 2019-2032 (USD Billion)
50. U.K. Solar Cell Market, By Product, 2019-2032 (USD Billion)
51. U.K. Solar Cell Market, By Technology, 2019-2032 (USD Billion)
52. U.K. Solar Cell Market, By End User, 2019-2032 (USD Billion)
53. Italy Solar Cell Market, By Material, 2019-2032 (USD Billion)
54. Italy Solar Cell Market, By Product, 2019-2032 (USD Billion)
55. Italy Solar Cell Market, By Technology, 2019-2032 (USD Billion)
56. Italy Solar Cell Market, By End User, 2019-2032 (USD Billion)
57. Spain Solar Cell Market, By Material, 2019-2032 (USD Billion)
58. Spain Solar Cell Market, By Product, 2019-2032 (USD Billion)
59. Spain Solar Cell Market, By Technology, 2019-2032 (USD Billion)
60. Spain Solar Cell Market, By End User, 2019-2032 (USD Billion)
61. Asia Pacific Solar Cell Market, By Material, 2019-2032 (USD Billion)
62. Asia Pacific Solar Cell Market, By Product, 2019-2032 (USD Billion)
63. Asia Pacific Solar Cell Market, By Technology, 2019-2032 (USD Billion)
64. Asia Pacific Solar Cell Market, By End User, 2019-2032 (USD Billion)
65. Japan Solar Cell Market, By Material, 2019-2032 (USD Billion)
66. Japan Solar Cell Market, By Product, 2019-2032 (USD Billion)
67. Japan Solar Cell Market, By Technology, 2019-2032 (USD Billion)
68. Japan Solar Cell Market, By End User, 2019-2032 (USD Billion)
69. China Solar Cell Market, By Material, 2019-2032 (USD Billion)
70. China Solar Cell Market, By Product, 2019-2032 (USD Billion)
71. China Solar Cell Market, By Technology, 2019-2032 (USD Billion)
72. China Solar Cell Market, By End User, 2019-2032 (USD Billion)
73. India Solar Cell Market, By Material, 2019-2032 (USD Billion)
74. India Solar Cell Market, By Product, 2019-2032 (USD Billion)
75. India Solar Cell Market, By Technology, 2019-2032 (USD Billion)
76. India Solar Cell Market, By End User, 2019-2032 (USD Billion)
77. South America Solar Cell Market, By Material, 2019-2032 (USD Billion)
78. South America Solar Cell Market, By Product, 2019-2032 (USD Billion)
79. South America Solar Cell Market, By Technology, 2019-2032 (USD Billion)
80. South America Solar Cell Market, By End User, 2019-2032 (USD Billion)
81. Brazil Solar Cell Market, By Material, 2019-2032 (USD Billion)
82. Brazil Solar Cell Market, By Product, 2019-2032 (USD Billion)
83. Brazil Solar Cell Market, By Technology, 2019-2032 (USD Billion)
84. Brazil Solar Cell Market, By End User, 2019-2032 (USD Billion)
85. Middle East and Africa Solar Cell Market, By Material, 2019-2032 (USD Billion)
86. Middle East and Africa Solar Cell Market, By Product, 2019-2032 (USD Billion)
87. Middle East and Africa Solar Cell Market, By Technology, 2019-2032 (USD Billion)
88. Middle East and Africa Solar Cell Market, By End User, 2019-2032 (USD Billion)
89. UAE Solar Cell Market, By Material, 2019-2032 (USD Billion)
90. UAE Solar Cell Market, By Product, 2019-2032 (USD Billion)
91. UAE Solar Cell Market, By Technology, 2019-2032 (USD Billion)
92. UAE Solar Cell Market, By End User, 2019-2032 (USD Billion)
93. South Africa Solar Cell Market, By Material, 2019-2032 (USD Billion)
94. South Africa Solar Cell Market, By Product, 2019-2032 (USD Billion)
95. South Africa Solar Cell Market, By Technology, 2019-2032 (USD Billion)
96. South Africa Solar Cell Market, By End User, 2019-2032 (USD Billion)
List of Figures
1. Global Solar Cell Market Segmentation
2. Solar Cell Market: Research Methodology
3. Market Size Estimation Methodology: Bottom-Up Approach
4. Market Size Estimation Methodology: Top-Down Approach
5. Data Triangulation
6. Porter’s Five Forces Analysis
7. Value Chain Analysis
8. Global Solar Cell Market Attractiveness Analysis by Material
9. Global Solar Cell Market Attractiveness Analysis by Product
10. Global Solar Cell Market Attractiveness Analysis by Technology
11. Global Solar Cell Market Attractiveness Analysis by End User
12. Global Solar Cell Market Attractiveness Analysis by Region
13. Global Solar Cell Market: Dynamics
14. Global Solar Cell Market Share by Material (2022 & 2032)
15. Global Solar Cell Market Share by Product (2022 & 2032)
16. Global Solar Cell Market Share by Technology (2022 & 2032)
17. Global Solar Cell Market Share by End User (2022 & 2032)
18. Global Solar Cell Market Share by Regions (2022 & 2032)
19. Global Solar Cell Market Share by Company (2022)
This study forecasts revenue at global, regional, and country levels from 2019 to 2032. The Brainy Insights has segmented the global solar cell market based on below-mentioned segments:
Global Solar Cell Market by Material:
Global Solar Cell Market by Product:
Global Solar Cell Market by Technology:
Global Solar Cell Market by End User:
Global Solar Cell Market by Region:
Research has its special purpose to undertake marketing efficiently. In this competitive scenario, businesses need information across all industry verticals; the information about customer wants, market demand, competition, industry trends, distribution channels etc. This information needs to be updated regularly because businesses operate in a dynamic environment. Our organization, The Brainy Insights incorporates scientific and systematic research procedures in order to get proper market insights and industry analysis for overall business success. The analysis consists of studying the market from a miniscule level wherein we implement statistical tools which helps us in examining the data with accuracy and precision.
Our research reports feature both; quantitative and qualitative aspects for any market. Qualitative information for any market research process are fundamental because they reveal the customer needs and wants, usage and consumption for any product/service related to a specific industry. This in turn aids the marketers/investors in knowing certain perceptions of the customers. Qualitative research can enlighten about the different product concepts and designs along with unique service offering that in turn, helps define marketing problems and generate opportunities. On the other hand, quantitative research engages with the data collection process through interviews, e-mail interactions, surveys and pilot studies. Quantitative aspects for the market research are useful to validate the hypotheses generated during qualitative research method, explore empirical patterns in the data with the help of statistical tools, and finally make the market estimations.
The Brainy Insights offers comprehensive research and analysis, based on a wide assortment of factual insights gained through interviews with CXOs and global experts and secondary data from reliable sources. Our analysts and industry specialist assume vital roles in building up statistical tools and analysis models, which are used to analyse the data and arrive at accurate insights with exceedingly informative research discoveries. The data provided by our organization have proven precious to a diverse range of companies, facilitating them to address issues such as determining which products/services are the most appealing, whether or not customers use the product in the manner anticipated, the purchasing intentions of the market and many others.
Our research methodology encompasses an idyllic combination of primary and secondary initiatives. Key phases involved in this process are listed below:

The phase involves the gathering and collecting of market data and its related information with the help of different sources & research procedures.

The data procurement stage involves in data gathering and collecting through various data sources.
This stage involves in extensive research. These data sources includes:
Purchased Database: Purchased databases play a crucial role in estimating the market sizes irrespective of the domain. Our purchased database includes:
Primary Research: The Brainy Insights interacts with leading companies and experts of the concerned domain to develop the analyst team’s market understanding and expertise. It improves and substantiates every single data presented in the market reports. Primary research mainly involves in telephonic interviews, E-mail interactions and face-to-face interviews with the raw material providers, manufacturers/producers, distributors, & independent consultants. The interviews that we conduct provides valuable data on market size and industry growth trends prevailing in the market. Our organization also conducts surveys with the various industry experts in order to gain overall insights of the industry/market. For instance, in healthcare industry we conduct surveys with the pharmacists, doctors, surgeons and nurses in order to gain insights and key information of a medical product/device/equipment which the customers are going to usage. Surveys are conducted in the form of questionnaire designed by our own analyst team. Surveys plays an important role in primary research because surveys helps us to identify the key target audiences of the market. Additionally, surveys helps to identify the key target audience engaged with the market. Our survey team conducts the survey by targeting the key audience, thus gaining insights from them. Based on the perspectives of the customers, this information is utilized to formulate market strategies. Moreover, market surveys helps us to understand the current competitive situation of the industry. To be precise, our survey process typically involve with the 360 analysis of the market. This analytical process begins by identifying the prospective customers for a product or service related to the market/industry to obtain data on how a product/service could fit into customers’ lives.

Secondary Research: The secondary data sources includes information published by the on-profit organizations such as World bank, WHO, company fillings, investor presentations, annual reports, national government documents, statistical databases, blogs, articles, white papers and others. From the annual report, we analyse a company’s revenue to understand the key segment and market share of that organization in a particular region. We analyse the company websites and adopt the product mapping technique which is important for deriving the segment revenue. In the product mapping method, we select and categorize the products offered by the companies catering to domain specific market, deduce the product revenue for each of the companies so as to get overall estimation of the market size. We also source data and analyses trends based on information received from supply side and demand side intermediaries in the value chain. The supply side denotes the data gathered from supplier, distributor, wholesaler and the demand side illustrates the data gathered from the end customers for respective market domain.

The supply side for a domain specific market is analysed by:
The demand side for the market is estimated through:
In-house Library: Apart from these third-party sources, we have our in-house library of qualitative and quantitative information. Our in-house database includes market data for various industry and domains. These data are updated on regular basis as per the changing market scenario. Our library includes, historic databases, internal audit reports and archives.
Sometimes there are instances where there is no metadata or raw data available for any domain specific market. For those cases, we use our expertise to forecast and estimate the market size in order to generate comprehensive data sets. Our analyst team adopt a robust research technique in order to produce the estimates:
Data Synthesis: This stage involves the analysis & mapping of all the information obtained from the previous step. It also involves in scrutinizing the data for any discrepancy observed while data gathering related to the market. The data is collected with consideration to the heterogeneity of sources. Robust scientific techniques are in place for synthesizing disparate data sets and provide the essential contextual information that can orient market strategies. The Brainy Insights has extensive experience in data synthesis where the data passes through various stages:


Market Deduction & Formulation: The final stage comprises of assigning data points at appropriate market spaces so as to deduce feasible conclusions. Analyst perspective & subject matter expert based holistic form of market sizing coupled with industry analysis also plays a crucial role in this stage.
This stage involves in finalization of the market size and numbers that we have collected from data integration step. With data interpolation, it is made sure that there is no gap in the market data. Successful trend analysis is done by our analysts using extrapolation techniques, which provide the best possible forecasts for the market.
Data Validation & Market Feedback: Validation is the most important step in the process. Validation & re-validation via an intricately designed process helps us finalize data-points to be used for final calculations.

The Brainy Insights interacts with leading companies and experts of the concerned domain to develop the analyst team’s market understanding and expertise. It improves and substantiates every single data presented in the market reports. The data validation interview and discussion panels are typically composed of the most experienced industry members. The participants include, however, are not limited to:
Moreover, we always validate our data and findings through primary respondents from all the major regions we are working on.


Free Customization
Fortune 500 Clients
Free Yearly Update On Purchase Of Multi/Corporate License
Companies Served Till Date