- +1-315-215-1633
- sales@thebrainyinsights.com

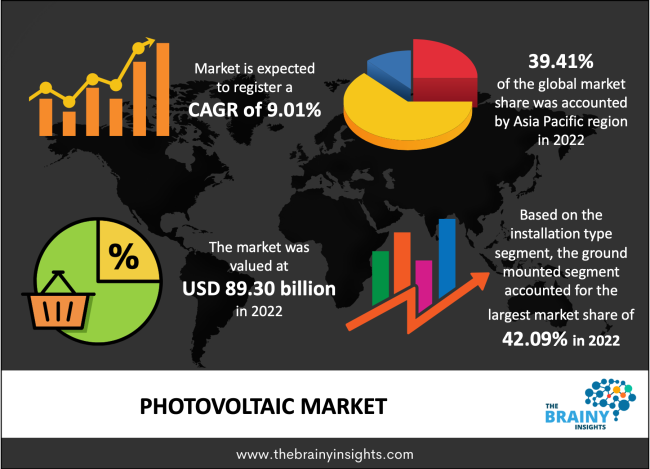
The global photovoltaic market was valued at USD 89.30 billion in 2022, increasing at a CAGR of 9.01% from 2022 to 2030 and anticipated to reach USD 178.07 billion by 2030. North America is expected to grow the fastest during the forecast period. Moreover, the rising population, thriving industries in emerging economies and an increase in infrastructure development activities are propelling the market growth during the forecast period.
Photovoltaic means electricity from the sun's energy & is derived from the words "photo", with the Greek meaning light & "voltaic", meaning voltage. The term "photovoltaic" represents a process known as the "photovoltaic effect" by which a material like silicon converts sunlight into electricity. Photovoltaics are best known for generating electric power by utilizing solar cells to convert energy from the sun into a flow of electrons through the photovoltaic effect. A solar panel includes multiple photovoltaic cells, and the amount will depend on the solar panel's output voltage and current need. Solar panels range in size from around 5 to over 400 watts of peak output and produce DC (direct current). A photovoltaic system uses solar modules, including several solar cells, which generate electrical power. Photovoltaic installations may be rooftop-mounted, ground-mounted, wall-mounted or floating. Using photovoltaic as a primary source requires energy storage systems or worldwide distribution by high-voltage direct current power lines causing additional expenses. Also, it has several other specific disadvantages, like variable power generation, which have to be balanced. Some toxic chemicals, like arsenic and cadmium, are used in photovoltaic production. These minor environmental effects can be easily controlled via recycling and proper disposal. Solar energy is somewhat more expensive to produce than conventional energy sources due in part to the price of manufacturing photovoltaic instruments and in part to the conversion efficiencies of the equipment.
Get an overview of this study by requesting a free sample
For example, in April 2020 - LONGi announced the signing of a distributor appointment for & new sales contract with Swedish distributor Senergia for supplying 9.2 MW of its high-efficiency Hi-MO4 modules. The agreement contains around 25,000 PV modules of different power: 1,320 pieces of 440 W and 23,400 pieces of 370 W. Also, the Hi-MO4 series utilizes the new M6 wafer size (166mm) & is fast evolving as the module of choice in photovoltaic as it offers a high-power conversion efficiency rate.
The increasing investments in solar power: The rapid acceptance of high-capacity solar projects and the government's focus on developing energy-efficient systems is the driving factor of the market growth during the forecast period. Further, the stringent targets for clean power use are also helping to boost the market growth during the forecast period. Moreover, the increasing concerns for carbon emissions & the gradual shift towards dependence on renewable sources for energy usage are other driving factors of the market growth. Apart from this, the declining cost of energy storage devices and PV systems, ongoing reduction in the price of elements followed by technological advancements, and stimulating regulatory measures, including tax credits, are also propelling the market growth.
A lack of operational land, supply chain and manufacturing issues: The raw material shortage and closure of industries are restraining the market growth. Moreover, a large chunk of the population still needs to be made aware of the cost and the absence of regulatory frameworks hamper the market growth.
The increasing adoption of photovoltaic systems in residential applications: The rising adoption of photovoltaic systems in residential applications, coupled with supportive government initiatives, is the opportunity factor for market growth. Furthermore, the government is introducing multiple schemes and incentives, including auctions, tariffs, and tax exemptions associated with technological advancements, propelling market growth. Additionally, the increasing demand for electricity, rapid rate of industrialization & urbanization, and the rising investments by key industry players to introduce improved solar energy generation technologies are stimulating market growth during the forecast period. Moreover, the availability of net metering systems for grid-connected methods, as well as options to incorporate battery storage methods for off-grid-connected methods, are also helping to boost the market growth during the upcoming year.
The regions analyzed for the market include Europe, South America, Asia Pacific, North America, the Middle East, and Africa. The Asia Pacific emerged as the largest global photovoltaic market, with a 39.41% share of the market revenue in 2022. The Asia Pacific dominates the photovoltaic market due to the presence of key players and the growing number of solar installations in developing nations. Further, the development of high-capacity and efficient power generation systems, increasing demand for design and simulation photovoltaic software, and the growing demand for spontaneous project proposals are also helping to boost the market growth in this region. North America is expected to grow the fastest during the forecast period due to the increasing industry potential. Further, the growing numbers of new ground-mounted solar and government initiatives, increasing urbanization and increase in solar installation, and the favourable government regulations regarding the conservation of energy are also helping to boost the market growth during the forecast period in this region. Also, the raised awareness among the people in the countries such as Canada and the US for renewable and environment-friendly energy sources is helping to stimulate the market growth in this region during the forecast period.
Asia-Pacific Region Photovoltaic Market Share in 2022 - 39.41%
www.thebrainyinsights.com
Check the geographical analysis of this market by requesting a free sample
The type segment is divided into the balance of system (BOS), modules, and inverters. In 2022, the inverters segment dominated the market with the largest market share of 41.15% and market revenue of 36.74 billion. This growth is attributed to the increasing adoption of PV inverters in utilities and residential applications. Furthermore, the inverters are incorporated with large arrays installed on field installations, industrial facilities, and buildings, taking direct current power from all the PV panels & converting it into AC power, evolving a single point for power distribution.
The installation type segment is divided into the rooftop, ground mounted, and others. In 2022, the ground-mounted segment dominated the market with the largest market share of 42.09% and market revenue of 37.58 billion. This growth is attributed to the increasing number of solar energy targets, utility-scale projects, and declining costs of solar PV installations. Further, by 2030, the rooftop segment will likely dominate the market due to the increasing trend of generating power through renewable energy.
The system segment is divided into high concentration photovoltaic (HCPV) and low concentration photovoltaic (LCPV). In 2022, the low concentration photovoltaic (LCPV) segment dominated the market with the largest market share of 56.11% and market revenue of 50.10 billion. This growth is attributed to the increasing demand for grid-connected electricity. Additionally, the increased disposable income and government awareness programs about renewable energy sources are also helping to boost the segment's market growth.
The technology segment is divided into a thin film, polycrystalline silicon, monocrystalline silicon, and others. In 2022, the thin film segment dominated the market with the largest market share of 40.21% and market revenue of 35.90 billion. This growth is attributed to the increased solar PV capacity. Further, by 2030, the monocrystalline silicon segment will likely dominate the market due to the increase in the electrical & electronics industry and rising urbanization.
The application segment is divided into utility, residential, and commercial. In 2022, the residential segment dominated the market, accounting for around 43.05% of global revenue. This growth is attributed to the availability of various incentives for residential end users to install solar PV systems. Further, the governments in multiple countries have taken active steps with policies & financial incentives to boost captive power generation via renewable sources like power in residential buildings.
| Attribute | Description |
|---|---|
| Market Size | Revenue (USD Billion) |
| Market size value in 2022 | USD 89.30 Billion, Volume in Gigawatt |
| Market size value in 2030 | USD 178.07 Billion, Volume in Gigawatt |
| CAGR (2022 to 2030) | 9.01% |
| Historical data | 2019-2020 |
| Base Year | 2021 |
| Forecast | 2022-2030 |
| Segments | Key Segments are type, installation type, system, technology, application, and regions |
| Regional Segments | The key regions are North America, South America, Europe, Asia Pacific, and Middle East & Africa. |
As per The Brainy Insights, the size of the photovoltaic market was valued at USD 89.30 billion in 2022 to USD 178.07 billion by 2030.
Global photovoltaic market is growing at a CAGR of 9.01% during the forecast period 2022-2030.
Asia Pacific region emerged as the largest market for the photovoltaic.
The market's growth will be influenced by the increasing investments in solar power.
A lack of operational land, supply chain and manufacturing issues could hamper the market growth.
The increasing adoption of photovoltaic systems in residential applications will provide huge opportunities to the market.
1. Introduction
1.1. Objectives of the Study
1.2. Market Definition
1.3. Research Scope
1.4. Currency
1.5. Key Target Audience
2. Research Methodology and Assumptions
3. Executive Summary
4. Premium Insights
4.1. Porter’s Five Forces Analysis
4.2. Value Chain Analysis
4.3. Top Investment Pockets
4.3.1. Market Attractiveness Analysis By Type
4.3.2. Market Attractiveness Analysis By Installation Type
4.3.3. Market Attractiveness Analysis By System
4.3.4. Market Attractiveness Analysis By Technology
4.3.5. Market Attractiveness Analysis By Application
4.3.6. Market Attractiveness Analysis By Region
4.4. Industry Trends
5. Market Dynamics
5.1. Market Evaluation
5.2. Drivers
5.2.1. The increased demand for more power generation capacity
5.2.2. The establishment of capacity quota targets
5.2.3. The rising demand for effective fossil fuels
5.2.4. The increasing demand for PV systems for various commercial and residential applications
5.2.5. The rising projects related to renewable energy sources
5.3. Restraints
5.3.1. A lack of operational land, supply chain and manufacturing issues
5.3.2. The high installation costs
5.4. Opportunities
5.4.1. The increased focus on research & development activities to improve the efficiency of solar cell and production technology
5.4.2. The rapid technological advancements
1. Global Photovoltaic Market Analysis and Forecast, By Type
1.1. Segment Overview
1.2. Balance of System (BOS)
1.3. Modules
1.4. Inverters
2. Global Photovoltaic Market Analysis and Forecast, By Installation Type
2.1. Segment Overview
2.2. Rooftop
2.3. Ground Mounted
2.4. Others
3. Global Photovoltaic Market Analysis and Forecast, By System
3.1. Segment Overview
3.2. High Concentration Photovoltaic (HCPV)
3.3. Low Concentration Photovoltaic (LCPV)
4. Global Photovoltaic Market Analysis and Forecast, By Technology
4.1. Segment Overview
4.2. Thin Film
4.3. Polycrystalline Silicon
4.4. Monocrystalline Silicon
4.5. Others
5. Global Photovoltaic Market Analysis and Forecast, By Application
5.5. Segment Overview
5.6. Utility
5.7. Residential
5.8. Commercial
6. Global Photovoltaic Market Analysis and Forecast, By Regional Analysis
6.1. Segment Overview
6.2. North America
6.2.1. U.S.
6.2.2. Canada
6.2.3. Mexico
6.3. Europe
6.3.1. Germany
6.3.2. France
6.3.3. U.K.
6.3.4. Italy
6.3.5. Spain
6.4. Asia-Pacific
6.4.1. Japan
6.4.2. China
6.4.3. India
6.5. South America
6.5.1. Brazil
6.6. Middle East and Africa
6.6.1. UAE
6.6.2. South Africa
7. Global Photovoltaic Market-Competitive Landscape
7.1. Overview
7.2. Market Share of Key Players in Global Photovoltaic Market
7.2.1. Global Company Market Share
7.2.2. North America Company Market Share
7.2.3. Europe Company Market Share
7.2.4. APAC Company Market Share
7.3. Competitive Situations and Trends
7.3.1. Product Launches and Developments
7.3.2. Partnerships, Collaborations, and Agreements
7.3.3. Mergers & Acquisitions
7.3.4. Expansions
8. Company Profiles
8.1. Canadian Solar Inc.
8.1.1. Business Overview
8.1.2. Company Snapshot
8.1.3. Company Market Share Analysis
8.1.4. Company Product Portfolio
8.1.5. Recent Developments
8.1.6. SWOT Analysis
8.2. Nextera Energy Sources LLC
8.2.1. Business Overview
8.2.2. Company Snapshot
8.2.3. Company Market Share Analysis
8.2.4. Company Product Portfolio
8.2.5. Recent Developments
8.2.6. SWOT Analysis
8.3. Tata Power Solar Systems Ltd.
8.3.1. Business Overview
8.3.2. Company Snapshot
8.3.3. Company Market Share Analysis
8.3.4. Company Product Portfolio
8.3.5. Recent Developments
8.3.6. SWOT Analysis
8.4. Wuxi Suntech Power Co. Ltd
8.4.1. Business Overview
8.4.2. Company Snapshot
8.4.3. Company Market Share Analysis
8.4.4. Company Product Portfolio
8.4.5. Recent Developments
8.4.6. SWOT Analysis
8.5. Vivaan Solar
8.5.1. Business Overview
8.5.2. Company Snapshot
8.5.3. Company Market Share Analysis
8.5.4. Company Product Portfolio
8.5.5. Recent Developments
8.5.6. SWOT Analysis
8.6. Trina Solar
8.6.1. Business Overview
8.6.2. Company Snapshot
8.6.3. Company Market Share Analysis
8.6.4. Company Product Portfolio
8.6.5. Recent Developments
8.6.6. SWOT Analysis
8.7. SunPower Corporation
8.7.1. Business Overview
8.7.2. Company Snapshot
8.7.3. Company Market Share Analysis
8.7.4. Company Product Portfolio
8.7.5. Recent Developments
8.7.6. SWOT Analysis
8.8. Jinko Solar
8.8.1. Business Overview
8.8.2. Company Snapshot
8.8.3. Company Market Share Analysis
8.8.4. Company Product Portfolio
8.8.5. Recent Developments
8.8.6. SWOT Analysis
8.9. BrightSource Energy Inc.
8.9.1. Business Overview
8.9.2. Company Snapshot
8.9.3. Company Market Share Analysis
8.9.4. Company Product Portfolio
8.9.5. Recent Developments
8.9.6. SWOT Analysis
8.10. Waaree Group
8.10.1. Business Overview
8.10.2. Company Snapshot
8.10.3. Company Market Share Analysis
8.10.4. Company Product Portfolio
8.10.5. Recent Developments
8.10.6. SWOT Analysis
List of Table
1. Global Photovoltaic Market, By Type, 2019-2030 (USD Billion) (Gigawatt)
2. Global Balance of System (BOS), Photovoltaic Market, By Region, 2019-2030 (USD Billion) (Gigawatt)
3. Global Modules, Photovoltaic Market, By Region, 2019-2030 (USD Billion) (Gigawatt)
4. Global Inverters, Photovoltaic Market, By Region, 2019-2030 (USD Billion) (Gigawatt)
5. Global Photovoltaic Market, By Installation Type, 2019-2030 (USD Billion) (Gigawatt)
6. Global Rooftop, Photovoltaic Market, By Region, 2019-2030 (USD Billion) (Gigawatt)
7. Global Ground Mounted, Photovoltaic Market, By Region, 2019-2030 (USD Billion) (Gigawatt)
8. Global Others, Photovoltaic Market, By Region, 2019-2030 (USD Billion) (Gigawatt)
9. Global Photovoltaic Market, By System, 2019-2030 (USD Billion) (Gigawatt)
10. Global High Concentration Photovoltaic (HCPV), Photovoltaic Market, By Region, 2019-2030 (USD Billion) (Gigawatt)
11. Global Low Concentration Photovoltaic (LCPV), Photovoltaic Market, By Region, 2019-2030 (USD Billion) (Gigawatt)
12. Global Photovoltaic Market, By Technology, 2019-2030 (USD Billion) (Gigawatt)
13. Global Thin Film, Polycrystalline Silicon, Monocrystalline Silicon, and Others, Photovoltaic Market, By Region, 2019-2030 (USD Billion) (Gigawatt)
14. Global Polycrystalline Silicon, Photovoltaic Market, By Region, 2019-2030 (USD Billion) (Gigawatt)
15. Global Monocrystalline Silicon, Photovoltaic Market, By Region, 2019-2030 (USD Billion) (Gigawatt)
16. Global Others, Photovoltaic Market, By Region, 2019-2030 (USD Billion) (Gigawatt)
17. Global Photovoltaic Market, By Application, 2019-2030 (USD Billion) (Gigawatt)
18. Global Utility, Photovoltaic Market, By Region, 2019-2030 (USD Billion) (Gigawatt)
19. Global Residential, Photovoltaic Market, By Region, 2019-2030 (USD Billion) (Gigawatt)
20. Global Commercial, Photovoltaic Market, By Region, 2019-2030 (USD Billion) (Gigawatt)
21. North America Photovoltaic Market, By Type, 2019-2030 (USD Billion) (Gigawatt)
22. North America Photovoltaic Market, By Installation Type, 2019-2030 (USD Billion) (Gigawatt)
23. North America Photovoltaic Market, By System, 2019-2030 (USD Billion) (Gigawatt)
24. North America Photovoltaic Market, By Technology, 2019-2030 (USD Billion) (Gigawatt)
25. North America Photovoltaic Market, By Application, 2019-2030 (USD Billion) (Gigawatt)
26. U.S. Photovoltaic Market, By Type, 2019-2030 (USD Billion) (Gigawatt)
27. U.S. Photovoltaic Market, By Installation Type, 2019-2030 (USD Billion) (Gigawatt)
28. U.S. Photovoltaic Market, By System, 2019-2030 (USD Billion) (Gigawatt)
29. U.S. Photovoltaic Market, By Technology, 2019-2030 (USD Billion) (Gigawatt)
30. U.S. Photovoltaic Market, By Application, 2019-2030 (USD Billion) (Gigawatt)
31. Canada Photovoltaic Market, By Type, 2019-2030 (USD Billion) (Gigawatt)
32. Canada Photovoltaic Market, By Installation Type, 2019-2030 (USD Billion) (Gigawatt)
33. Canada Photovoltaic Market, By System, 2019-2030 (USD Billion) (Gigawatt)
34. Canada Photovoltaic Market, By Technology, 2019-2030 (USD Billion) (Gigawatt)
35. Canada Photovoltaic Market, By Application, 2019-2030 (USD Billion) (Gigawatt)
36. Mexico Photovoltaic Market, By Type, 2019-2030 (USD Billion) (Gigawatt)
37. Mexico Photovoltaic Market, By Installation Type, 2019-2030 (USD Billion) (Gigawatt)
38. Mexico Photovoltaic Market, By System, 2019-2030 (USD Billion) (Gigawatt)
39. Mexico Photovoltaic Market, By Technology, 2019-2030 (USD Billion) (Gigawatt)
40. Mexico Photovoltaic Market, By Application, 2019-2030 (USD Billion) (Gigawatt)
41. Europe Photovoltaic Market, By Type, 2019-2030 (USD Billion) (Gigawatt)
42. Europe Photovoltaic Market, By Installation Type, 2019-2030 (USD Billion) (Gigawatt)
43. Europe Photovoltaic Market, By System, 2019-2030 (USD Billion) (Gigawatt)
44. Europe Photovoltaic Market, By Technology, 2019-2030 (USD Billion) (Gigawatt)
45. Europe Photovoltaic Market, By Application, 2019-2030 (USD Billion) (Gigawatt)
46. Germany Photovoltaic Market, By Type, 2019-2030 (USD Billion) (Gigawatt)
47. Germany Photovoltaic Market, By Installation Type, 2019-2030 (USD Billion) (Gigawatt)
48. Germany Photovoltaic Market, By System, 2019-2030 (USD Billion) (Gigawatt)
49. Germany Photovoltaic Market, By Technology, 2019-2030 (USD Billion) (Gigawatt)
50. Germany Photovoltaic Market, By Application, 2019-2030 (USD Billion) (Gigawatt)
51. France Photovoltaic Market, By Type, 2019-2030 (USD Billion) (Gigawatt)
52. France Photovoltaic Market, By Installation Type, 2019-2030 (USD Billion) (Gigawatt)
53. France Photovoltaic Market, By System, 2019-2030 (USD Billion) (Gigawatt)
54. France Photovoltaic Market, By Technology, 2019-2030 (USD Billion) (Gigawatt)
55. France Photovoltaic Market, By Application, 2019-2030 (USD Billion) (Gigawatt)
56. U.K. Photovoltaic Market, By Type, 2019-2030 (USD Billion) (Gigawatt)
57. U.K. Photovoltaic Market, By Installation Type, 2019-2030 (USD Billion) (Gigawatt)
58. U.K. Photovoltaic Market, By System, 2019-2030 (USD Billion) (Gigawatt)
59. U.K. Photovoltaic Market, By Technology, 2019-2030 (USD Billion) (Gigawatt)
60. U.K. Photovoltaic Market, By Application, 2019-2030 (USD Billion) (Gigawatt)
61. Italy Photovoltaic Market, By Type, 2019-2030 (USD Billion) (Gigawatt)
62. Italy Photovoltaic Market, By Installation Type, 2019-2030 (USD Billion) (Gigawatt)
63. Italy Photovoltaic Market, By System, 2019-2030 (USD Billion) (Gigawatt)
64. Italy Photovoltaic Market, By Technology, 2019-2030 (USD Billion) (Gigawatt)
65. Italy Photovoltaic Market, By Application, 2019-2030 (USD Billion) (Gigawatt)
66. Spain Photovoltaic Market, By Type, 2019-2030 (USD Billion) (Gigawatt)
67. Spain Photovoltaic Market, By Installation Type, 2019-2030 (USD Billion) (Gigawatt)
68. Spain Photovoltaic Market, By System, 2019-2030 (USD Billion) (Gigawatt)
69. Spain Photovoltaic Market, By Technology, 2019-2030 (USD Billion) (Gigawatt)
70. Spain Photovoltaic Market, By Application, 2019-2030 (USD Billion) (Gigawatt)
71. Asia Pacific Photovoltaic Market, By Type, 2019-2030 (USD Billion) (Gigawatt)
72. Asia Pacific Photovoltaic Market, By Installation Type, 2019-2030 (USD Billion) (Gigawatt)
73. Asia Pacific Photovoltaic Market, By System, 2019-2030 (USD Billion) (Gigawatt)
74. Asia Pacific Photovoltaic Market, By Technology, 2019-2030 (USD Billion) (Gigawatt)
75. Asia Pacific Photovoltaic Market, By Application, 2019-2030 (USD Billion) (Gigawatt)
76. Japan Photovoltaic Market, By Type, 2019-2030 (USD Billion) (Gigawatt)
77. Japan Photovoltaic Market, By Installation Type, 2019-2030 (USD Billion) (Gigawatt)
78. Japan Photovoltaic Market, By System, 2019-2030 (USD Billion) (Gigawatt)
79. Japan Photovoltaic Market, By Technology, 2019-2030 (USD Billion) (Gigawatt)
80. Japan Photovoltaic Market, By Application, 2019-2030 (USD Billion) (Gigawatt)
81. China Photovoltaic Market, By Type, 2019-2030 (USD Billion) (Gigawatt)
82. China Photovoltaic Market, By Installation Type, 2019-2030 (USD Billion) (Gigawatt)
83. China Photovoltaic Market, By System, 2019-2030 (USD Billion) (Gigawatt)
84. China Photovoltaic Market, By Technology, 2019-2030 (USD Billion) (Gigawatt)
85. China Photovoltaic Market, By Application, 2019-2030 (USD Billion) (Gigawatt)
86. India Photovoltaic Market, By Type, 2019-2030 (USD Billion) (Gigawatt)
87. India Photovoltaic Market, By Installation Type, 2019-2030 (USD Billion) (Gigawatt)
88. India Photovoltaic Market, By System, 2019-2030 (USD Billion) (Gigawatt)
89. India Photovoltaic Market, By Technology, 2019-2030 (USD Billion) (Gigawatt)
90. India Photovoltaic Market, By Application, 2019-2030 (USD Billion) (Gigawatt)
91. South America Photovoltaic Market, By Type, 2019-2030 (USD Billion) (Gigawatt)
92. South America Photovoltaic Market, By Installation Type, 2019-2030 (USD Billion) (Gigawatt)
93. South America Photovoltaic Market, By System, 2019-2030 (USD Billion) (Gigawatt)
94. South America Photovoltaic Market, By Technology, 2019-2030 (USD Billion) (Gigawatt)
95. South America Photovoltaic Market, By Application, 2019-2030 (USD Billion) (Gigawatt)
96. Brazil Photovoltaic Market, By Type, 2019-2030 (USD Billion) (Gigawatt)
97. Brazil Photovoltaic Market, By Installation Type, 2019-2030 (USD Billion) (Gigawatt)
98. Brazil Photovoltaic Market, By System, 2019-2030 (USD Billion) (Gigawatt)
99. Brazil Photovoltaic Market, By Technology, 2019-2030 (USD Billion) (Gigawatt)
100. Brazil Photovoltaic Market, By Application, 2019-2030 (USD Billion) (Gigawatt)
101. Middle East and Africa Photovoltaic Market, By Type, 2019-2030 (USD Billion) (Gigawatt)
102. Middle East and Africa Photovoltaic Market, By Installation Type, 2019-2030 (USD Billion) (Gigawatt)
103. Middle East and Africa Photovoltaic Market, By System, 2019-2030 (USD Billion) (Gigawatt)
104. Middle East and Africa Photovoltaic Market, By Technology, 2019-2030 (USD Billion) (Gigawatt)
105. Middle East and Africa Photovoltaic Market, By Application, 2019-2030 (USD Billion) (Gigawatt)
106. UAE Photovoltaic Market, By Type, 2019-2030 (USD Billion) (Gigawatt)
107. UAE Photovoltaic Market, By Installation Type, 2019-2030 (USD Billion) (Gigawatt)
108. UAE Photovoltaic Market, By System, 2019-2030 (USD Billion) (Gigawatt)
109. UAE Photovoltaic Market, By Technology, 2019-2030 (USD Billion) (Gigawatt)
110. UAE Photovoltaic Market, By Application, 2019-2030 (USD Billion) (Gigawatt)
111. South Africa Photovoltaic Market, By Type, 2019-2030 (USD Billion) (Gigawatt)
112. South Africa Photovoltaic Market, By Installation Type, 2019-2030 (USD Billion) (Gigawatt)
113. South Africa Photovoltaic Market, By System, 2019-2030 (USD Billion) (Gigawatt)
114. South Africa Photovoltaic Market, By Technology, 2019-2030 (USD Billion) (Gigawatt)
115. South Africa Photovoltaic Market, By Application, 2019-2030 (USD Billion) (Gigawatt)
List of Figures
1. Global Photovoltaic Market Segmentation
2. Global Photovoltaic Market: Research Methodology
3. Market Size Estimation Methodology: Bottom-Up Approach
4. Market Size Estimation Methodology: Top-Down Approach
5. Data Triangulation
6. Porter’s Five Forces Analysis
7. Value Chain Analysis
8. Global Photovoltaic Market Attractiveness Analysis By Type
9. Global Photovoltaic Market Attractiveness Analysis By Installation Type
10. Global Photovoltaic Market Attractiveness Analysis By System
11. Global Photovoltaic Market Attractiveness Analysis By Technology
12. Global Photovoltaic Market Attractiveness Analysis By Application
13. Global Photovoltaic Market Attractiveness Analysis By Region
14. Global Photovoltaic Market: Dynamics
15. Global Photovoltaic Market Share By Type (2022 & 2030)
16. Global Photovoltaic Market Share By Installation Type (2022 & 2030)
17. Global Photovoltaic Market Share By System (2022 & 2030)
18. Global Photovoltaic Market Share By Technology (2022 & 2030)
19. Global Photovoltaic Market Share By Application (2022 & 2030)
20. Global Photovoltaic Market Share By Regions (2022 & 2030)
21. Global Photovoltaic Market Share By Company (2021)
This study forecasts revenue at global, regional, and country levels from 2019 to 2030. The Brainy Insights has segmented the global photovoltaic based on below mentioned segments:
Global Photovoltaic Market by Type:
Global Photovoltaic Market by Installation Type:
Global Photovoltaic Market by System:
Global Photovoltaic Market by Technology:
Global Photovoltaic Market by Application:
Global Photovoltaic by Region:
Research has its special purpose to undertake marketing efficiently. In this competitive scenario, businesses need information across all industry verticals; the information about customer wants, market demand, competition, industry trends, distribution channels etc. This information needs to be updated regularly because businesses operate in a dynamic environment. Our organization, The Brainy Insights incorporates scientific and systematic research procedures in order to get proper market insights and industry analysis for overall business success. The analysis consists of studying the market from a miniscule level wherein we implement statistical tools which helps us in examining the data with accuracy and precision.
Our research reports feature both; quantitative and qualitative aspects for any market. Qualitative information for any market research process are fundamental because they reveal the customer needs and wants, usage and consumption for any product/service related to a specific industry. This in turn aids the marketers/investors in knowing certain perceptions of the customers. Qualitative research can enlighten about the different product concepts and designs along with unique service offering that in turn, helps define marketing problems and generate opportunities. On the other hand, quantitative research engages with the data collection process through interviews, e-mail interactions, surveys and pilot studies. Quantitative aspects for the market research are useful to validate the hypotheses generated during qualitative research method, explore empirical patterns in the data with the help of statistical tools, and finally make the market estimations.
The Brainy Insights offers comprehensive research and analysis, based on a wide assortment of factual insights gained through interviews with CXOs and global experts and secondary data from reliable sources. Our analysts and industry specialist assume vital roles in building up statistical tools and analysis models, which are used to analyse the data and arrive at accurate insights with exceedingly informative research discoveries. The data provided by our organization have proven precious to a diverse range of companies, facilitating them to address issues such as determining which products/services are the most appealing, whether or not customers use the product in the manner anticipated, the purchasing intentions of the market and many others.
Our research methodology encompasses an idyllic combination of primary and secondary initiatives. Key phases involved in this process are listed below:

The phase involves the gathering and collecting of market data and its related information with the help of different sources & research procedures.

The data procurement stage involves in data gathering and collecting through various data sources.
This stage involves in extensive research. These data sources includes:
Purchased Database: Purchased databases play a crucial role in estimating the market sizes irrespective of the domain. Our purchased database includes:
Primary Research: The Brainy Insights interacts with leading companies and experts of the concerned domain to develop the analyst team’s market understanding and expertise. It improves and substantiates every single data presented in the market reports. Primary research mainly involves in telephonic interviews, E-mail interactions and face-to-face interviews with the raw material providers, manufacturers/producers, distributors, & independent consultants. The interviews that we conduct provides valuable data on market size and industry growth trends prevailing in the market. Our organization also conducts surveys with the various industry experts in order to gain overall insights of the industry/market. For instance, in healthcare industry we conduct surveys with the pharmacists, doctors, surgeons and nurses in order to gain insights and key information of a medical product/device/equipment which the customers are going to usage. Surveys are conducted in the form of questionnaire designed by our own analyst team. Surveys plays an important role in primary research because surveys helps us to identify the key target audiences of the market. Additionally, surveys helps to identify the key target audience engaged with the market. Our survey team conducts the survey by targeting the key audience, thus gaining insights from them. Based on the perspectives of the customers, this information is utilized to formulate market strategies. Moreover, market surveys helps us to understand the current competitive situation of the industry. To be precise, our survey process typically involve with the 360 analysis of the market. This analytical process begins by identifying the prospective customers for a product or service related to the market/industry to obtain data on how a product/service could fit into customers’ lives.

Secondary Research: The secondary data sources includes information published by the on-profit organizations such as World bank, WHO, company fillings, investor presentations, annual reports, national government documents, statistical databases, blogs, articles, white papers and others. From the annual report, we analyse a company’s revenue to understand the key segment and market share of that organization in a particular region. We analyse the company websites and adopt the product mapping technique which is important for deriving the segment revenue. In the product mapping method, we select and categorize the products offered by the companies catering to domain specific market, deduce the product revenue for each of the companies so as to get overall estimation of the market size. We also source data and analyses trends based on information received from supply side and demand side intermediaries in the value chain. The supply side denotes the data gathered from supplier, distributor, wholesaler and the demand side illustrates the data gathered from the end customers for respective market domain.

The supply side for a domain specific market is analysed by:
The demand side for the market is estimated through:
In-house Library: Apart from these third-party sources, we have our in-house library of qualitative and quantitative information. Our in-house database includes market data for various industry and domains. These data are updated on regular basis as per the changing market scenario. Our library includes, historic databases, internal audit reports and archives.
Sometimes there are instances where there is no metadata or raw data available for any domain specific market. For those cases, we use our expertise to forecast and estimate the market size in order to generate comprehensive data sets. Our analyst team adopt a robust research technique in order to produce the estimates:
Data Synthesis: This stage involves the analysis & mapping of all the information obtained from the previous step. It also involves in scrutinizing the data for any discrepancy observed while data gathering related to the market. The data is collected with consideration to the heterogeneity of sources. Robust scientific techniques are in place for synthesizing disparate data sets and provide the essential contextual information that can orient market strategies. The Brainy Insights has extensive experience in data synthesis where the data passes through various stages:


Market Deduction & Formulation: The final stage comprises of assigning data points at appropriate market spaces so as to deduce feasible conclusions. Analyst perspective & subject matter expert based holistic form of market sizing coupled with industry analysis also plays a crucial role in this stage.
This stage involves in finalization of the market size and numbers that we have collected from data integration step. With data interpolation, it is made sure that there is no gap in the market data. Successful trend analysis is done by our analysts using extrapolation techniques, which provide the best possible forecasts for the market.
Data Validation & Market Feedback: Validation is the most important step in the process. Validation & re-validation via an intricately designed process helps us finalize data-points to be used for final calculations.

The Brainy Insights interacts with leading companies and experts of the concerned domain to develop the analyst team’s market understanding and expertise. It improves and substantiates every single data presented in the market reports. The data validation interview and discussion panels are typically composed of the most experienced industry members. The participants include, however, are not limited to:
Moreover, we always validate our data and findings through primary respondents from all the major regions we are working on.


Free Customization
Fortune 500 Clients
Free Yearly Update On Purchase Of Multi/Corporate License
Companies Served Till Date