- +1-315-215-1633
- sales@thebrainyinsights.com

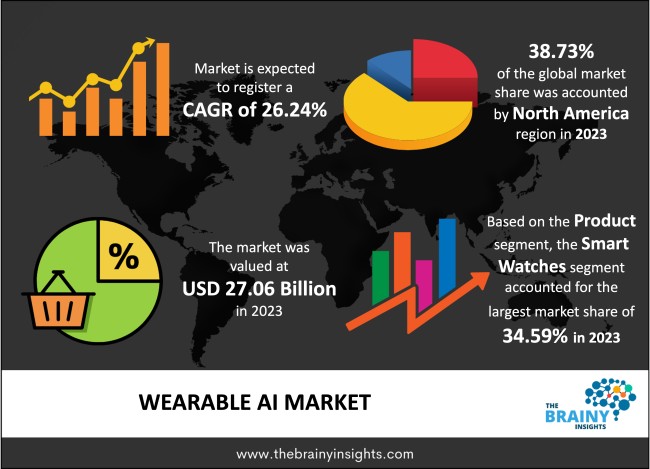
The global Wearable AI market generated USD 27.06 Billion revenue in 2023 and is projected to grow at a CAGR of 26.24% from 2024 to 2033. The market is expected to reach USD 289.38 billion by 2033. The surge in consumer preference for advanced wearable devices, coupled with the increasing disposable income among consumers and growing sales of smartwatches, is propelling market expansion. Additionally, the heightened adoption of wearable technology in the healthcare sector is a pivotal factor fueling market growth.
Wearable AI refers to integrating artificial intelligence technology into wearable devices, allowing them to perform intelligent functions and provide personalized experiences to users. These devices range from smart earwear, smartwatches, fitness trackers and augmented reality glasses to smart clothing. Wearable AI devices utilize sensors, processors, and algorithms to collect and analyze real-time data. They can track various aspects of users' lives, including health and fitness metrics, sleep patterns, and daily activities. By interpreting this data, wearable AI can offer insights, recommendations, and alerts tailored to individual users. One of the key advantages of wearable AI is its ability to enhance user convenience and productivity. These devices can streamline tasks, such as accessing information, making payments, and controlling smart home devices, all through intuitive gestures or voice commands. In addition to consumer applications, wearable AI is increasingly used in healthcare, manufacturing, and logistics industries. In healthcare, for example, wearable AI devices can monitor patients' vital signs, detect anomalies, and provide early warnings of potential health issues. Moreover, wearable AI represents a fusion of cutting-edge technology and everyday accessories, empowering users with personalized insights and enhancing their overall quality of life.
Get an overview of this study by requesting a free sample
Technological Advancements - Continued advances in artificial intelligence (AI), sensor technologies, and machine learning (ML) have immensely enhanced the capabilities of wearable devices. These advancements enable wearables to offer users more personalized and intuitive experiences, driving market growth.
Personalized Health and Wellness - Integrating AI technologies in wearable devices enables personalized health and wellness solutions tailored to individual users' needs and preferences. AI algorithms can analyze data collected from wearables to provide personalized insights, recommendations, and interventions for improving fitness, nutrition, sleep, and overall well-being. This personalization can enhance user engagement and adherence to healthy behaviours.
Rising Demand for Smartwatches and Fitness Trackers - The growing popularity and adoption of smartwatches and fitness trackers fuel the demand for wearable AI devices. These devices offer many functionalities, including notifications, fitness tracking, GPS navigation, and contactless payments, making them attractive to consumers seeking convenience and connectivity.
Privacy and Security Concerns - As wearable AI devices collect and analyze sensitive personal data, including health information and biometric data, privacy and data security concerns have become significant. Consumers are apprehensive about the potential misuse or unauthorized access to their personal information, which can hinder the adoption of wearable AI devices.
Limited Battery Life - Many wearable AI devices struggle with limited battery life, which can inconvenience users who rely on these devices throughout the day. The requirement for regular charging or battery replacement reduces user satisfaction and can deter potential customers from investing in wearable AI technology.
Healthcare and Remote Monitoring - Wearable AI devices offer significant remote patient monitoring and healthcare management opportunities. These devices can continuously collect vital health data, such as heart rate, blood pressure, and glucose levels, enabling healthcare professionals to monitor patients' health in real time and intervene when necessary. These features can enhance patient outcomes, lower healthcare costs, and increase access to healthcare services, especially in underserved areas.
Fashion and Lifestyle Integration - The convergence of fashion and technology presents opportunities for wearable AI devices to become more stylish, customizable, and socially acceptable. Fashion brands and designers are collaborating with technology companies to develop fashionable wearable AI devices that blend seamlessly with everyday attire and accessories. Customizable designs, interchangeable bands, and personalized styling options can enhance the appeal and adoption of wearable AI technology among fashion-conscious consumers.
Interoperability and Standardization - The need for interoperability and standardization among wearable AI devices poses challenges for seamless integration with other devices and platforms. Diverse operating systems, sensor technologies, and communication protocols hinder data sharing and compatibility, limiting the scalability and usability of wearable AI solutions in interconnected ecosystems.
User Experience and Design Complexity - Designing intuitive user interfaces and ergonomic form factors for wearable AI devices presents unique challenges due to the constraints of small screens, limited input options, and diverse user preferences. Balancing functionality with simplicity, responsiveness, and aesthetics is crucial for enhancing user experience and minimizing cognitive load. Iterative user testing, human-centred design principles, and adaptive interfaces can help address usability challenges and improve user acceptance.
The regions analyzed for the market include North America, Europe, South America, Asia Pacific, the Middle East, and Africa. North America emerged as the most prominent global Wearable AI market, with a 38.73% market revenue share in 2023.
North America, particularly the United States, is a global leader in technological innovation, with a robust ecosystem of research institutions, technology companies, and startups driving advancements in AI, machine learning, sensor technologies, and wearable computing. The presence of leading technology hubs such as Silicon Valley in California and the Boston-Cambridge area in Massachusetts fosters collaboration, entrepreneurship, and investment in wearable AI innovation. Furthermore, North America has a large and affluent consumer base with a high demand for wearable AI devices driven by health consciousness, fitness trends, digital lifestyle preferences, and early adoption of new technologies. Consumers in North America are willing to invest in wearable AI devices that offer convenience, connectivity, and personalized experiences, driving market growth and innovation. Additionally, North American companies are at the forefront of strategic partnerships, collaborations, and investments in the wearable AI market, leveraging their resources, expertise, and networks to drive market expansion and technology adoption. Partnerships between technology giants, healthcare providers, research institutions, and fashion brands facilitate product development, distribution channels, and market penetration for wearable AI devices. Besides, North America has a well-established regulatory framework and standards for wearable AI devices, ensuring safety, quality, and compliance with industry regulations. Regulatory agencies such as the FDA in the United States and Health Canada provide guidance, approvals, and oversight for wearable AI devices in healthcare and medical applications, instilling confidence in consumers and stakeholders.
North America Region Wearable AI Market Share in 2023 - 38.73%
www.thebrainyinsights.com
Check the geographical analysis of this market by requesting a free sample
The product segment is divided into smart watches, smart eyewear, smart earwear and others. The smart watches segment dominated the market, with a share of around 34.59% in 2023. Smartwatches offer various functionalities beyond timekeeping, including fitness tracking, notifications, communication, navigation, and mobile payments. The versatility of smartwatches appeals to consumers looking for a single device that can integrate multiple features and streamline daily activities. Furthermore, smartwatches seamlessly integrate with smartphones and other devices within popular ecosystems such as iOS (Apple) and Wear OS (Google). This integration allows users to receive notifications, access apps, and synchronize data across devices, enhancing the overall user experience and convenience. Most importantly, leading technology companies such as Apple, Samsung, and Garmin have established strong brand recognition and market leadership in the smartwatch segment. These companies invest heavily in research, development, marketing, and distribution channels, driving product innovation and market adoption.
The operation segment is classified into cloud-based AI and on-device AI. The on-device AI segment dominated the market, with a share of around 60.15% in 2023. On-device AI enables wearable devices to process data locally in real time without relying on cloud-based servers or internet connectivity. This feature allows faster response times, reduced latency, and improved user experiences, particularly in health monitoring, activity tracking, and gesture recognition applications. Moreover, on-device AI helps address privacy and security concerns by keeping sensitive data on the device and minimizing the need for data transmission over the internet. By processing data locally, wearable devices can maintain user privacy and confidentiality, reducing the risk of data breaches, hacking, and unauthorized access. In addition, on-device AI enables wearable devices to function offline or in environments with limited connectivity, such as remote areas or during network outages. This feature ensures continuous operation and functionality, allowing users to access essential features and services even when not connected to the internet.
The application segment includes automotive, consumer electronics, healthcare, military & defense, media & entertainment, and others. The consumer electronics segment dominated the market, with a share of around 36.81% in 2023. Leading consumer electronics companies such as Apple, Samsung, Garmin, Fitbit, and Xiaomi have established strong brand recognition and market presence in the wearable AI segment. These companies leverage their reputation, marketing prowess, distribution channels, and customer loyalty to drive sales and market share in the wearable AI market. Additionally, consumer electronics companies offer wearable AI devices, including smartwatches, fitness trackers, smart glasses, and smart clothing. These companies invest heavily and continuously in R&D and innovation to introduce new features, functionalities, and form factors that appeal to consumers' preferences and lifestyle needs. Besides, consumer electronics companies integrate wearable AI devices into their broader ecosystems of products and services, including smartphones, tablets, laptops, smart home devices, and digital platforms. Seamless integration with existing ecosystems enhances wearable AI devices' interoperability, functionality, and value proposition, driving consumer adoption and loyalty.
| Attribute | Description |
|---|---|
| Market Size | Revenue (USD Billion) |
| Market size value in 2023 | USD 27.06 Billion |
| Market size value in 2033 | USD 289.38 Billion |
| CAGR (2024 to 2033) | 26.24% |
| Historical data | 2020-2022 |
| Base Year | 2023 |
| Forecast | 2024-2033 |
| Region | The regions analyzed for the market are Asia Pacific, Europe, South America, North America, and Middle East & Africa. Furthermore, the regions are further analyzed at the country level. |
| Segments | Product, Operation, and Application |
As per The Brainy Insights, the size of the wearable AI market was valued at USD 27.06 billion in 2023 to USD 289.38 billion by 2033.
The global wearable AI market is growing at a CAGR of 26.24% during the forecast period 2024-2033.
North America became the largest market for wearable AI.
Technological advancements and rising demand for smartwatches and fitness trackers drive the market growth.
1. Introduction
1.1. Objectives of the Study
1.2. Market Definition
1.3. Research Scope
1.4. Currency
1.5. Key Target Audience
2. Research Methodology and Assumptions
3. Executive Summary
4. Premium Insights
4.1. Porter’s Five Forces Analysis
4.2. Value Chain Analysis
4.3. Top Investment Pockets
4.3.1. Market Attractiveness Analysis By Product
4.3.2. Market Attractiveness Analysis By Operation
4.3.3. Market Attractiveness Analysis By Application
4.3.4. Market Attractiveness Analysis By Region
4.4. Industry Trends
5. Market Dynamics
5.1. Market Evaluation
5.2. Drivers
5.2.1. Technological Advancements
5.2.2. Rising Demand for Smartwatches and Fitness Trackers
5.3. Restraints
5.3.1. Privacy and Security Concerns
5.4. Opportunities
5.4.1. Healthcare and Remote Monitoring
5.5. Challenges
5.5.1. Interoperability and Standardization
6. Global Wearable AI Market Analysis and Forecast, By Product
6.1. Segment Overview
6.2. Smart Watches
6.3. Smart Eyewear
6.4. Smart Earwear
6.5. Others
7. Global Wearable AI Market Analysis and Forecast, By Operation
7.1. Segment Overview
7.2. Cloud-based AI
7.3. On-device AI
8. Global Wearable AI Market Analysis and Forecast, By Application
8.1. Segment Overview
8.2. Automotive
8.3. Consumer Electronics
8.4. Healthcare
8.5. Military & Defense
8.6. Media & Entertainment
8.7. Others
9. Global Wearable AI Market Analysis and Forecast, By Regional Analysis
9.1. Segment Overview
9.2. North America
9.2.1. U.S.
9.2.2. Canada
9.2.3. Mexico
9.3. Europe
9.3.1. Germany
9.3.2. France
9.3.3. U.K.
9.3.4. Italy
9.3.5. Spain
9.4. Asia-Pacific
9.4.1. Japan
9.4.2. China
9.4.3. India
9.5. South America
9.5.1. Brazil
9.6. Middle East and Africa
9.6.1. UAE
9.6.2. South Africa
10. Global Wearable AI Market-Competitive Landscape
10.1. Overview
10.2. Market Share of Key Players in the Wearable AI Market
10.2.1. Global Company Market Share
10.2.2. North America Company Market Share
10.2.3. Europe Company Market Share
10.2.4. APAC Company Market Share
10.3. Competitive Situations and Trends
10.3.1. Product Launches and Developments
10.3.2. Partnerships, Collaborations, and Agreements
10.3.3. Mergers & Acquisitions
10.3.4. Expansions
11. Company Profiles
11.1. Apple, Inc.
11.1.1. Business Overview
11.1.2. Company Snapshot
11.1.3. Company Market Share Analysis
11.1.4. Company Product Portfolio
11.1.5. Recent Developments
11.1.6. SWOT Analysis
11.2. Amazon.com, Inc.
11.2.1. Business Overview
11.2.2. Company Snapshot
11.2.3. Company Market Share Analysis
11.2.4. Company Product Portfolio
11.2.5. Recent Developments
11.2.6. SWOT Analysis
11.3. Atlas
11.3.1. Business Overview
11.3.2. Company Snapshot
11.3.3. Company Market Share Analysis
11.3.4. Company Product Portfolio
11.3.5. Recent Developments
11.3.6. SWOT Analysis
11.4. Biobeats
11.4.1. Business Overview
11.4.2. Company Snapshot
11.4.3. Company Market Share Analysis
11.4.4. Company Product Portfolio
11.4.5. Recent Developments
11.4.6. SWOT Analysis
11.5. Boat
11.5.1. Business Overview
11.5.2. Company Snapshot
11.5.3. Company Market Share Analysis
11.5.4. Company Product Portfolio
11.5.5. Recent Developments
11.5.6. SWOT Analysis
11.6. Focusmotion
11.6.1. Business Overview
11.6.2. Company Snapshot
11.6.3. Company Market Share Analysis
11.6.4. Company Product Portfolio
11.6.5. Recent Developments
11.6.6. SWOT Analysis
11.7. Fitbit, Inc.
11.7.1. Business Overview
11.7.2. Company Snapshot
11.7.3. Company Market Share Analysis
11.7.4. Company Product Portfolio
11.7.5. Recent Developments
11.7.6. SWOT Analysis
11.8. Garmin Ltd.
11.8.1. Business Overview
11.8.2. Company Snapshot
11.8.3. Company Market Share Analysis
11.8.4. Company Product Portfolio
11.8.5. Recent Developments
11.8.6. SWOT Analysis
11.9. Google, Inc.
11.9.1. Business Overview
11.9.2. Company Snapshot
11.9.3. Company Market Share Analysis
11.9.4. Company Product Portfolio
11.9.5. Recent Developments
11.9.6. SWOT Analysis
11.10. Huawei Technologies Co. Ltd.
11.10.1. Business Overview
11.10.2. Company Snapshot
11.10.3. Company Market Share Analysis
11.10.4. Company Product Portfolio
11.10.5. Recent Developments
11.10.6. SWOT Analysis
11.11. IBM
11.11.1. Business Overview
11.11.2. Company Snapshot
11.11.3. Company Market Share Analysis
11.11.4. Company Product Portfolio
11.11.5. Recent Developments
11.11.6. SWOT Analysis
11.12. LG Electronics
11.12.1. Business Overview
11.12.2. Company Snapshot
11.12.3. Company Market Share Analysis
11.12.4. Company Product Portfolio
11.12.5. Recent Developments
11.12.6. SWOT Analysis
11.13. Lenovo
11.13.1. Business Overview
11.13.2. Company Snapshot
11.13.3. Company Market Share Analysis
11.13.4. Company Product Portfolio
11.13.5. Recent Developments
11.13.6. SWOT Analysis
11.14. Microsoft
11.14.1. Business Overview
11.14.2. Company Snapshot
11.14.3. Company Market Share Analysis
11.14.4. Company Product Portfolio
11.14.5. Recent Developments
11.14.6. SWOT Analysis
11.15. Motorola Solutions, Inc.
11.15.1. Business Overview
11.15.2. Company Snapshot
11.15.3. Company Market Share Analysis
11.15.4. Company Product Portfolio
11.15.5. Recent Developments
11.15.6. SWOT Analysis
11.16. OPPO
11.16.1. Business Overview
11.16.2. Company Snapshot
11.16.3. Company Market Share Analysis
11.16.4. Company Product Portfolio
11.16.5. Recent Developments
11.16.6. SWOT Analysis
11.17. Samsung
11.17.1. Business Overview
11.17.2. Company Snapshot
11.17.3. Company Market Share Analysis
11.17.4. Company Product Portfolio
11.17.5. Recent Developments
11.17.6. SWOT Analysis
11.18. Sony Corporation
11.18.1. Business Overview
11.18.2. Company Snapshot
11.18.3. Company Market Share Analysis
11.18.4. Company Product Portfolio
11.18.5. Recent Developments
11.18.6. SWOT Analysis
11.19. TomTom International B.V.
11.19.1. Business Overview
11.19.2. Company Snapshot
11.19.3. Company Market Share Analysis
11.19.4. Company Product Portfolio
11.19.5. Recent Developments
11.19.6. SWOT Analysis
11.20. Xiaomi
11.20.1. Business Overview
11.20.2. Company Snapshot
11.20.3. Company Market Share Analysis
11.20.4. Company Product Portfolio
11.20.5. Recent Developments
11.20.6. SWOT Analysis
11.21. Wearable Devices Ltd.
11.21.1. Business Overview
11.21.2. Company Snapshot
11.21.3. Company Market Share Analysis
11.21.4. Company Product Portfolio
11.21.5. Recent Developments
11.21.6. SWOT Analysis
List of Table
1. Global Wearable AI Market, By Product, 2020-2033 (USD Billion)
2. Global Smart Watches Wearable AI Market, By Region, 2020-2033 (USD Billion)
3. Global Smart Eyewear Wearable AI Market, By Region, 2020-2033 (USD Billion)
4. Global Smart Earwear Wearable AI Market, By Region, 2020-2033 (USD Billion)
5. Global Others Wearable AI Market, By Region, 2020-2033 (USD Billion)
6. Global Wearable AI Market, By Operation, 2020-2033 (USD Billion)
7. Global Cloud-based AI Wearable AI Market, By Region, 2020-2033 (USD Billion)
8. Global On-device AI Wearable AI Market, By Region, 2020-2033 (USD Billion)
9. Global Wearable AI Market, By Application, 2020-2033 (USD Billion)
10. Global Automotive Wearable AI Market, By Region, 2020-2033 (USD Billion)
11. Global Consumer Electronics Wearable AI Market, By Region, 2020-2033 (USD Billion)
12. Global Healthcare Wearable AI Market, By Region, 2020-2033 (USD Billion)
13. Global Military & Defense Wearable AI Market, By Region, 2020-2033 (USD Billion)
14. Global Media & Entertainment Wearable AI Market, By Region, 2020-2033 (USD Billion)
15. Global Others, Wearable AI Market, By Region, 2020-2033 (USD Billion)
16. Global Wearable AI Market, By Region, 2020-2033 (USD Billion)
17. North America Wearable AI Market, By Product, 2020-2033 (USD Billion)
18. North America Wearable AI Market, By Operation, 2020-2033 (USD Billion)
19. North America Wearable AI Market, By Application, 2020-2033 (USD Billion)
20. U.S. Wearable AI Market, By Product, 2020-2033 (USD Billion)
21. U.S. Wearable AI Market, By Operation, 2020-2033 (USD Billion)
22. U.S. Wearable AI Market, By Application, 2020-2033 (USD Billion)
23. Canada Wearable AI Market, By Product, 2020-2033 (USD Billion)
24. Canada Wearable AI Market, By Operation, 2020-2033 (USD Billion)
25. Canada Wearable AI Market, By Application, 2020-2033 (USD Billion)
26. Mexico Wearable AI Market, By Product, 2020-2033 (USD Billion)
27. Mexico Wearable AI Market, By Operation, 2020-2033 (USD Billion)
28. Mexico Wearable AI Market, By Application, 2020-2033 (USD Billion)
29. Europe Wearable AI Market, By Product, 2020-2033 (USD Billion)
30. Europe Wearable AI Market, By Operation, 2020-2033 (USD Billion)
31. Europe Wearable AI Market, By Application, 2020-2033 (USD Billion)
32. Germany Wearable AI Market, By Product, 2020-2033 (USD Billion)
33. Germany Wearable AI Market, By Operation, 2020-2033 (USD Billion)
34. Germany Wearable AI Market, By Application, 2020-2033 (USD Billion)
35. France Wearable AI Market, By Product, 2020-2033 (USD Billion)
36. France Wearable AI Market, By Operation, 2020-2033 (USD Billion)
37. France Wearable AI Market, By Application, 2020-2033 (USD Billion)
38. U.K. Wearable AI Market, By Product, 2020-2033 (USD Billion)
39. U.K. Wearable AI Market, By Operation, 2020-2033 (USD Billion)
40. U.K. Wearable AI Market, By Application, 2020-2033 (USD Billion)
41. Italy Wearable AI Market, By Product, 2020-2033 (USD Billion)
42. Italy Wearable AI Market, By Operation, 2020-2033 (USD Billion)
43. Italy Wearable AI Market, By Application, 2020-2033 (USD Billion)
44. Spain Wearable AI Market, By Product, 2020-2033 (USD Billion)
45. Spain Wearable AI Market, By Operation, 2020-2033 (USD Billion)
46. Spain Wearable AI Market, By Application, 2020-2033 (USD Billion)
47. Asia Pacific Wearable AI Market, By Product, 2020-2033 (USD Billion)
48. Asia Pacific Wearable AI Market, By Operation, 2020-2033 (USD Billion)
49. Asia Pacific Wearable AI Market, By Application, 2020-2033 (USD Billion)
50. Japan Wearable AI Market, By Product, 2020-2033 (USD Billion)
51. Japan Wearable AI Market, By Operation, 2020-2033 (USD Billion)
52. Japan Wearable AI Market, By Application, 2020-2033 (USD Billion)
53. China Wearable AI Market, By Product, 2020-2033 (USD Billion)
54. China Wearable AI Market, By Operation, 2020-2033 (USD Billion)
55. China Wearable AI Market, By Application, 2020-2033 (USD Billion)
56. India Wearable AI Market, By Product, 2020-2033 (USD Billion)
57. India Wearable AI Market, By Operation, 2020-2033 (USD Billion)
58. India Wearable AI Market, By Application, 2020-2033 (USD Billion)
59. South America Wearable AI Market, By Product, 2020-2033 (USD Billion)
60. South America Wearable AI Market, By Operation, 2020-2033 (USD Billion)
61. South America Wearable AI Market, By Application, 2020-2033 (USD Billion)
62. Brazil Wearable AI Market, By Product, 2020-2033 (USD Billion)
63. Brazil Wearable AI Market, By Operation, 2020-2033 (USD Billion)
64. Brazil Wearable AI Market, By Application, 2020-2033 (USD Billion)
65. Middle East and Africa Wearable AI Market, By Product, 2020-2033 (USD Billion)
66. Middle East and Africa Wearable AI Market, By Operation, 2020-2033 (USD Billion)
67. Middle East and Africa Wearable AI Market, By Application, 2020-2033 (USD Billion)
68. UAE Wearable AI Market, By Product, 2020-2033 (USD Billion)
69. UAE Wearable AI Market, By Operation, 2020-2033 (USD Billion)
70. UAE Wearable AI Market, By Application, 2020-2033 (USD Billion)
71. South Africa Wearable AI Market, By Product, 2020-2033 (USD Billion)
72. South Africa Wearable AI Market, By Operation, 2020-2033 (USD Billion)
73. South Africa Wearable AI Market, By Application, 2020-2033 (USD Billion)
List of Figures
1. Global Wearable AI Market Segmentation
2. Wearable AI Market: Research Methodology
3. Market Size Estimation Methodology: Bottom-Up Approach
4. Market Size Estimation Methodology: Top-Down Approach
5. Data Triangulation
6. Porter’s Five Forces Analysis
7. Value Chain Analysis
8. Global Wearable AI Market Attractiveness Analysis By Product
9. Global Wearable AI Market Attractiveness Analysis By Operation
10. Global Wearable AI Market Attractiveness Analysis By Application
11. Global Wearable AI Market Attractiveness Analysis by Region
12. Global Wearable AI Market: Dynamics
13. Global Wearable AI Market Share By Product (2024 & 2033)
14. Global Wearable AI Market Share By Operation (2024 & 2033)
15. Global Wearable AI Market Share By Application (2024 & 2033)
16. Global Wearable AI Market Share by Regions (2024 & 2033)
17. Global Wearable AI Market Share by Company (2023)
This study forecasts revenue at global, regional, and country levels from 2020 to 2033. The Brainy Insights has segmented the global Wearable AI market based on below-mentioned segments:
Global Wearable AI Market by Product:
Global Wearable AI Market by Operation:
Global Wearable AI Market by Application:
Global Wearable AI Market by Region:
Research has its special purpose to undertake marketing efficiently. In this competitive scenario, businesses need information across all industry verticals; the information about customer wants, market demand, competition, industry trends, distribution channels etc. This information needs to be updated regularly because businesses operate in a dynamic environment. Our organization, The Brainy Insights incorporates scientific and systematic research procedures in order to get proper market insights and industry analysis for overall business success. The analysis consists of studying the market from a miniscule level wherein we implement statistical tools which helps us in examining the data with accuracy and precision.
Our research reports feature both; quantitative and qualitative aspects for any market. Qualitative information for any market research process are fundamental because they reveal the customer needs and wants, usage and consumption for any product/service related to a specific industry. This in turn aids the marketers/investors in knowing certain perceptions of the customers. Qualitative research can enlighten about the different product concepts and designs along with unique service offering that in turn, helps define marketing problems and generate opportunities. On the other hand, quantitative research engages with the data collection process through interviews, e-mail interactions, surveys and pilot studies. Quantitative aspects for the market research are useful to validate the hypotheses generated during qualitative research method, explore empirical patterns in the data with the help of statistical tools, and finally make the market estimations.
The Brainy Insights offers comprehensive research and analysis, based on a wide assortment of factual insights gained through interviews with CXOs and global experts and secondary data from reliable sources. Our analysts and industry specialist assume vital roles in building up statistical tools and analysis models, which are used to analyse the data and arrive at accurate insights with exceedingly informative research discoveries. The data provided by our organization have proven precious to a diverse range of companies, facilitating them to address issues such as determining which products/services are the most appealing, whether or not customers use the product in the manner anticipated, the purchasing intentions of the market and many others.
Our research methodology encompasses an idyllic combination of primary and secondary initiatives. Key phases involved in this process are listed below:

The phase involves the gathering and collecting of market data and its related information with the help of different sources & research procedures.

The data procurement stage involves in data gathering and collecting through various data sources.
This stage involves in extensive research. These data sources includes:
Purchased Database: Purchased databases play a crucial role in estimating the market sizes irrespective of the domain. Our purchased database includes:
Primary Research: The Brainy Insights interacts with leading companies and experts of the concerned domain to develop the analyst team’s market understanding and expertise. It improves and substantiates every single data presented in the market reports. Primary research mainly involves in telephonic interviews, E-mail interactions and face-to-face interviews with the raw material providers, manufacturers/producers, distributors, & independent consultants. The interviews that we conduct provides valuable data on market size and industry growth trends prevailing in the market. Our organization also conducts surveys with the various industry experts in order to gain overall insights of the industry/market. For instance, in healthcare industry we conduct surveys with the pharmacists, doctors, surgeons and nurses in order to gain insights and key information of a medical product/device/equipment which the customers are going to usage. Surveys are conducted in the form of questionnaire designed by our own analyst team. Surveys plays an important role in primary research because surveys helps us to identify the key target audiences of the market. Additionally, surveys helps to identify the key target audience engaged with the market. Our survey team conducts the survey by targeting the key audience, thus gaining insights from them. Based on the perspectives of the customers, this information is utilized to formulate market strategies. Moreover, market surveys helps us to understand the current competitive situation of the industry. To be precise, our survey process typically involve with the 360 analysis of the market. This analytical process begins by identifying the prospective customers for a product or service related to the market/industry to obtain data on how a product/service could fit into customers’ lives.

Secondary Research: The secondary data sources includes information published by the on-profit organizations such as World bank, WHO, company fillings, investor presentations, annual reports, national government documents, statistical databases, blogs, articles, white papers and others. From the annual report, we analyse a company’s revenue to understand the key segment and market share of that organization in a particular region. We analyse the company websites and adopt the product mapping technique which is important for deriving the segment revenue. In the product mapping method, we select and categorize the products offered by the companies catering to domain specific market, deduce the product revenue for each of the companies so as to get overall estimation of the market size. We also source data and analyses trends based on information received from supply side and demand side intermediaries in the value chain. The supply side denotes the data gathered from supplier, distributor, wholesaler and the demand side illustrates the data gathered from the end customers for respective market domain.

The supply side for a domain specific market is analysed by:
The demand side for the market is estimated through:
In-house Library: Apart from these third-party sources, we have our in-house library of qualitative and quantitative information. Our in-house database includes market data for various industry and domains. These data are updated on regular basis as per the changing market scenario. Our library includes, historic databases, internal audit reports and archives.
Sometimes there are instances where there is no metadata or raw data available for any domain specific market. For those cases, we use our expertise to forecast and estimate the market size in order to generate comprehensive data sets. Our analyst team adopt a robust research technique in order to produce the estimates:
Data Synthesis: This stage involves the analysis & mapping of all the information obtained from the previous step. It also involves in scrutinizing the data for any discrepancy observed while data gathering related to the market. The data is collected with consideration to the heterogeneity of sources. Robust scientific techniques are in place for synthesizing disparate data sets and provide the essential contextual information that can orient market strategies. The Brainy Insights has extensive experience in data synthesis where the data passes through various stages:


Market Deduction & Formulation: The final stage comprises of assigning data points at appropriate market spaces so as to deduce feasible conclusions. Analyst perspective & subject matter expert based holistic form of market sizing coupled with industry analysis also plays a crucial role in this stage.
This stage involves in finalization of the market size and numbers that we have collected from data integration step. With data interpolation, it is made sure that there is no gap in the market data. Successful trend analysis is done by our analysts using extrapolation techniques, which provide the best possible forecasts for the market.
Data Validation & Market Feedback: Validation is the most important step in the process. Validation & re-validation via an intricately designed process helps us finalize data-points to be used for final calculations.

The Brainy Insights interacts with leading companies and experts of the concerned domain to develop the analyst team’s market understanding and expertise. It improves and substantiates every single data presented in the market reports. The data validation interview and discussion panels are typically composed of the most experienced industry members. The participants include, however, are not limited to:
Moreover, we always validate our data and findings through primary respondents from all the major regions we are working on.


Free Customization
Fortune 500 Clients
Free Yearly Update On Purchase Of Multi/Corporate License
Companies Served Till Date