- +1-315-215-1633
- sales@thebrainyinsights.com

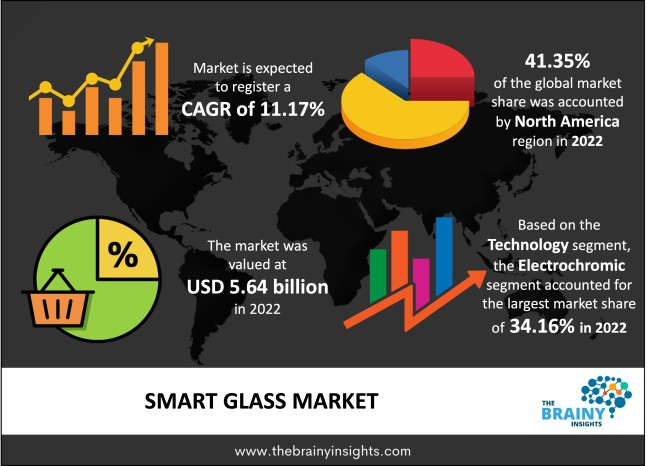
The global smart glass market was valued at USD 5.64 billion in 2022, growing at a CAGR of 11.17% from 2023 to 2032. The market is expected to reach USD 16.26 billion by 2032. A favourable regulatory scenario facilitating financial & tax benefits, the expanding construction industry, along with the increasing investment in infrastructure projects are propelling the market growth over the forecast period.
Smart glass, also known as privacy glass or switchable glass, refers to a type of glass that can change its opacity or transparency on command. Smart glass is a kind of architectural glass that adjusts its light transmission capabilities in reaction to light, temperature, or voltage. Smart glass may perform various tasks, including limiting UV and infrared light, adjusting natural light, advertising, and providing security. Smart glass helps in saving a significant amount of energy on heating, cooling, and lighting. These smart glasses are used in different applications, such as architecture, aviation, and healthcare. Smart glass is utilized in hospitals for its ease of cleaning, anti-microbial & hygienic properties, and affordable replacement for traditional disposable curtains.
Get an overview of this study by requesting a free sample
For example, in January 2022, Gentex Company, a foremost automotive manufacturer of progressive technology, declared that it is partnering with eSight to develop next-generation mobile electronic eyewear designed to help people with observable impairment problems.
For example, in January 2022, Gentex partnered with eSight to develop digital eyewear for supporting people with visual impairment.
The implementation of automation in the industrial sector: The automation of various processes in the manufacturing industry is reducing the requirement for human labour. Further, industries worldwide are deploying automation solutions to carry out complicated manufacturing processes. Industrial automation allows high efficiency, the predictive maintenance of machines, and good safety; it also raises profitability. The growing implementation of automation across industries provides possible opportunities for utilizing smart glasses in industrial automation. Apart from this, the increasing government investments in the railway sector and the rising demand for smart glass in the construction industry are also helping stimulate market growth. However, the increasing shift towards sustainable buildings due to the greater requirement for energy savings, stringent carbon goals, and rising ageing of existing buildings are propelling the market growth.
The technical limitations and unattractive design: The technical limitations & unattractive design are the restraining factor of the market growth. Further, the lack of awareness among customers about long-term benefits and an increasing number of complexities are restraining factors of the market growth. Moreover, the high cost of the product, along with the easy availability of the product, are expected to hinder market growth in the forthcoming year.
The rising research & development within solar power generation: The increasing inclination of customers towards glass over bricks & cement walls is an opportunity factor for market growth. Further, solar energy generation is gaining immense popularity & grabbing the awareness of environmentally aware people. Solar power generation is the primary mode of renewable energy conversion. Many nations worldwide are continuously flourishing to raise their output of solar power panels due to their energy-efficient & cost-productive nature. Moreover, the ongoing renovation & replacement activities worldwide are helping increase market growth during the forecast period.
The regions analyzed for the market include North America, Europe, South America, Asia Pacific, the Middle East, and Africa. North America emerged as the largest global smart glass market, with a 41.35% market revenue share in 2022. The rising decline in the prices of electrochromic materials, along with the increasing optimal energy saving via smart glass applications, are expected to propel market growth in this region. Moreover, the increasing continuous increment in the construction of organizational structures, along with the rising expansion of application areas of smart glass, is anticipated to drive market growth in this region. Apart from this, the availability of value-added goods such as laminated glass and the enactment of energy-saving construction laws in the area are also expected to drive market growth. The Asia-Pacific region will account for the largest market share with revenue growth. This growth is attributed to technological advancements and a recovering economy.
Moreover, emerging new competencies of smart glasses in the wearable technology sector are also propelling market growth in this region. Further, the increasing applications of smart glass in sectors like automotive, building & construction, renewable energy plants, aerospace, and others are also helping to boost market growth. Additionally, the increasing product demand for enhanced aesthetics in commercial &n residential buildings is expected to propel market growth over the forecast period.
North America Region Smart glass Market Share in 2022 - 41.35%
www.thebrainyinsights.com
Check the geographical analysis of this market by requesting a free sample
The technology segment is divided into polymer dispersed liquid crystal (PDLC), electrochromic, suspended particle devices (SPD), photochromic, and thermochromic. The electrochromic segment dominated the market, with a market share of around 34.16% in 2022. This growth is attributed to the increasing benefits, including a higher blockage ratio of IV & UV rays combined with low driving voltage. Further, by 2032, the suspended particle devices (SPD) segment will likely dominate the market due to the rising demand for products developed using smart glass in the construction sector.
The application segment is divided into consumer electronics, architecture, power generation, transportation, and others. The transportation segment dominated, with a market share of around 32.18% 2022. This growth is attributed to the awareness of the potential to control heat & glare, minimize carbon emissions, and improve fuel consumption. Further, by 2032, the architecture segment will likely dominate the market due to the increasing number of infrastructure projects & the adoption of smart glass by the corporate headquarters & commercial office buildings.
| Attribute | Description |
|---|---|
| Market Size | Revenue (USD Billion) |
| Market size value in 2022 | USD 5.64 Billion |
| Market size value in 2032 | USD 16.26 Billion |
| CAGR (2023 to 2032) | 11.17% |
| Historical data | 2019-2021 |
| Base Year | 2022 |
| Forecast | 2023-2032 |
| Region | The regions analyzed for the market are Asia Pacific, Europe, South America, North America, and Middle East & Africa. Furthermore, the regions are further analyzed at the country level. |
| Segments | Technology, Application |
As per The Brainy Insights, the size of the smart glass market was valued at USD 5.64 Billion in 2022 to USD 16.26 Billion by 2032.
The global smart glass market is growing at a CAGR of 11.17% during the forecast period 2023-2032.
The global smart glass market has been segmented based on technology, application, and regions. The electrochromic segment led the technology segment in 2022. The transportation segment led the application segment in 2022.
North America region emerged as the largest market for smart glass.
Key players are Asahi India Glass Limited, AGC Inc., Polytronix Inc., Compagnie de Saint-Gobain S.A., Gauzy Ltd, ChromoGenics AB, Halio Inc., Research Frontiers Inc., Diamond Glass Limited, View Inc., Gentex Corporation and among others.
1. Introduction
1.1. Objectives of the Study
1.2. Market Definition
1.3. Research Scope
1.4. Currency
1.5. Key Target Audience
2. Research Methodology and Assumptions
3. Executive Summary
4. Premium Insights
4.1. Porter’s Five Forces Analysis
4.2. Value Chain Analysis
4.3. Top Investment Pockets
4.3.1. Market Attractiveness Analysis By Technology
4.3.2. Market Attractiveness Analysis By Application
4.3.3. Market Attractiveness Analysis By Region
4.4. Industry Trends
5. Market Dynamics
5.1. Market Evaluation
5.2. Market Evaluation
5.3. Drivers
5.3.1. The increasing renovation and replacement activities
5.3.2. The implementation of automation in the industrial sector
5.4. Restraints
5.4.1. The fluctuation in prices of raw materials
5.4.2. The technical limitations and unattractive design
5.5. Opportunities
5.5.1. The rising research & development within solar power generation
5.5.2. An increasing number of supportive government initiatives
6. Global Smart Glass Market Analysis and Forecast, By Technology
6.1. Segment Overview
6.2. Polymer Dispersed Liquid Crystal (PDLC)
6.3. Electrochromic
6.4. Suspended Particle Devices (SPD)
6.5. Photochromic
6.6. Thermochromic
7. Global Smart Glass Market Analysis and Forecast, By Application
7.1. Segment Overview
7.2. Consumer Electronics
7.3. Architectural
7.4. Power Generation
7.5. Transportation
7.6. Others
8. Global Smart Glass Market Analysis and Forecast, By Regional Analysis
8.1. Segment Overview
8.2. North America
8.2.1. U.S.
8.2.2. Canada
8.2.3. Mexico
8.3. Europe
8.3.1. Germany
8.3.2. France
8.3.3. U.K.
8.3.4. Italy
8.3.5. Spain
8.4. Asia-Pacific
8.4.1. Japan
8.4.2. China
8.4.3. India
8.5. South America
8.5.1. Brazil
8.6. Middle East and Africa
8.6.1. UAE
8.6.2. South Africa
9. Global Smart Glass Market-Competitive Landscape
9.1. Overview
9.2. Market Share of Key Players in Global Smart Glass Market
9.2.1. Global Company Market Share
9.2.2. North America Company Market Share
9.2.3. Europe Company Market Share
9.2.4. APAC Company Market Share
9.3. Competitive Situations and Trends
9.3.1. Product Launches and Developments
9.3.2. Partnerships, Collaborations, and Agreements
9.3.3. Mergers & Acquisitions
9.3.4. Expansions
10. Company Profiles
10.1. Asahi India Glass Limited, AGC Inc.
10.1.1. Business Overview
10.1.2. Company Snapshot
10.1.3. Company Market Share Analysis
10.1.4. Company Product Portfolio
10.1.5. Recent Developments
10.1.6. SWOT Analysis
10.2. Polytronix Inc.
10.2.1. Business Overview
10.2.2. Company Snapshot
10.2.3. Company Market Share Analysis
10.2.4. Company Product Portfolio
10.2.5. Recent Developments
10.2.6. SWOT Analysis
10.3. Compagnie de Saint-Gobain S.A.
10.3.1. Business Overview
10.3.2. Company Snapshot
10.3.3. Company Market Share Analysis
10.3.4. Company Product Portfolio
10.3.5. Recent Developments
10.3.6. SWOT Analysis
10.4. Gauzy Ltd
10.4.1. Business Overview
10.4.2. Company Snapshot
10.4.3. Company Market Share Analysis
10.4.4. Company Product Portfolio
10.4.5. Recent Developments
10.4.6. SWOT Analysis
10.5. ChromoGenics AB
10.5.1. Business Overview
10.5.2. Company Snapshot
10.5.3. Company Market Share Analysis
10.5.4. Company Product Portfolio
10.5.5. Recent Developments
10.5.6. SWOT Analysis
10.6. Halio Inc.
10.6.1. Business Overview
10.6.2. Company Snapshot
10.6.3. Company Market Share Analysis
10.6.4. Company Product Portfolio
10.6.5. Recent Developments
10.6.6. SWOT Analysis
10.7. Research Frontiers Inc.
10.7.1. Business Overview
10.7.2. Company Snapshot
10.7.3. Company Market Share Analysis
10.7.4. Company Product Portfolio
10.7.5. Recent Developments
10.7.6. SWOT Analysis
10.8. Diamond Glass Limited
10.8.1. Business Overview
10.8.2. Company Snapshot
10.8.3. Company Market Share Analysis
10.8.4. Company Product Portfolio
10.8.5. Recent Developments
10.8.6. SWOT Analysis
10.9. View Inc.
10.9.1. Business Overview
10.9.2. Company Snapshot
10.9.3. Company Market Share Analysis
10.9.4. Company Product Portfolio
10.9.5. Recent Developments
10.9.6. SWOT Analysis
10.10. Gentex Corporation
10.10.1. Business Overview
10.10.2. Company Snapshot
10.10.3. Company Market Share Analysis
10.10.4. Company Product Portfolio
10.10.5. Recent Developments
10.10.6. SWOT Analysis
List of Table
1. Global Smart Glass Market, By Technology, 2019-2032 (USD Billion)
2. Global Polymer Dispersed Liquid Crystal (PDLC), Smart Glass Market, By Region, 2019-2032 (USD Billion)
3. Global Electrochromic, Smart Glass Market, By Region, 2019-2032 (USD Billion)
4. Global Suspended Particle Devices (SPD), Smart Glass Market, By Region, 2019-2032 (USD Billion)
5. Global Photochromic, Smart Glass Market, By Region, 2019-2032 (USD Billion)
6. Global Thermochromic, Smart Glass Market, By Region, 2019-2032 (USD Billion)
7. Global Smart Glass Market, By Application, 2019-2032 (USD Billion)
8. Global Consumer Electronics, Smart Glass Market, By Region, 2019-2032 (USD Billion)
9. Global Architectural, Smart Glass Market, By Region, 2019-2032 (USD Billion)
10. Global Power Generation, Smart Glass Market, By Region, 2019-2032 (USD Billion)
11. Global Transportation, Smart Glass Market, By Region, 2019-2032 (USD Billion)
12. Global Others, Smart Glass Market, By Region, 2019-2032 (USD Billion)
13. North America Smart Glass Market, By Technology, 2019-2032 (USD Billion)
14. North America Smart Glass Market, By Application, 2019-2032 (USD Billion)
15. U.S. Smart Glass Market, By Technology, 2019-2032 (USD Billion)
16. U.S. Smart Glass Market, By Application, 2019-2032 (USD Billion)
17. Canada Smart Glass Market, By Technology, 2019-2032 (USD Billion)
18. Canada Smart Glass Market, By Application, 2019-2032 (USD Billion)
19. Mexico Smart Glass Market, By Technology, 2019-2032 (USD Billion)
20. Mexico Smart Glass Market, By Application, 2019-2032 (USD Billion)
21. Europe Smart Glass Market, By Technology, 2019-2032 (USD Billion)
22. Europe Smart Glass Market, By Application, 2019-2032 (USD Billion)
23. Germany Smart Glass Market, By Technology, 2019-2032 (USD Billion)
24. Germany Smart Glass Market, By Application, 2019-2032 (USD Billion)
25. France Smart Glass Market, By Technology, 2019-2032 (USD Billion)
26. France Smart Glass Market, By Application 2019-2032 (USD Billion)
27. U.K. Smart Glass Market, By Technology, 2019-2032 (USD Billion)
28. U.K. Smart Glass Market, By Application 2019-2032 (USD Billion)
29. Italy Smart Glass Market, By Technology, 2019-2032 (USD Billion)
30. Italy Smart Glass Market, By Application 2019-2032 (USD Billion)
31. Spain Smart Glass Market, By Technology, 2019-2032 (USD Billion)
32. Spain Smart Glass Market, By Application 2019-2032 (USD Billion)
33. Asia Pacific Smart Glass Market, By Technology, 2019-2032 (USD Billion)
34. Asia Pacific Smart Glass Market, By Application 2019-2032 (USD Billion)
35. Japan Smart Glass Market, By Technology, 2019-2032 (USD Billion)
36. Japan Smart Glass Market, By Application 2019-2032 (USD Billion)
37. China Smart Glass Market, By Technology, 2019-2032 (USD Billion)
38. China Smart Glass Market, By Application 2019-2032 (USD Billion)
39. India Smart Glass Market, By Technology, 2019-2032 (USD Billion)
40. India Smart Glass Market, By Application 2019-2032 (USD Billion)
41. South America Smart Glass Market, By Technology, 2019-2032 (USD Billion)
42. South America Smart Glass Market, By Application 2019-2032 (USD Billion)
43. Brazil Smart Glass Market, By Technology, 2019-2032 (USD Billion)
44. Brazil Smart Glass Market, By Application 2019-2032 (USD Billion)
45. Middle East and Africa Smart Glass Market, By Technology, 2019-2032 (USD Billion)
46. Middle East and Africa Smart Glass Market, By Application 2019-2032 (USD Billion)
47. UAE Smart Glass Market, By Technology, 2019-2032 (USD Billion)
48. UAE Smart Glass Market, By Application 2019-2032 (USD Billion)
49. South Africa Smart Glass Market, By Technology, 2019-2032 (USD Billion)
50. South Africa Smart Glass Market, By Application 2019-2032 (USD Billion)
List of Figures
1. Global Smart Glass Market Segmentation
2. Global Smart Glass Market: Research Methodology
3. Market Size Estimation Methodology: Bottom-Up Approach
4. Market Size Estimation Methodology: Top-Down Approach
5. Data Triangulation
6. Porter’s Five Forces Analysis
7. Value Chain Analysis
8. Global Smart Glass Market Attractiveness Analysis By Technology
9. Global Smart Glass Market Attractiveness Analysis By Application
10. Global Smart Glass Market Attractiveness Analysis By Region
11. Global Smart Glass Market: Dynamics
12. Global Smart Glass Market Share By Technology (2023 & 2032)
13. Global Smart Glass Market Share By Application (2023 & 2032)
14. Global Smart Glass Market Share By Regions (2023 & 2032)
15. Global Smart Glass Market Share By Company (2022)
This study forecasts revenue at global, regional, and country levels from 2019 to 2030. The Brainy Insights has segmented the global smart glass based on below mentioned segments:
Global Smart Glass Market by Technology:
Global Smart Glass Market by Application:
Global Smart Glass by Region:
Research has its special purpose to undertake marketing efficiently. In this competitive scenario, businesses need information across all industry verticals; the information about customer wants, market demand, competition, industry trends, distribution channels etc. This information needs to be updated regularly because businesses operate in a dynamic environment. Our organization, The Brainy Insights incorporates scientific and systematic research procedures in order to get proper market insights and industry analysis for overall business success. The analysis consists of studying the market from a miniscule level wherein we implement statistical tools which helps us in examining the data with accuracy and precision.
Our research reports feature both; quantitative and qualitative aspects for any market. Qualitative information for any market research process are fundamental because they reveal the customer needs and wants, usage and consumption for any product/service related to a specific industry. This in turn aids the marketers/investors in knowing certain perceptions of the customers. Qualitative research can enlighten about the different product concepts and designs along with unique service offering that in turn, helps define marketing problems and generate opportunities. On the other hand, quantitative research engages with the data collection process through interviews, e-mail interactions, surveys and pilot studies. Quantitative aspects for the market research are useful to validate the hypotheses generated during qualitative research method, explore empirical patterns in the data with the help of statistical tools, and finally make the market estimations.
The Brainy Insights offers comprehensive research and analysis, based on a wide assortment of factual insights gained through interviews with CXOs and global experts and secondary data from reliable sources. Our analysts and industry specialist assume vital roles in building up statistical tools and analysis models, which are used to analyse the data and arrive at accurate insights with exceedingly informative research discoveries. The data provided by our organization have proven precious to a diverse range of companies, facilitating them to address issues such as determining which products/services are the most appealing, whether or not customers use the product in the manner anticipated, the purchasing intentions of the market and many others.
Our research methodology encompasses an idyllic combination of primary and secondary initiatives. Key phases involved in this process are listed below:

The phase involves the gathering and collecting of market data and its related information with the help of different sources & research procedures.

The data procurement stage involves in data gathering and collecting through various data sources.
This stage involves in extensive research. These data sources includes:
Purchased Database: Purchased databases play a crucial role in estimating the market sizes irrespective of the domain. Our purchased database includes:
Primary Research: The Brainy Insights interacts with leading companies and experts of the concerned domain to develop the analyst team’s market understanding and expertise. It improves and substantiates every single data presented in the market reports. Primary research mainly involves in telephonic interviews, E-mail interactions and face-to-face interviews with the raw material providers, manufacturers/producers, distributors, & independent consultants. The interviews that we conduct provides valuable data on market size and industry growth trends prevailing in the market. Our organization also conducts surveys with the various industry experts in order to gain overall insights of the industry/market. For instance, in healthcare industry we conduct surveys with the pharmacists, doctors, surgeons and nurses in order to gain insights and key information of a medical product/device/equipment which the customers are going to usage. Surveys are conducted in the form of questionnaire designed by our own analyst team. Surveys plays an important role in primary research because surveys helps us to identify the key target audiences of the market. Additionally, surveys helps to identify the key target audience engaged with the market. Our survey team conducts the survey by targeting the key audience, thus gaining insights from them. Based on the perspectives of the customers, this information is utilized to formulate market strategies. Moreover, market surveys helps us to understand the current competitive situation of the industry. To be precise, our survey process typically involve with the 360 analysis of the market. This analytical process begins by identifying the prospective customers for a product or service related to the market/industry to obtain data on how a product/service could fit into customers’ lives.

Secondary Research: The secondary data sources includes information published by the on-profit organizations such as World bank, WHO, company fillings, investor presentations, annual reports, national government documents, statistical databases, blogs, articles, white papers and others. From the annual report, we analyse a company’s revenue to understand the key segment and market share of that organization in a particular region. We analyse the company websites and adopt the product mapping technique which is important for deriving the segment revenue. In the product mapping method, we select and categorize the products offered by the companies catering to domain specific market, deduce the product revenue for each of the companies so as to get overall estimation of the market size. We also source data and analyses trends based on information received from supply side and demand side intermediaries in the value chain. The supply side denotes the data gathered from supplier, distributor, wholesaler and the demand side illustrates the data gathered from the end customers for respective market domain.

The supply side for a domain specific market is analysed by:
The demand side for the market is estimated through:
In-house Library: Apart from these third-party sources, we have our in-house library of qualitative and quantitative information. Our in-house database includes market data for various industry and domains. These data are updated on regular basis as per the changing market scenario. Our library includes, historic databases, internal audit reports and archives.
Sometimes there are instances where there is no metadata or raw data available for any domain specific market. For those cases, we use our expertise to forecast and estimate the market size in order to generate comprehensive data sets. Our analyst team adopt a robust research technique in order to produce the estimates:
Data Synthesis: This stage involves the analysis & mapping of all the information obtained from the previous step. It also involves in scrutinizing the data for any discrepancy observed while data gathering related to the market. The data is collected with consideration to the heterogeneity of sources. Robust scientific techniques are in place for synthesizing disparate data sets and provide the essential contextual information that can orient market strategies. The Brainy Insights has extensive experience in data synthesis where the data passes through various stages:


Market Deduction & Formulation: The final stage comprises of assigning data points at appropriate market spaces so as to deduce feasible conclusions. Analyst perspective & subject matter expert based holistic form of market sizing coupled with industry analysis also plays a crucial role in this stage.
This stage involves in finalization of the market size and numbers that we have collected from data integration step. With data interpolation, it is made sure that there is no gap in the market data. Successful trend analysis is done by our analysts using extrapolation techniques, which provide the best possible forecasts for the market.
Data Validation & Market Feedback: Validation is the most important step in the process. Validation & re-validation via an intricately designed process helps us finalize data-points to be used for final calculations.

The Brainy Insights interacts with leading companies and experts of the concerned domain to develop the analyst team’s market understanding and expertise. It improves and substantiates every single data presented in the market reports. The data validation interview and discussion panels are typically composed of the most experienced industry members. The participants include, however, are not limited to:
Moreover, we always validate our data and findings through primary respondents from all the major regions we are working on.


Free Customization
Fortune 500 Clients
Free Yearly Update On Purchase Of Multi/Corporate License
Companies Served Till Date