- +1-315-215-1633
- sales@thebrainyinsights.com

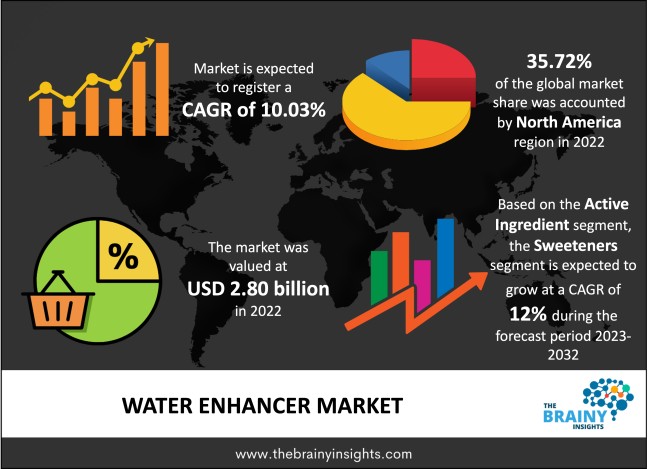
The global water enhancer market is calculated to reach USD 7.28 billion by 2032, at a CAGR of 10.03% from 2023 to 2032. The global water enhancer market is expanding as consumers focus more on maintaining their health. Consumers are always searching for suitable products to stay healthy and hydrated for their day-to-day life. Nowadays, consumers prefer tiny, bottled water drops, where concentrated flavour enhancers can instantly convert water into an improved drink, as these drops have healthy ingredients. Thus, the evolution in consumer choice from soft drinks (CSD) to functional nutrition drinks has boosted the demand for the global water enhancer market.
A water enhancer is a concentrated flavoured liquid mixed with regular water to give consumers a unique taste and flavour. It comes in different flavours like tea, coffee, organic fruit and sweet. It is rich in nutrients and minerals and is claimed to increase water intake by enhancing the smooth taste of natural water. The health risks of soft drinks (carbonated) have been a crucial subject among health-conscious people. Carbonation is the process by which CO2 decomposes into water under high pressure and low temperatures. As a result, the regular consumption of soft drinks (carbonated) can lead to some specific health diseases. With declining interest in soft drinks (carbonated), the water enhancers market presents an attractive additional opportunity to flavour filtered and tap water.
Get an overview of this study by requesting a free sample
April 2022 - Robinsons has introduced innovative new water enhancer benefit drops with added vitamins in four flavours. Robinsons is a renowned brand of Britvic PLC. These drops provide excellent taste and extra vitamins and are perfect for consumers to carry anywhere.
December 2022 - Protekt has announced new beverage enhancers and liquid supplements, which will provide high-potency antioxidants like vitamins C and D, zinc and echinacea to improve and sustain optimal health and immunity. The liquid formula comes in two flavours orange and mixed berry.
Rising Awareness of Healthy Lifestyle – Rising health and wellness concerns among consumers are one of the major drivers driving the growth of the water enhancer market. The sugar content in soft drinks (carbonated) is very high. Obesity is one of the significant problems in this area, so most people are trying to dodge it by using these alternative water enhancers.
Growing Demand for Non-Alcoholic Beverages and Water Enhancer Flavours - There is an increasing need for ready-to-drink beverages in the market. Rising awareness, increasing per capita income, and rapid urbanization are driving the rise of the global water enhancer market. One of the significant aspects projected to boost the need for water softeners is the easy availability of water enhancers in various flavours, providing consumers with plenty of options to experiment, enjoy and purchase a variety of these products. For example, Elvin Water Enhancer has four different flavours, including Lemon Lime, Raspberry Peach, Strawberry, Naartjie, and others, making sparkling or purified water more pleasant and acceptable, thus boosting the growth of the global water enhancer market.
Availability of Alternative Products - The easy availability of substitute products such as soft drinks (Carbonated) can hamper the growth of the global water enhancer market.
Harmful Effects of Chemicals - Water enhancer uses various chemicals that are very harmful to human health. Water enhancers have synthetic flavours and colours linked to rising potential health risks ranging from allergic reactions to cancers. Propylene glycol and sucralose are other chemicals of great interest to health professionals. Sucralose is a zero-calorie artificial sweetener 300 to 600 times sweeter than regular sugar. Sucralose has been demonstrated to adversely affect gut health and insulin levels and increase blood sugar. Artificial sweeteners do more harm than good. A liquid substance called propylene glycol is used to soak moisture. Since it is often used in antifreeze, this colourless liquid has raised some concerns.
Technology Advancements in Packaging - The rising tendency towards proper hydration and healthy consumption is pushing the growth of the global water enhancer market. As people become more conscious of the dangerous consequences of soft drinks (carbonated) and added-sugar soft drinks on human health, the need for a nutrient-filled drink with health benefits is also increasing. A water enhancer is easy to carry and can provide affordable nutrition on the go. The industry is also gaining ground due to the growing need for customized drinks. The increasing requirement for natural plant-based solutions is spurring innovation in the market.
New Product Launches - Companies are continuously manufacturing new products and adding them to their product portfolios. They are implementing aggressive marketing strategies to create a market for their products. New companies focus on their supply chain functions to compete with big industry players. The global water enhancer market is projected to grow significantly during the forecast period, with established companies and new entrants competing for domination. A water enhancer is a liquid water additive that can be added to plain water to increase flavour, energy and nutrition, which is much more practical and economical than purchasing flavoured or processed water. Manufacturers of energy drinks and flavoured waters, such as Celsius Groupe's sports drinks, come in nine different flavours, including watermelon, blueberry, raspberry, lemon, mango, and orange. H2ROSE, which applies rose water to make pleasantly fragrant drinks, releases numerous unique flavour drinks.
Government’s Packaging Regulations - To receive the proper certifications, key companies must adhere to quality standards and packaging problems. This factor will challenge the growth of the global water enhancer market over the forecast period.
The regions analyzed for the market include North America, South America, Europe, Asia Pacific, and the Middle East & Africa.
North America generated the highest market share in 2022. Diabetes is one of the significant problems in North America. Approximately 38.26 million people are living with it in the country. This factor has raised the priority of healthy foods, including zero calories and low sugar. An increasing understanding of the threats associated with diabetes and coronary heart disease has increased consumer interest in healthy food substitutes. The North American market is also expected to grow aggressively in the coming years. The easy availability of water enhancers in various tastes offers a chance to relish, research and buy multiple products to customers, which leads to a rising need for water enhancers. Besides, the Elvin water enhancer comes in different flavours, such as raspberry peach, strawberry, lemon-lime and nartjie, making the sparkling or still water more attractive and leading the market.
Europe is anticipated to register a lucrative market share over the forecast period. Nowadays, companies are launching new water enhancers that are gluten-free, ketogenic, non-dairy, vegan, and low in carbs. The market for water enhancers is anticipated to increase over the forecast period as these products satisfy a wide range of consumer needs.
North America Region Water Enhancer Market Share in 2022 – 35.72%
www.thebrainyinsights.com
Check the geographical analysis of this market by requesting a free sample
The product type section is divided into flavoured water enhancer, workout water enhancer, and energy/fitness water enhancer. The flavoured water enhancer section registered the largest market share in 2022 and is expected to gain a profitable CAGR in the coming years. Consumers are choosing these flavoured water enhancers compared to others for their different and enhanced taste with numerous health advantages. A flavoured water enhancer is an ideal substitute for a soft drink (carbonated). Furthermore, the commercial success of flavoured water enhancers has been attributed to an increased emphasis on the flavour of the final drink/beverage. In addition, energy/fitness water enhancers are anticipated to be the fastest-rising segment owing to the increasing understanding among people to stay fit and maintain their health.
The form section includes powder water enhancer, water enhancer tablets and liquid water enhancer. The liquid water enhancer section registered the highest revenue share in 2022 due to the easy availability and wide acceptance of water enhancers in liquid form. Big companies like Jel Sert and Kraft Heinz Company offer mostly liquid water enhancers. For example, Kraft Heinz Company's Mio is one of the leading brands serving liquid water enhancers. Hence, big manufacturers' attention to the liquid form of water enhancers has further contributed to obtaining this sector's most significant share. The powder segment is anticipated to witness the fastest growth rate in the coming years. The growing attention on powder form of products by new manufacturers such as Dyla LLC, Nunn and others is driving the demand for the powder water enhancer segment.
Furthermore, the lengthy shelf life of powder water enhancers is also a significant factor, pushing the need for this segment. Moreover, the increasing requirements for nutritional powder products among the fitness crowd further propel the need for the powder segment. At the same time, it is driving demand for the water enhancer market.
The sweeteners segment held the highest market share in 2022 and is anticipated to dominate the water enhancer market during the forecast period. Synthetic sweeteners are mixed with water enhancers in various formulations to give the water a sweet taste. Some of the most familiar synthetic sweeteners are acesulfame potassium and sucralose. Synthetic sweeteners can enhance the flavour/taste of drinks and satisfy an individual's nutritional needs. Growing consumer acceptance of sugar-free and plant-based drinks/beverages is anticipated to drive the market for natural sweeteners such as stevia, maple syrup and honey, which will make new growth options for beverage/drink manufacturers.
The distribution channel section includes offline and online. The offline segment is further segmented into hypermarket/supermarket, convenience store, specialty stores and others. The online segment is further divided into e-commerce platforms and brand website. The offline segment registered the largest market share in 2022. Buyers like to shop in traditional offline stores due to accessibility and availability. The number of hypermarkets and supermarkets in developing countries such as India and China has grown aggressively, leading to overall product sales growth. Apart from this, offline stores offer various types of product details and preferences before purchasing anything, contributing to this segment's growth. The online segment is anticipated to register the fastest compound annual growth rate (CAGR) from 2023 to 2032 due to the growing penetration of smartphones and the widespread use of the internet and online shopping apps and websites. In addition, many e-commerce players, such as Flipkart, Amazon and JD.com, are collaborating with water enhancer companies and retailers to deliver water enhancers through their online channels. Hence, the increasing number of collaborations among retail stores and e-commerce has led to a notable gain in online sales globally. Meanwhile, many major players, like Nestle, Coca-Cola Company, Kraft Heinz Company, and others, have launched their online platforms, supporting the growth of the online segment.
| Attribute | Description |
|---|---|
| Market Size | Revenue (USD Billion) |
| Market size value in 2022 | USD 2.80 Billion |
| Market size value in 2032 | USD 7.28 Billion |
| CAGR (2023 to 2032) | 10.03% |
| Historical data | 2019-2021 |
| Base Year | 2022 |
| Forecast | 2023-2032 |
| Regional Segments | The regions are segmented into North America, South America, Asia Pacific, Europe, and Middle East and Africa. |
| Segments | Product Type, Form, Active Ingredient, and Distribution Channel |
As per The Brainy Insights, the size of the water enhancer market was valued at USD 2.80 billion in 2022 to USD 7.28 billion by 2032.
The global water enhancer market is growing at a CAGR of 10.03% during the forecast period 2023-2032.
The North America region became the largest market for water enhancer.
Rising awareness of healthy lifestyle is influencing the market's growth.
1. Introduction
1.1. Objectives of the Study
1.2. Market Definition
1.3. Research Scope
1.4. Currency
1.5. Key Target Audience
2. Research Methodology and Assumptions
3. Executive Summary
4. Premium Insights
4.1. Porter’s Five Forces Analysis
4.2. Value Chain Analysis
4.3. Top Investment Pockets
4.3.1. Market Attractiveness Analysis by Product Type
4.3.2. Market Attractiveness Analysis by Form
4.3.3. Market Attractiveness Analysis by Active Ingredient
4.3.4. Market Attractiveness Analysis by Distribution Channel
4.3.5. Market Attractiveness Analysis By Region
4.4. Industry Trends
5. Market Dynamics
5.1. Market Evaluation
5.2. Drivers
5.2.1. Rising Awareness of Healthy Lifestyle
5.2.2. Growing Demand of Non-Alcoholic Beverages and Water Enhancer Flavours
5.3. Restraints
5.3.1. Availability of Alternative Products
5.3.2. Harmful Effects of Chemicals
5.4. Opportunities
5.4.1. Technology Advancements in Packaging
5.4.2. New Product Launches
5.5. Challenges
5.5.1. Government’s Packaging Regulations
6. Global Water Enhancer Market Analysis and Forecast, By Product Type
6.1. Segment Overview
6.2. Flavoured Water Enhancer
6.3. Workout Water Enhancer
6.4. Energy/Fitness Water Enhancer
7. Global Water Enhancer Market Analysis and Forecast, By Form
7.1. Segment Overview
7.2. Powder Water Enhancer
7.3. Water Enhancer Tablets
7.4. Liquid Water Enhancer
8. Global Water Enhancer Market Analysis and Forecast, By Active Ingredient
8.1. Segment Overview
8.2. Sweeteners
8.3. Electrolytes
8.4. Vitamins
8.5. Antioxidants
9. Global Water Enhancer Market Analysis and Forecast, By Distribution Channel
9.1. Segment Overview
9.2. Offline
9.2.1. Hypermarket/Supermarket
9.2.2. Convenience Store
9.2.3. Specialty Stores
9.2.4. Others
9.3. Online
9.3.1. E-commerce Platforms
9.3.2. Brand Website
10. Global Water Enhancer Market Analysis and Forecast, By Region Analysis
10.1. Segment Overview
10.2. North America
10.2.1. U.S.
10.2.2. Canada
10.2.3. Mexico
10.3. Europe
10.3.1. Germany
10.3.2. France
10.3.3. U.K.
10.3.4. Italy
10.3.5. Spain
10.4. Asia-Pacific
10.4.1. Japan
10.4.2. China
10.4.3. India
10.5. South America
10.5.1. Brazil
10.6. Middle East and Africa
10.6.1. UAE
10.6.2. South Africa
11. Global Water Enhancer Market-Competitive Landscape
11.1. Overview
11.2. Market Share of Key Players in the Water Enhancer Market
11.2.1. Global Company Market Share
11.2.2. North America Company Market Share
11.2.3. Europe Company Market Share
11.2.4. APAC Company Market Share
11.3. Competitive Situations and Trends
11.3.1. Product Launches and Developments
11.3.2. Partnerships, Collaborations, and Agreements
11.3.3. Mergers & Acquisitions
11.3.4. Expansions
12. Company Profiles
12.1. 4C Foods
12.1.1. Business Overview
12.1.2. Company Snapshot
12.1.3. Company Market Share Analysis
12.1.4. Company Product Portfolio
12.1.5. Recent Developments
12.1.6. SWOT Analysis
12.2. AriZona Beverages USA LLC
12.2.1. Business Overview
12.2.2. Company Snapshot
12.2.3. Company Market Share Analysis
12.2.4. Company Product Portfolio
12.2.5. Recent Developments
12.2.6. SWOT Analysis
12.3. Biogen SA
12.3.1. Business Overview
12.3.2. Company Snapshot
12.3.3. Company Market Share Analysis
12.3.4. Company Product Portfolio
12.3.5. Recent Developments
12.3.6. SWOT Analysis
12.4. BPI Sports LLC
12.4.1. Business Overview
12.4.2. Company Snapshot
12.4.3. Company Market Share Analysis
12.4.4. Company Product Portfolio
12.4.5. Recent Developments
12.4.6. SWOT Analysis
12.5. Britvic plc
12.5.1. Business Overview
12.5.2. Company Snapshot
12.5.3. Company Market Share Analysis
12.5.4. Company Product Portfolio
12.5.5. Recent Developments
12.5.6. SWOT Analysis
12.6. Beyond Water
12.6.1. Business Overview
12.6.2. Company Snapshot
12.6.3. Company Market Share Analysis
12.6.4. Company Product Portfolio
12.6.5. Recent Developments
12.6.6. SWOT Analysis
12.7. Brite Idea Foods LLC
12.7.1. Business Overview
12.7.2. Company Snapshot
12.7.3. Company Market Share Analysis
12.7.4. Company Product Portfolio
12.7.5. Recent Developments
12.7.6. SWOT Analysis
12.8. DS International
12.8.1. Business Overview
12.8.2. Company Snapshot
12.8.3. Company Market Share Analysis
12.8.4. Company Product Portfolio
12.8.5. Recent Developments
12.8.6. SWOT Analysis
12.9. Dyla LLC (Stur)
12.9.1. Business Overview
12.9.2. Company Snapshot
12.9.3. Company Market Share Analysis
12.9.4. Company Product Portfolio
12.9.5. Recent Developments
12.9.6. SWOT Analysis
12.10. Elvin Group
12.10.1. Business Overview
12.10.2. Company Snapshot
12.10.3. Company Market Share Analysis
12.10.4. Company Product Portfolio
12.10.5. Recent Developments
12.10.6. SWOT Analysis
12.11. GNC Holdings LLC
12.11.1. Business Overview
12.11.2. Company Snapshot
12.11.3. Company Market Share Analysis
12.11.4. Company Product Portfolio
12.11.5. Recent Developments
12.11.6. SWOT Analysis
12.12. Heartland Food Products Group
12.12.1. Business Overview
12.12.2. Company Snapshot
12.12.3. Company Market Share Analysis
12.12.4. Company Product Portfolio
12.12.5. Recent Developments
12.12.6. SWOT Analysis
12.13. Keurig Dr Pepper Inc.
12.13.1. Business Overview
12.13.2. Company Snapshot
12.13.3. Company Market Share Analysis
12.13.4. Company Product Portfolio
12.13.5. Recent Developments
12.13.6. SWOT Analysis
12.14. Mondelez International
12.14.1. Business Overview
12.14.2. Company Snapshot
12.14.3. Company Market Share Analysis
12.14.4. Company Product Portfolio
12.14.5. Recent Developments
12.14.6. SWOT Analysis
12.15. Nutritech
12.15.1. Business Overview
12.15.2. Company Snapshot
12.15.3. Company Market Share Analysis
12.15.4. Company Product Portfolio
12.15.5. Recent Developments
12.15.6. SWOT Analysis
12.16. Nestle S.A.
12.16.1. Business Overview
12.16.2. Company Snapshot
12.16.3. Company Market Share Analysis
12.16.4. Company Product Portfolio
12.16.5. Recent Developments
12.16.6. SWOT Analysis
12.17. Nuun
12.17.1. Business Overview
12.17.2. Company Snapshot
12.17.3. Company Market Share Analysis
12.17.4. Company Product Portfolio
12.17.5. Recent Developments
12.17.6. SWOT Analysis
12.18. Netrition Inc.
12.18.1. Business Overview
12.18.2. Company Snapshot
12.18.3. Company Market Share Analysis
12.18.4. Company Product Portfolio
12.18.5. Recent Developments
12.18.6. SWOT Analysis
12.19. PepsiCo Inc.
12.19.1. Business Overview
12.19.2. Company Snapshot
12.19.3. Company Market Share Analysis
12.19.4. Company Product Portfolio
12.19.5. Recent Developments
12.19.6. SWOT Analysis
12.20. Primo Water Corp.
12.20.1. Business Overview
12.20.2. Company Snapshot
12.20.3. Company Market Share Analysis
12.20.4. Company Product Portfolio
12.20.5. Recent Developments
12.20.6. SWOT Analysis
12.21. Protekt
12.21.1. Business Overview
12.21.2. Company Snapshot
12.21.3. Company Market Share Analysis
12.21.4. Company Product Portfolio
12.21.5. Recent Developments
12.21.6. SWOT Analysis
12.22. Rasna Private Ltd.
12.22.1. Business Overview
12.22.2. Company Snapshot
12.22.3. Company Market Share Analysis
12.22.4. Company Product Portfolio
12.22.5. Recent Developments
12.22.6. SWOT Analysis
12.23. Refresco Group BV
12.23.1. Business Overview
12.23.2. Company Snapshot
12.23.3. Company Market Share Analysis
12.23.4. Company Product Portfolio
12.23.5. Recent Developments
12.23.6. SWOT Analysis
12.24. sKoya
12.24.1. Business Overview
12.24.2. Company Snapshot
12.24.3. Company Market Share Analysis
12.24.4. Company Product Portfolio
12.24.5. Recent Developments
12.24.6. SWOT Analysis
12.25. Sunkist Growers Inc.
12.25.1. Business Overview
12.25.2. Company Snapshot
12.25.3. Company Market Share Analysis
12.25.4. Company Product Portfolio
12.25.5. Recent Developments
12.25.6. SWOT Analysis
12.26. SweetLeaf Stevia Sweetener
12.26.1. Business Overview
12.26.2. Company Snapshot
12.26.3. Company Market Share Analysis
12.26.4. Company Product Portfolio
12.26.5. Recent Developments
12.26.6. SWOT Analysis
12.27. Target Corp.
12.27.1. Business Overview
12.27.2. Company Snapshot
12.27.3. Company Market Share Analysis
12.27.4. Company Product Portfolio
12.27.5. Recent Developments
12.27.6. SWOT Analysis
12.27.7.
12.28. The Coca-Cola Company
12.28.1. Business Overview
12.28.2. Company Snapshot
12.28.3. Company Market Share Analysis
12.28.4. Company Product Portfolio
12.28.5. Recent Developments
12.28.6. SWOT Analysis
12.29. The Kraft Heinz Company
12.29.1. Business Overview
12.29.2. Company Snapshot
12.29.3. Company Market Share Analysis
12.29.4. Company Product Portfolio
12.29.5. Recent Developments
12.29.6. SWOT Analysis
12.30. The Jel Sert Co.
12.30.1. Business Overview
12.30.2. Company Snapshot
12.30.3. Company Market Share Analysis
12.30.4. Company Product Portfolio
12.30.5. Recent Developments
12.30.6. SWOT Analysis
12.31. Wisdom Natural Brands
12.31.1. Business Overview
12.31.2. Company Snapshot
12.31.3. Company Market Share Analysis
12.31.4. Company Product Portfolio
12.31.5. Recent Developments
12.31.6. SWOT Analysis
List of Table
1. Global Water Enhancer Market, By Product Type, 2019-2032 (USD Billion)
2. Global Flavoured Water Enhancer Market, By Region, 2019-2032 (USD Billion)
3. Global Workout Water Enhancer Market, By Region, 2019-2032 (USD Billion)
4. Global Energy/Fitness Water Enhancer Market, By Region, 2019-2032 (USD Billion)
5. Global Water Enhancer Market, By Form, 2019-2032 (USD Billion)
6. Global Powder Water Enhancer Market, By Region, 2019-2032 (USD Billion)
7. Global Water Enhancer Tablets Water Enhancer Market, By Region, 2019-2032 (USD Billion)
8. Global Liquid Water Enhancer Market, By Region, 2019-2032 (USD Billion)
9. Global Water Enhancer Market, By Active Ingredient, 2019-2032 (USD Billion)
10. Global Sweeteners Water Enhancer Market, By Region, 2019-2032 (USD Billion)
11. Global Electrolytes Water Enhancer Market, By Region, 2019-2032 (USD Billion)
12. Global Vitamins Water Enhancer Market, By Region, 2019-2032 (USD Billion)
13. Global Antioxidants Water Enhancer Market, By Region, 2019-2032 (USD Billion)
14. Global Water Enhancer Market, By Distribution Channel, 2019-2032 (USD Billion)
15. Global Offline Water Enhancer Market, By Region, 2019-2032 (USD Billion)
16. Global Online Water Enhancer Market, By Region, 2019-2032 (USD Billion)
17. Global Water Enhancer Market, By Region, 2019-2032 (USD Billion)
18. North America Water Enhancer Market, By Product Type, 2019-2032 (USD Billion)
19. North America Water Enhancer Market, By Form, 2019-2032 (USD Billion)
20. North America Water Enhancer Market, By Active Ingredient, 2019-2032 (USD Billion)
21. North America Water Enhancer Market, By Distribution Channel, 2019-2032 (USD Billion)
22. U.S. Water Enhancer Market, By Product Type, 2019-2032 (USD Billion)
23. U.S. Water Enhancer Market, By Form, 2019-2032 (USD Billion)
24. U.S. Water Enhancer Market, By Active Ingredient, 2019-2032 (USD Billion)
25. U.S. Water Enhancer Market, By Distribution Channel, 2019-2032 (USD Billion)
26. Canada Water Enhancer Market, By Product Type, 2019-2032 (USD Billion)
27. Canada Water Enhancer Market, By Form, 2019-2032 (USD Billion)
28. Canada Water Enhancer Market, By Active Ingredient, 2019-2032 (USD Billion)
29. Canada Water Enhancer Market, By Distribution Channel, 2019-2032 (USD Billion)
30. Mexico Water Enhancer Market, By Product Type, 2019-2032 (USD Billion)
31. Mexico Water Enhancer Market, By Form, 2019-2032 (USD Billion)
32. Mexico Water Enhancer Market, By Active Ingredient, 2019-2032 (USD Billion)
33. Mexico Water Enhancer Market, By Distribution Channel, 2019-2032 (USD Billion)
34. Europe Water Enhancer Market, By Product Type, 2019-2032 (USD Billion)
35. Europe Water Enhancer Market, By Form, 2019-2032 (USD Billion)
36. Europe Water Enhancer Market, By Active Ingredient, 2019-2032 (USD Billion)
37. Europe Water Enhancer Market, By Distribution Channel, 2019-2032 (USD Billion)
38. Germany Water Enhancer Market, By Product Type, 2019-2032 (USD Billion)
39. Germany Water Enhancer Market, By Form, 2019-2032 (USD Billion)
40. Germany Water Enhancer Market, By Active Ingredient, 2019-2032 (USD Billion)
41. Germany Water Enhancer Market, By Distribution Channel, 2019-2032 (USD Billion)
42. France Water Enhancer Market, By Product Type, 2019-2032 (USD Billion)
43. France Water Enhancer Market, By Form, 2019-2032 (USD Billion)
44. France Water Enhancer Market, By Active Ingredient, 2019-2032 (USD Billion)
45. France Water Enhancer Market, By Distribution Channel, 2019-2032 (USD Billion)
46. U.K. Water Enhancer Market, By Product Type, 2019-2032 (USD Billion)
47. U.K. Water Enhancer Market, By Form, 2019-2032 (USD Billion)
48. U.K. Water Enhancer Market, By Active Ingredient, 2019-2032 (USD Billion)
49. U.K. Water Enhancer Market, By Distribution Channel, 2019-2032 (USD Billion)
50. Italy Water Enhancer Market, By Product Type, 2019-2032 (USD Billion)
51. Italy Water Enhancer Market, By Form, 2019-2032 (USD Billion)
52. Italy Water Enhancer Market, By Active Ingredient, 2019-2032 (USD Billion)
53. Italy Water Enhancer Market, By Distribution Channel, 2019-2032 (USD Billion)
54. Spain Water Enhancer Market, By Product Type, 2019-2032 (USD Billion)
55. Spain Water Enhancer Market, By Form, 2019-2032 (USD Billion)
56. Spain Water Enhancer Market, By Active Ingredient, 2019-2032 (USD Billion)
57. Spain Water Enhancer Market, By Distribution Channel, 2019-2032 (USD Billion)
58. Asia Pacific Water Enhancer Market, By Product Type, 2019-2032 (USD Billion)
59. Asia Pacific Water Enhancer Market, By Form, 2019-2032 (USD Billion)
60. Asia Pacific Water Enhancer Market, By Active Ingredient, 2019-2032 (USD Billion)
61. Asia Pacific Water Enhancer Market, By Distribution Channel, 2019-2032 (USD Billion)
62. Japan Water Enhancer Market, By Product Type, 2019-2032 (USD Billion)
63. Japan Water Enhancer Market, By Form, 2019-2032 (USD Billion)
64. Japan Water Enhancer Market, By Active Ingredient, 2019-2032 (USD Billion)
65. Japan Water Enhancer Market, By Distribution Channel, 2019-2032 (USD Billion)
66. China Water Enhancer Market, By Product Type, 2019-2032 (USD Billion)
67. China Water Enhancer Market, By Form, 2019-2032 (USD Billion)
68. China Water Enhancer Market, By Active Ingredient, 2019-2032 (USD Billion)
69. China Water Enhancer Market, By Distribution Channel, 2019-2032 (USD Billion)
70. India Water Enhancer Market, By Product Type, 2019-2032 (USD Billion)
71. India Water Enhancer Market, By Form, 2019-2032 (USD Billion)
72. India Water Enhancer Market, By Active Ingredient, 2019-2032 (USD Billion)
73. India Water Enhancer Market, By Distribution Channel, 2019-2032 (USD Billion)
74. South America Water Enhancer Market, By Product Type, 2019-2032 (USD Billion)
75. South America Water Enhancer Market, By Form, 2019-2032 (USD Billion)
76. South America Water Enhancer Market, By Active Ingredient, 2019-2032 (USD Billion)
77. South America Water Enhancer Market, By Distribution Channel, 2019-2032 (USD Billion)
78. Brazil Water Enhancer Market, By Product Type, 2019-2032 (USD Billion)
79. Brazil Water Enhancer Market, By Form, 2019-2032 (USD Billion)
80. Brazil Water Enhancer Market, By Active Ingredient, 2019-2032 (USD Billion)
81. Brazil Water Enhancer Market, By Distribution Channel, 2019-2032 (USD Billion)
82. Middle East and Africa Water Enhancer Market, By Product Type, 2019-2032 (USD Billion)
83. Middle East and Africa Water Enhancer Market, By Form, 2019-2032 (USD Billion)
84. Middle East and Africa Water Enhancer Market, By Active Ingredient, 2019-2032 (USD Billion)
85. Middle East and Africa Water Enhancer Market, By Distribution Channel, 2019-2032 (USD Billion)
86. UAE Water Enhancer Market, By Product Type, 2019-2032 (USD Billion)
87. UAE Water Enhancer Market, By Form, 2019-2032 (USD Billion)
88. UAE Water Enhancer Market, By Active Ingredient, 2019-2032 (USD Billion)
89. UAE Water Enhancer Market, By Distribution Channel, 2019-2032 (USD Billion)
90. South Africa Water Enhancer Market, By Product Type, 2019-2032 (USD Billion)
91. South Africa Water Enhancer Market, By Form, 2019-2032 (USD Billion)
92. South Africa Water Enhancer Market, By Active Ingredient, 2019-2032 (USD Billion)
93. South Africa Water Enhancer Market, By Distribution Channel, 2019-2032 (USD Billion)
List of Figures
1. Global Water Enhancer Market Segmentation
2. Water Enhancer Market: Research Methodology
3. Market Size Estimation Methodology: Bottom-Up Approach
4. Market Size Estimation Methodology: Top-Down Approach
5. Data Triangulation
6. Porter’s Five Forces Analysis
7. Value Chain Analysis
8. Global Water Enhancer Market Attractiveness Analysis by Product Type
9. Global Water Enhancer Market Attractiveness Analysis by Form
10. Global Water Enhancer Market Attractiveness Analysis by Active Ingredient
11. Global Water Enhancer Market Attractiveness Analysis by Distribution Channel
12. Global Water Enhancer Market Attractiveness Analysis by Region
13. Global Water Enhancer Market: Dynamics
14. Global Water Enhancer Market Share by Product Type (2023 & 2032)
15. Global Water Enhancer Market Share by Form (2023 & 2032)
16. Global Water Enhancer Market Share by Active Ingredient (2023 & 2032)
17. Global Water Enhancer Market Share by Distribution Channel (2023 & 2032)
18. Global Water Enhancer Market Share by Region (2023 & 2032)
19. Global Water Enhancer Market Share by Company (2022)
This study forecasts revenue at global, regional, and country levels from 2019 to 2032. The Brainy Insights has segmented the global water enhancer market based on below-mentioned segments:
Global Water Enhancer Market by Product Type:
Global Water Enhancer Market by Form:
Global Water Enhancer Market by Active Ingredient:
Global Water Enhancer Market by Distribution Channel:
Global Water Enhancer Market by Region:
Research has its special purpose to undertake marketing efficiently. In this competitive scenario, businesses need information across all industry verticals; the information about customer wants, market demand, competition, industry trends, distribution channels etc. This information needs to be updated regularly because businesses operate in a dynamic environment. Our organization, The Brainy Insights incorporates scientific and systematic research procedures in order to get proper market insights and industry analysis for overall business success. The analysis consists of studying the market from a miniscule level wherein we implement statistical tools which helps us in examining the data with accuracy and precision.
Our research reports feature both; quantitative and qualitative aspects for any market. Qualitative information for any market research process are fundamental because they reveal the customer needs and wants, usage and consumption for any product/service related to a specific industry. This in turn aids the marketers/investors in knowing certain perceptions of the customers. Qualitative research can enlighten about the different product concepts and designs along with unique service offering that in turn, helps define marketing problems and generate opportunities. On the other hand, quantitative research engages with the data collection process through interviews, e-mail interactions, surveys and pilot studies. Quantitative aspects for the market research are useful to validate the hypotheses generated during qualitative research method, explore empirical patterns in the data with the help of statistical tools, and finally make the market estimations.
The Brainy Insights offers comprehensive research and analysis, based on a wide assortment of factual insights gained through interviews with CXOs and global experts and secondary data from reliable sources. Our analysts and industry specialist assume vital roles in building up statistical tools and analysis models, which are used to analyse the data and arrive at accurate insights with exceedingly informative research discoveries. The data provided by our organization have proven precious to a diverse range of companies, facilitating them to address issues such as determining which products/services are the most appealing, whether or not customers use the product in the manner anticipated, the purchasing intentions of the market and many others.
Our research methodology encompasses an idyllic combination of primary and secondary initiatives. Key phases involved in this process are listed below:

The phase involves the gathering and collecting of market data and its related information with the help of different sources & research procedures.

The data procurement stage involves in data gathering and collecting through various data sources.
This stage involves in extensive research. These data sources includes:
Purchased Database: Purchased databases play a crucial role in estimating the market sizes irrespective of the domain. Our purchased database includes:
Primary Research: The Brainy Insights interacts with leading companies and experts of the concerned domain to develop the analyst team’s market understanding and expertise. It improves and substantiates every single data presented in the market reports. Primary research mainly involves in telephonic interviews, E-mail interactions and face-to-face interviews with the raw material providers, manufacturers/producers, distributors, & independent consultants. The interviews that we conduct provides valuable data on market size and industry growth trends prevailing in the market. Our organization also conducts surveys with the various industry experts in order to gain overall insights of the industry/market. For instance, in healthcare industry we conduct surveys with the pharmacists, doctors, surgeons and nurses in order to gain insights and key information of a medical product/device/equipment which the customers are going to usage. Surveys are conducted in the form of questionnaire designed by our own analyst team. Surveys plays an important role in primary research because surveys helps us to identify the key target audiences of the market. Additionally, surveys helps to identify the key target audience engaged with the market. Our survey team conducts the survey by targeting the key audience, thus gaining insights from them. Based on the perspectives of the customers, this information is utilized to formulate market strategies. Moreover, market surveys helps us to understand the current competitive situation of the industry. To be precise, our survey process typically involve with the 360 analysis of the market. This analytical process begins by identifying the prospective customers for a product or service related to the market/industry to obtain data on how a product/service could fit into customers’ lives.

Secondary Research: The secondary data sources includes information published by the on-profit organizations such as World bank, WHO, company fillings, investor presentations, annual reports, national government documents, statistical databases, blogs, articles, white papers and others. From the annual report, we analyse a company’s revenue to understand the key segment and market share of that organization in a particular region. We analyse the company websites and adopt the product mapping technique which is important for deriving the segment revenue. In the product mapping method, we select and categorize the products offered by the companies catering to domain specific market, deduce the product revenue for each of the companies so as to get overall estimation of the market size. We also source data and analyses trends based on information received from supply side and demand side intermediaries in the value chain. The supply side denotes the data gathered from supplier, distributor, wholesaler and the demand side illustrates the data gathered from the end customers for respective market domain.

The supply side for a domain specific market is analysed by:
The demand side for the market is estimated through:
In-house Library: Apart from these third-party sources, we have our in-house library of qualitative and quantitative information. Our in-house database includes market data for various industry and domains. These data are updated on regular basis as per the changing market scenario. Our library includes, historic databases, internal audit reports and archives.
Sometimes there are instances where there is no metadata or raw data available for any domain specific market. For those cases, we use our expertise to forecast and estimate the market size in order to generate comprehensive data sets. Our analyst team adopt a robust research technique in order to produce the estimates:
Data Synthesis: This stage involves the analysis & mapping of all the information obtained from the previous step. It also involves in scrutinizing the data for any discrepancy observed while data gathering related to the market. The data is collected with consideration to the heterogeneity of sources. Robust scientific techniques are in place for synthesizing disparate data sets and provide the essential contextual information that can orient market strategies. The Brainy Insights has extensive experience in data synthesis where the data passes through various stages:


Market Deduction & Formulation: The final stage comprises of assigning data points at appropriate market spaces so as to deduce feasible conclusions. Analyst perspective & subject matter expert based holistic form of market sizing coupled with industry analysis also plays a crucial role in this stage.
This stage involves in finalization of the market size and numbers that we have collected from data integration step. With data interpolation, it is made sure that there is no gap in the market data. Successful trend analysis is done by our analysts using extrapolation techniques, which provide the best possible forecasts for the market.
Data Validation & Market Feedback: Validation is the most important step in the process. Validation & re-validation via an intricately designed process helps us finalize data-points to be used for final calculations.

The Brainy Insights interacts with leading companies and experts of the concerned domain to develop the analyst team’s market understanding and expertise. It improves and substantiates every single data presented in the market reports. The data validation interview and discussion panels are typically composed of the most experienced industry members. The participants include, however, are not limited to:
Moreover, we always validate our data and findings through primary respondents from all the major regions we are working on.


Free Customization
Fortune 500 Clients
Free Yearly Update On Purchase Of Multi/Corporate License
Companies Served Till Date