- +1-315-215-1633
- sales@thebrainyinsights.com

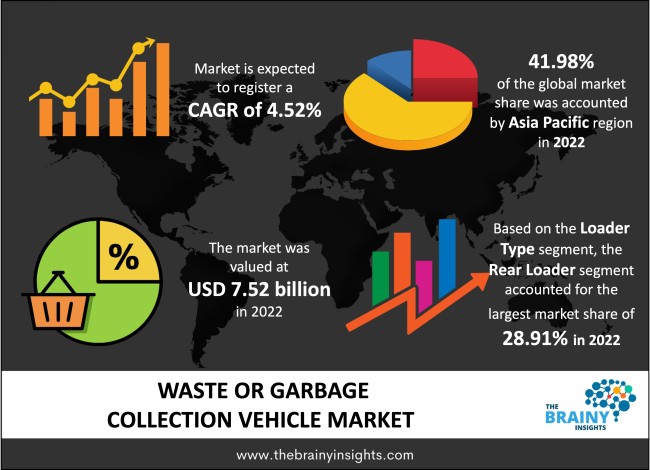
The global waste or garbage collection vehicle market was valued at USD 7.52 Billion in 2022 and grew at a CAGR of 4.52% from 2023 to 2032. The market is expected to reach USD 11.70 Billion by 2032. The growth of the waste or garbage collection vehicle market can be attributed to the rise in population growth in urban areas. Further, the increasing amount of municipal waste has necessitated the requirement of a waste or garbage collection vehicle.
Waste or garbage collection vehicles are used to transport municipal waste to landfills or other locations for waste management and treatment. A garbage truck is a vehicle created specifically to convey municipal solid waste to a facility for its treatment, such as a recycling facility, landfill, or transfer station. Due to this, separate garbage collection systems are being implemented in an increasing number of metropolitan settings, along with the aid of low-impact vehicles. Also, many manufacturers have introduced electric vehicles for garbage collection in situations where waste needs to be collected continuously and efficiently without making noise or polluting the environment.
Get an overview of this study by requesting a free sample
An increasing amount of municipal waste: The amount of municipal solid waste produced is anticipated to rise to 165 million tonnes by 2031 and to 436 million tonnes by 2025. Even though more waste is being produced, global waste collection efficiency is still catching up. In large metro areas, it ranges from 70 to 90%, whereas in many smaller communities, it is less than 50%. Sewage sludge is an unavoidable result of wastewater treatment procedures. Every year, the amount of sewage sludge produced grows in tandem with the growth of industry and agriculture. When income levels fluctuate incrementally, waste creation declines at the lowest income levels and rises more quickly there than at higher income levels. By 2050, it is anticipated that the overall amount of waste produced in low-income nations will have increased by more than three times.
Low investment in under-developed regions: Municipal waste management has long been a problem in sparsely populated rural areas where collection vehicles are prohibitively expensive and in fast-increasing cities where infrastructure construction has lagged behind population and housing development. Some countries in developing regions, most in under-developed regions, invest little in municipal waste treatment. These countries are still facing investment funds due to low per capita income, which leads to lower or negligible demand for the product.
A growing number of smart city initiatives: Worldwide, many people are moving into urban areas, especially in the United States, which is driving up demand for a rapid state of urbanization. An increasing number of cities will lead to a rise in population in the coming decades. Two-thirds of the world's energy, as well as the great majority of other resources, are being used by cities. In many parts of the world, municipal garbage collection vehicles are used in smart city programs. Therefore, smart cities are increasingly deploying these vehicles to increase the amount of waste collected daily. The growing number of investments enables efficient wet and dry waste management. If the localities are kept clean and well-maintained daily, the number of contagious diseases will eventually decrease.
The regions analyzed for the market include North America, Europe, South America, Asia Pacific, the Middle East, and Africa. Asia Pacific emerged as the most significant waste or garbage collection vehicle market, with a 41.98% market revenue share in 2022.
Asia Pacific region will account for the largest market share with revenue growth. The increasing industrialization in countries such as China, India, Japan, etc., has led to a high growth rate. Also, an increasing number of manufacturers are shifting their base to China due to the availability of components. The sales of heavy-duty and medium-duty vehicles are considerably high in the regional countries.
Asia Pacific region Waste or Garbage Collection Vehicle Market Share in 2022 - 41.98%
www.thebrainyinsights.com
Check the geographical analysis of this market by requesting a free sample
The loader type segment is divided into front loaders, automated side loaders [ASL], rear loaders, grapple trucks and pneumatic collection. The rear loaders segment dominated the market, with a share of around 28.91% in 2022. The workhorses for garbage collection in big cities and small communities are rear-load garbage trucks. Their rear loaders' renowned dependability and longevity ensure efficiency, whether the route is commercial or residential.
The vehicle type segment is divided into light-duty vehicles, heavy-duty vehicles, and medium-duty vehicles. The medium-duty vehicle segment dominated the market, with a share of around 39.73% in 2022. Medium-duty vehicles are efficiently used in most towns for the collection of both wet and dry wastes.
The application segment is divided into urban garbage treatment, industry, building, and mining. The urban garbage treatment segment dominated the market, with a share of around 36.19% in 2022. There is a drastic increase in urbanization across developing regions, fuelling the growth of waste or garbage collection vehicles. Many service providers are investing in garbage pickup vehicles to increase capacity utilization.
| Attribute | Description |
|---|---|
| Market Size | Revenue (USD Billion) |
| Market size value in 2022 | USD 7.52 Billion |
| Market size value in 2032 | USD 11.70 Billion |
| CAGR (2023 to 2032) | 4.52% |
| Historical data | 2019-2021 |
| Base Year | 2022 |
| Forecast | 2023-2032 |
| Region | The regions analyzed for the market are Asia Pacific, Europe, South America, North America, and Middle East & Africa. Furthermore, the regions are further analyzed at the country level. |
| Segments | Loader Type, Vehicle Type and Application |
As per The Brainy Insights, the size of the waste or garbage collection vehicle market was valued 7.52 billion in 2022 to USD 11.70 Billion by 2032.
Global waste or garbage collection vehicle market is growing at a CAGR of 4.52% during the forecast period 2023-2032.
Asia Pacific region emerged as the largest market for the waste or garbage collection vehicle.
The market's growth will be influenced by the growing amount of municipal waste.
The high cost of vehicle can hamper the market growth.
The increasing investment in smart city initiative is providing huge opportunities to the market.
1. Introduction
1.1. Objectives of the Study
1.2. Market Definition
1.3. Research Scope
1.4. Currency
1.5. Key Target Audience
2. Research Methodology and Assumptions
3. Executive Summary
4. Premium Insights
4.1. Porter’s Five Forces Analysis
4.2. Value Chain Analysis
4.3. Top Investment Pockets
4.3.1. Market Attractiveness Analysis By Loader Type
4.3.2. Market Attractiveness Analysis By Vehicle Type
4.3.3. Market Attractiveness Analysis By Application
4.3.4. Market Attractiveness Analysis By Region
4.4. Industry Trends
5. Market Dynamics
5.1. Market Evaluation
5.2. Drivers
5.2.1. Increasing generation of municipal wastage
5.3. Restraints
5.3.1. High cost of vehicles
5.4. Opportunities
5.4.1. Increasing growth of electric vehicles
5.5. Challenges
5.5.1. Low awareness
6. Global Waste or Garbage Collection Vehicle Market Analysis and Forecast, By Loader Type
6.1. Segment Overview
6.2. Front Loaders
6.3. Automated Side Loaders [ASL]
6.4. Rear Loaders
6.5. Grapple Trucks
6.6. Pneumatic Collection
7. Global Waste or Garbage Collection Vehicle Market Analysis and Forecast, By Vehicle Type
7.1. Segment Overview
7.2. Light Duty Vehicle
7.3. Heavy Duty Vehicle
7.4. Medium Duty Vehicle
8. Global Waste or Garbage Collection Vehicle Market Analysis and Forecast, By Application
8.1. Segment Overview
8.2. Urban Garbage Treatment
8.3. Industry
8.4. Building
8.5. Mining
9. Global Waste or Garbage Collection Vehicle Market Analysis and Forecast, By Regional Analysis
9.1. Segment Overview
9.2. North America
9.2.1. U.S.
9.2.2. Canada
9.2.3. Mexico
9.3. Europe
9.3.1. Germany
9.3.2. France
9.3.3. U.K.
9.3.4. Italy
9.3.5. Spain
9.4. Asia-Pacific
9.4.1. Japan
9.4.2. China
9.4.3. India
9.5. South America
9.5.1. Brazil
9.6. Middle East and Africa
9.6.1. UAE
9.6.2. South Africa
10. Global Waste or Garbage Collection Vehicle Market-Competitive Landscape
10.1. Overview
10.2. Market Share of Key Players in the Waste or Garbage Collection Vehicle Market
10.2.1. Global Company Market Share
10.2.2. North America Company Market Share
10.2.3. Europe Company Market Share
10.2.4. APAC Company Market Share
10.3. Competitive Situations and Trends
10.3.1. Product Launches and Developments
10.3.2. Partnerships, Collaborations, and Agreements
10.3.3. Mergers & Acquisitions
10.3.4. Expansions
11. Company Profiles
11.1. AUTOCAR, LLC.
11.1.1. Business Overview
11.1.2. Company Snapshot
11.1.3. Company Market Share Analysis
11.1.4. Company Product Portfolio
11.1.5. Recent Developments
11.1.6. SWOT Analysis
11.2. EOW INTERNATIONAL COLLABORATION & MANUFACTURING LLC
11.2.1. Business Overview
11.2.2. Company Snapshot
11.2.3. Company Market Share Analysis
11.2.4. Company Product Portfolio
11.2.5. Recent Developments
11.2.6. SWOT Analysis
11.3. AMS Sp
11.3.1. Business Overview
11.3.2. Company Snapshot
11.3.3. Company Market Share Analysis
11.3.4. Company Product Portfolio
11.3.5. Recent Developments
11.3.6. SWOT Analysis
11.4. GEP ECOTECH CO., LTD.
11.4.1. Business Overview
11.4.2. Company Snapshot
11.4.3. Company Market Share Analysis
11.4.4. Company Product Portfolio
11.4.5. Recent Developments
11.4.6. SWOT Analysis
11.5. AB NARPES TRA & METALL – NTM
11.5.1. Business Overview
11.5.2. Company Snapshot
11.5.3. Company Market Share Analysis
11.5.4. Company Product Portfolio
11.5.5. Recent Developments
11.5.6. SWOT Analysis
11.6. EcoZeta S.r.l.
11.6.1. Business Overview
11.6.2. Company Snapshot
11.6.3. Company Market Share Analysis
11.6.4. Company Product Portfolio
11.6.5. Recent Developments
11.6.6. SWOT Analysis
11.7. FAUN Umwelttechnik GmbH & Co. KG
1.1.1. Business Overview
1.1.2. Company Snapshot
1.1.3. Company Market Share Analysis
1.1.4. Company Product Portfolio
1.1.5. Recent Developments
1.1.6. SWOT Analysis
11.8. Mecagil-Lebon
11.8.1. Business Overview
11.8.2. Company Snapshot
11.8.3. Company Market Share Analysis
11.8.4. Company Product Portfolio
11.8.5. Recent Developments
11.8.6. SWOT Analysis
11.9. Environmental Solutions Group
11.9.1. Business Overview
11.9.2. Company Snapshot
11.9.3. Company Market Share Analysis
11.9.4. Company Product Portfolio
11.9.5. Recent Developments
11.9.6. SWOT Analysis
11.10. Fratelli Mazzocchia Spa
11.10.1. Business Overview
11.10.2. Company Snapshot
11.10.3. Company Market Share Analysis
11.10.4. Company Product Portfolio
11.10.5. Recent Developments
11.10.6. SWOT Analysis
11.11. Hidro-Mak
11.11.1. Business Overview
11.11.2. Company Snapshot
11.11.3. Company Market Share Analysis
11.11.4. Company Product Portfolio
11.11.5. Recent Developments
11.11.6. SWOT Analysis
11.12. MS DORSE
11.12.1. Business Overview
11.12.2. Company Snapshot
11.12.3. Company Market Share Analysis
11.12.4. Company Product Portfolio
11.12.5. Recent Developments
11.12.6. SWOT Analysis
11.13. TERBERG ROSROCA GROUP
11.13.1. Business Overview
11.13.2. Company Snapshot
11.13.3. Company Market Share Analysis
11.13.4. Company Product Portfolio
11.13.5. Recent Developments
11.13.6. SWOT Analysis
11.14. Shandong Wuzheng Group Co., Ltd.
11.14.1. Business Overview
11.14.2. Company Snapshot
11.14.3. Company Market Share Analysis
11.14.4. Company Product Portfolio
11.14.5. Recent Developments
11.14.6. SWOT Analysis
11.15. Nord Engineering s.r.l.
11.15.1. Business Overview
11.15.2. Company Snapshot
11.15.3. Company Market Share Analysis
11.15.4. Company Product Portfolio
11.15.5. Recent Developments
11.15.6. SWOT Analysis
List of Table
1. Global Waste or Garbage Collection Vehicle Market, By Loader Type, 2019-2032 (USD Billion)
2. Global Front Loaders, Waste or Garbage Collection Vehicle Market, By Region, 2019-2032 (USD Billion)
3. Global Automated Side Loaders [ASL], Waste or Garbage Collection Vehicle Market, By Region, 2019-2032 (USD Billion)
4. Global Rear Loaders, Waste or Garbage Collection Vehicle Market, By Region, 2019-2032 (USD Billion)
5. Global Grapple Trucks, Waste or Garbage Collection Vehicle Market, By Region, 2019-2032 (USD Billion)
6. Global Pneumatic Collection, Waste or Garbage Collection Vehicle Market, By Region, 2019-2032 (USD Billion)
7. Global Waste or Garbage Collection Vehicle Market, By Vehicle Type, 2019-2032 (USD Billion)
8. Global Light Duty Vehicle, Waste or Garbage Collection Vehicle Market, By Region, 2019-2032 (USD Billion)
9. Global Heavy Duty Vehicle, Waste or Garbage Collection Vehicle Market, By Region, 2019-2032 (USD Billion)
10. Global Medium Duty Vehicle, Waste or Garbage Collection Vehicle Market, By Region, 2019-2032 (USD Billion)
11. Global Waste or Garbage Collection Vehicle Market, By Application, 2019-2032 (USD Billion)
12. Global Urban Garbage Treatment, Waste or Garbage Collection Vehicle Market, By Region, 2019-2032 (USD Billion)
13. Global Industry, Waste or Garbage Collection Vehicle Market, By Region, 2019-2032 (USD Billion)
14. Global Building, Waste or Garbage Collection Vehicle Market, By Region, 2019-2032 (USD Billion)
15. Global Mining, Waste or Garbage Collection Vehicle Market, By Region, 2019-2032 (USD Billion)
16. Global Waste or Garbage Collection Vehicle Market, By Region, 2019-2032 (USD Billion)
17. North America Waste or Garbage Collection Vehicle Market, By Loader Type, 2019-2032 (USD Billion)
18. North America Waste or Garbage Collection Vehicle Market, By Vehicle Type, 2019-2032 (USD Billion)
19. North America Waste or Garbage Collection Vehicle Market, By Application, 2019-2032 (USD Billion)
20. U.S. Waste or Garbage Collection Vehicle Market, By Loader Type, 2019-2032 (USD Billion)
21. U.S. Waste or Garbage Collection Vehicle Market, By Vehicle Type, 2019-2032 (USD Billion)
22. U.S. Waste or Garbage Collection Vehicle Market, By Application, 2019-2032 (USD Billion)
23. Canada Waste or Garbage Collection Vehicle Market, By Loader Type, 2019-2032 (USD Billion)
24. Canada Waste or Garbage Collection Vehicle Market, By Vehicle Type, 2019-2032 (USD Billion)
25. Canada Waste or Garbage Collection Vehicle Market, By Application, 2019-2032 (USD Billion)
26. Mexico Waste or Garbage Collection Vehicle Market, By Loader Type, 2019-2032 (USD Billion)
27. Mexico Waste or Garbage Collection Vehicle Market, By Vehicle Type, 2019-2032 (USD Billion)
28. Mexico Waste or Garbage Collection Vehicle Market, By Application, 2019-2032 (USD Billion)
29. Europe Waste or Garbage Collection Vehicle Market, By Loader Type, 2019-2032 (USD Billion)
30. Europe Waste or Garbage Collection Vehicle Market, By Vehicle Type, 2019-2032 (USD Billion)
31. Europe Waste or Garbage Collection Vehicle Market, By Application, 2019-2032 (USD Billion)
32. Germany Waste or Garbage Collection Vehicle Market, By Loader Type, 2019-2032 (USD Billion)
33. Germany Waste or Garbage Collection Vehicle Market, By Vehicle Type, 2019-2032 (USD Billion)
34. Germany Waste or Garbage Collection Vehicle Market, By Application, 2019-2032 (USD Billion)
35. France Waste or Garbage Collection Vehicle Market, By Loader Type, 2019-2032 (USD Billion)
36. France Waste or Garbage Collection Vehicle Market, By Vehicle Type, 2019-2032 (USD Billion)
37. France Waste or Garbage Collection Vehicle Market, By Application, 2019-2032 (USD Billion)
38. U.K. Waste or Garbage Collection Vehicle Market, By Loader Type, 2019-2032 (USD Billion)
39. U.K. Waste or Garbage Collection Vehicle Market, By Vehicle Type, 2019-2032 (USD Billion)
40. U.K. Waste or Garbage Collection Vehicle Market, By Application, 2019-2032 (USD Billion)
41. Italy Waste or Garbage Collection Vehicle Market, By Loader Type, 2019-2032 (USD Billion)
42. Italy Waste or Garbage Collection Vehicle Market, By Vehicle Type, 2019-2032 (USD Billion)
43. Italy Waste or Garbage Collection Vehicle Market, By Application, 2019-2032 (USD Billion)
44. Spain Waste or Garbage Collection Vehicle Market, By Loader Type, 2019-2032 (USD Billion)
45. Spain Waste or Garbage Collection Vehicle Market, By Vehicle Type, 2019-2032 (USD Billion)
46. Spain Waste or Garbage Collection Vehicle Market, By Application, 2019-2032 (USD Billion)
47. Asia Pacific Waste or Garbage Collection Vehicle Market, By Loader Type, 2019-2032 (USD Billion)
48. Asia Pacific Waste or Garbage Collection Vehicle Market, By Vehicle Type, 2019-2032 (USD Billion)
49. Asia Pacific Waste or Garbage Collection Vehicle Market, By Application, 2019-2032 (USD Billion)
50. Japan Waste or Garbage Collection Vehicle Market, By Loader Type, 2019-2032 (USD Billion)
51. Japan Waste or Garbage Collection Vehicle Market, By Vehicle Type, 2019-2032 (USD Billion)
52. Japan Waste or Garbage Collection Vehicle Market, By Application, 2019-2032 (USD Billion)
53. China Waste or Garbage Collection Vehicle Market, By Loader Type, 2019-2032 (USD Billion)
54. China Waste or Garbage Collection Vehicle Market, By Vehicle Type, 2019-2032 (USD Billion)
55. China Waste or Garbage Collection Vehicle Market, By Application, 2019-2032 (USD Billion)
56. India Waste or Garbage Collection Vehicle Market, By Loader Type, 2019-2032 (USD Billion)
57. India Waste or Garbage Collection Vehicle Market, By Vehicle Type, 2019-2032 (USD Billion)
58. India Waste or Garbage Collection Vehicle Market, By Application, 2019-2032 (USD Billion)
59. South America Waste or Garbage Collection Vehicle Market, By Loader Type, 2019-2032 (USD Billion)
60. South America Waste or Garbage Collection Vehicle Market, By Vehicle Type, 2019-2032 (USD Billion)
61. South America Waste or Garbage Collection Vehicle Market, By Application, 2019-2032 (USD Billion)
62. Brazil Waste or Garbage Collection Vehicle Market, By Loader Type, 2019-2032 (USD Billion)
63. Brazil Waste or Garbage Collection Vehicle Market, By Vehicle Type, 2019-2032 (USD Billion)
64. Brazil Waste or Garbage Collection Vehicle Market, By Application, 2019-2032 (USD Billion)
65. Middle East and Africa Waste or Garbage Collection Vehicle Market, By Loader Type, 2019-2032 (USD Billion)
66. Middle East and Africa Waste or Garbage Collection Vehicle Market, By Vehicle Type, 2019-2032 (USD Billion)
67. Middle East and Africa Waste or Garbage Collection Vehicle Market, By Application, 2019-2032 (USD Billion)
68. UAE Waste or Garbage Collection Vehicle Market, By Loader Type, 2019-2032 (USD Billion)
69. UAE Waste or Garbage Collection Vehicle Market, By Vehicle Type, 2019-2032 (USD Billion)
70. UAE Waste or Garbage Collection Vehicle Market, By Application, 2019-2032 (USD Billion)
71. South Africa Waste or Garbage Collection Vehicle Market, By Loader Type, 2019-2032 (USD Billion)
72. South Africa Waste or Garbage Collection Vehicle Market, By Vehicle Type, 2019-2032 (USD Billion)
73. South Africa Waste or Garbage Collection Vehicle Market, By Application, 2019-2032 (USD Billion)
List of Figures
1. Global Waste or Garbage Collection Vehicle Market Segmentation
2. Waste or Garbage Collection Vehicle Market: Research Methodology
3. Market Size Estimation Methodology: Bottom-Up Approach
4. Market Size Estimation Methodology: Top-Down Approach
5. Data Triangulation
6. Porter’s Five Forces Analysis
7. Value Chain Analysis
8. Global Waste or Garbage Collection Vehicle Market Attractiveness Analysis By Loader Type
9. Global Waste or Garbage Collection Vehicle Market Attractiveness Analysis By Vehicle Type
10. Global Waste or Garbage Collection Vehicle Market Attractiveness Analysis By Application
11. Global Waste or Garbage Collection Vehicle Market Attractiveness Analysis By Region
12. Global Waste or Garbage Collection Vehicle Market: Dynamics
13. Global Waste or Garbage Collection Vehicle Market Share By Loader Type (2022 & 2032)
14. Global Waste or Garbage Collection Vehicle Market Share by Vehicle Type (2022 & 2032)
15. Global Waste or Garbage Collection Vehicle Market Share by Application (2022 & 2032)
16. Global Waste or Garbage Collection Vehicle Market Share by Regions (2022 & 2032)
17. Global Waste or Garbage Collection Vehicle Market Share by Company (2022)
This study forecasts revenue at global, regional, and country levels from 2023 to 2032. The Brainy Insights has segmented the global waste or garbage collection vehicle market based on below mentioned segments:
Global Waste or Garbage Collection Vehicle Market by Loader Type:
Global Waste or Garbage Collection Vehicle Market by Vehicle Type:
Global Waste or Garbage Collection Vehicle Market by Application:
Global Waste or Garbage Collection Vehicle Market by Region:
Research has its special purpose to undertake marketing efficiently. In this competitive scenario, businesses need information across all industry verticals; the information about customer wants, market demand, competition, industry trends, distribution channels etc. This information needs to be updated regularly because businesses operate in a dynamic environment. Our organization, The Brainy Insights incorporates scientific and systematic research procedures in order to get proper market insights and industry analysis for overall business success. The analysis consists of studying the market from a miniscule level wherein we implement statistical tools which helps us in examining the data with accuracy and precision.
Our research reports feature both; quantitative and qualitative aspects for any market. Qualitative information for any market research process are fundamental because they reveal the customer needs and wants, usage and consumption for any product/service related to a specific industry. This in turn aids the marketers/investors in knowing certain perceptions of the customers. Qualitative research can enlighten about the different product concepts and designs along with unique service offering that in turn, helps define marketing problems and generate opportunities. On the other hand, quantitative research engages with the data collection process through interviews, e-mail interactions, surveys and pilot studies. Quantitative aspects for the market research are useful to validate the hypotheses generated during qualitative research method, explore empirical patterns in the data with the help of statistical tools, and finally make the market estimations.
The Brainy Insights offers comprehensive research and analysis, based on a wide assortment of factual insights gained through interviews with CXOs and global experts and secondary data from reliable sources. Our analysts and industry specialist assume vital roles in building up statistical tools and analysis models, which are used to analyse the data and arrive at accurate insights with exceedingly informative research discoveries. The data provided by our organization have proven precious to a diverse range of companies, facilitating them to address issues such as determining which products/services are the most appealing, whether or not customers use the product in the manner anticipated, the purchasing intentions of the market and many others.
Our research methodology encompasses an idyllic combination of primary and secondary initiatives. Key phases involved in this process are listed below:

The phase involves the gathering and collecting of market data and its related information with the help of different sources & research procedures.

The data procurement stage involves in data gathering and collecting through various data sources.
This stage involves in extensive research. These data sources includes:
Purchased Database: Purchased databases play a crucial role in estimating the market sizes irrespective of the domain. Our purchased database includes:
Primary Research: The Brainy Insights interacts with leading companies and experts of the concerned domain to develop the analyst team’s market understanding and expertise. It improves and substantiates every single data presented in the market reports. Primary research mainly involves in telephonic interviews, E-mail interactions and face-to-face interviews with the raw material providers, manufacturers/producers, distributors, & independent consultants. The interviews that we conduct provides valuable data on market size and industry growth trends prevailing in the market. Our organization also conducts surveys with the various industry experts in order to gain overall insights of the industry/market. For instance, in healthcare industry we conduct surveys with the pharmacists, doctors, surgeons and nurses in order to gain insights and key information of a medical product/device/equipment which the customers are going to usage. Surveys are conducted in the form of questionnaire designed by our own analyst team. Surveys plays an important role in primary research because surveys helps us to identify the key target audiences of the market. Additionally, surveys helps to identify the key target audience engaged with the market. Our survey team conducts the survey by targeting the key audience, thus gaining insights from them. Based on the perspectives of the customers, this information is utilized to formulate market strategies. Moreover, market surveys helps us to understand the current competitive situation of the industry. To be precise, our survey process typically involve with the 360 analysis of the market. This analytical process begins by identifying the prospective customers for a product or service related to the market/industry to obtain data on how a product/service could fit into customers’ lives.

Secondary Research: The secondary data sources includes information published by the on-profit organizations such as World bank, WHO, company fillings, investor presentations, annual reports, national government documents, statistical databases, blogs, articles, white papers and others. From the annual report, we analyse a company’s revenue to understand the key segment and market share of that organization in a particular region. We analyse the company websites and adopt the product mapping technique which is important for deriving the segment revenue. In the product mapping method, we select and categorize the products offered by the companies catering to domain specific market, deduce the product revenue for each of the companies so as to get overall estimation of the market size. We also source data and analyses trends based on information received from supply side and demand side intermediaries in the value chain. The supply side denotes the data gathered from supplier, distributor, wholesaler and the demand side illustrates the data gathered from the end customers for respective market domain.

The supply side for a domain specific market is analysed by:
The demand side for the market is estimated through:
In-house Library: Apart from these third-party sources, we have our in-house library of qualitative and quantitative information. Our in-house database includes market data for various industry and domains. These data are updated on regular basis as per the changing market scenario. Our library includes, historic databases, internal audit reports and archives.
Sometimes there are instances where there is no metadata or raw data available for any domain specific market. For those cases, we use our expertise to forecast and estimate the market size in order to generate comprehensive data sets. Our analyst team adopt a robust research technique in order to produce the estimates:
Data Synthesis: This stage involves the analysis & mapping of all the information obtained from the previous step. It also involves in scrutinizing the data for any discrepancy observed while data gathering related to the market. The data is collected with consideration to the heterogeneity of sources. Robust scientific techniques are in place for synthesizing disparate data sets and provide the essential contextual information that can orient market strategies. The Brainy Insights has extensive experience in data synthesis where the data passes through various stages:


Market Deduction & Formulation: The final stage comprises of assigning data points at appropriate market spaces so as to deduce feasible conclusions. Analyst perspective & subject matter expert based holistic form of market sizing coupled with industry analysis also plays a crucial role in this stage.
This stage involves in finalization of the market size and numbers that we have collected from data integration step. With data interpolation, it is made sure that there is no gap in the market data. Successful trend analysis is done by our analysts using extrapolation techniques, which provide the best possible forecasts for the market.
Data Validation & Market Feedback: Validation is the most important step in the process. Validation & re-validation via an intricately designed process helps us finalize data-points to be used for final calculations.

The Brainy Insights interacts with leading companies and experts of the concerned domain to develop the analyst team’s market understanding and expertise. It improves and substantiates every single data presented in the market reports. The data validation interview and discussion panels are typically composed of the most experienced industry members. The participants include, however, are not limited to:
Moreover, we always validate our data and findings through primary respondents from all the major regions we are working on.


Free Customization
Fortune 500 Clients
Free Yearly Update On Purchase Of Multi/Corporate License
Companies Served Till Date