- +1-315-215-1633
- sales@thebrainyinsights.com

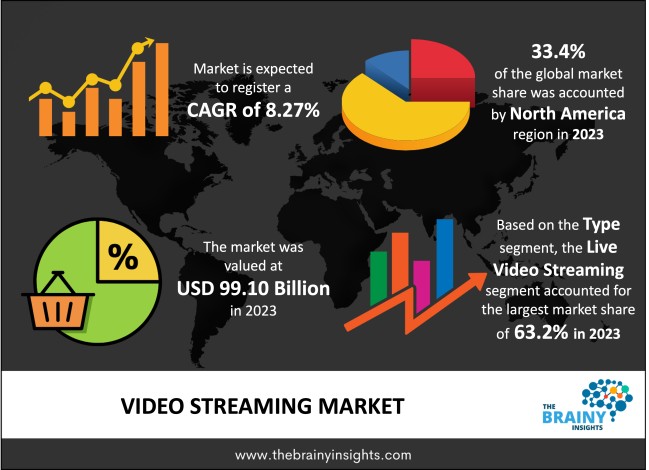
The global video streaming market revenue was valued at USD 99.1 billion in 2023 and is anticipated to grow at a CAGR of 8.27% from 2024 to 2033. The market is expected to reach USD 219.36 billion by 2033. Innovations like Artificial Intelligence (AI) and blockchain are being harnessed to enhance the quality of videos. Artificial Intelligence, in particular, is becoming indispensable in various facets of video production and uploading, encompassing editing, cinematography, voice-overs, scriptwriting, and more. These innovations are expected to exert a favourable impact on market growth. Furthermore, the expansion of the market is foreseen to be driven by the rapid adoption of mobile phones, fueled by the increasing prevalence of social media platforms and other digital channels utilized for branding and marketing purposes.
Video streaming refers to transmitting video content over the internet in real-time, allowing users to watch videos without downloading them to their devices. It involves the continuous delivery of video data from a server to a user's device, where the video is played almost immediately as it is received, providing a seamless and on-demand viewing experience. Video streaming has become increasingly popular due to its convenience and versatility. It enables users to access various video content, including movies, TV shows, live events, educational content, and more, on various devices such as smartphones, tablets, computers, and smart TVs. Video streaming services often use adaptive techniques to modify the video quality based on the viewer's internet connection, ensuring a smooth playback experience even on slower connections. Leading companies in the video streaming industry include Netflix, Amazon Prime Video, YouTube, Hulu, and Disney+, among others. These platforms offer extensive content libraries and have revolutionized how people consume video entertainment in the digital age.
Get an overview of this study by requesting a free sample
Increased Internet Penetration - The proliferation of high-speed internet access, especially in urban and suburban areas, has made it easier for consumers to access and stream video content online. Due to this, there is a surge in the number of streaming subscribers.
Increasing users of Smartphones and Mobile Devices - The growing usage of smartphones has allowed users to stream video content on the go. Mobile apps from streaming providers have made it convenient for users to access content anytime, anywhere.
Original Content Production - Streaming platforms have invested heavily in producing original content. Hits like Netflix's "Stranger Things" and Amazon Prime's "The Marvelous Mrs. Maisel" have attracted subscribers and garnered critical acclaim. Exclusive content is a significant driver of subscriber growth.
Content Licensing Costs - Acquiring and licensing content, especially high-demand or exclusive content, can be extremely expensive. Streaming platforms must constantly invest in content to remain competitive, which can strain their financial resources.
Net Neutrality and Bandwidth Issues - Net neutrality regulations and bandwidth limitations imposed by internet service providers (ISPs) can impact the quality and accessibility of streaming services. Users may experience buffering or reduced video quality due to throttling by ISPs.
Live Streaming - Expanding live streaming capabilities to cover a broader range of events, including sports, concerts, and e-sports, can attract a wider audience and advertising revenue.
Hybrid Business Models - Exploring hybrid models that combine advertising-supported free tiers with premium subscription options can help streaming platforms tap into different market segments.
Content Piracy - Illegally streamed or downloaded content continues to be a significant challenge, leading to lost revenue and undermining the business models of legitimate streaming services.
Competition and Fragmentation - The increasing number of streaming services has led to a fragmented market, making it challenging for consumers to decide which services to subscribe to and potentially causing subscription fatigue.
The regions analyzed for the market include North America, Europe, South America, Asia Pacific, the Middle East, and Africa. The North American region emerged as the most prominent global Video Streaming market, with a 33.4% market revenue share in 2023.
North America boasts a highly developed technological infrastructure, including widespread access to high-speed broadband internet. This infrastructure has enabled seamless video streaming, which is essential for the success of streaming services. The region has also witnessed widespread adoption of mobile devices, tablets, smart TVs, and other connected devices. This factor has provided consumers various options to access streaming content, making it more convenient and accessible. Furthermore, North America is a hub for content production, with major film studios, production companies, and content creators headquartered in the region. Streaming services in North America have secured exclusive content deals and produced high-quality original content, attracting a global audience. The Asia Pacific region is anticipated to notice the highest growth rate through the forecast years. The Asia Pacific region has an extensive and diverse population, including densely populated countries like India and China. This large and varied demographic represents a massive potential user base for video streaming services.
North America Region Video Streaming Market Share in 2023 - 33.4%
www.thebrainyinsights.com
Check the geographical analysis of this market by requesting a free sample
The type segment is split into live video streaming and non-linear video streaming. The live video streaming segment accounted for the largest market share of 63.2% in 2023. Live video streaming allows for real-time interaction between content creators and viewers. This immediate engagement creates a sense of urgency and excitement, making it a preferred choice for events, news, and live entertainment. Major events such as sports, concerts, gaming tournaments, and news broadcasts are ideally suited for live streaming. Viewers are drawn to live coverage to witness events as they happen. Besides, streaming platforms often secure exclusive rights to live events, attracting subscribers interested in watching these events live. Exclusive live content can differentiate a streaming service from competitors.
The deployment segment includes cloud, on-premises and hybrid. The cloud segment dominated the market, with a share of 62.1% in 2023. Cloud-based video streaming platforms can easily scale their infrastructure to accommodate fluctuating viewer demands. This flexibility allows them to handle surges in viewership during peak times without significant capital investments in physical hardware. Additionally, cloud deployment eliminates the need for extensive on-premises infrastructure and maintenance costs. Streaming platforms can pay for cloud resources on a consumption basis, reducing upfront expenditures. Also, cloud-based streaming services can be deployed and accessed globally, providing a seamless experience for viewers worldwide. Content can be delivered to various geographical locations with low latency.
The solution segment is classified into internet protocol TV, over-the-top (OTT) and pay-TV. The over-the-top (OTT) segment dominated the market, with a share of 44.1% in 2023. OTT platforms offer various content genres, including movies, TV shows, documentaries, original series, and user-generated content. This diversity appeals to a broad audience with varied interests. In addition, OTT services provide on-demand access to content, eliminating the need for users to adhere to traditional TV schedules. As a result, viewers can watch their favourite shows and movies at their convenience. These platforms are accessible worldwide, allowing users to access content from different regions and cultures. This global reach attracts a diverse and international user base.
The service segment is split into consulting, managed services, and training & support. The training & support segment dominated the market, with a share of 39.3% in 2023. Training and support services are crucial in providing technical expertise to streaming platform operators. It includes training their teams in operating and maintaining video streaming infrastructure and software. These services can assist in content management, helping streaming platforms organize, catalogue, and optimize their libraries for efficient streaming. Moreover, training and support services may offer quality assurance and testing to ensure video streams are delivered without glitches, buffering, or other technical issues.
The platform segment is divided into gaming consoles, laptops & desktops, smartphones & tablets, and smart TV. The smartphones & tablets segment dominated the market, with a share of 33.6% in 2023. Smartphones and tablets deliver users suitable access to video streaming services anytime, anywhere. They allow viewers to watch content on the go or from the comfort of their own homes. Moreover, the rising usage of smartphones and tablets has significantly expanded the potential viewer base for video streaming services. People of all ages and demographics use these devices for entertainment. Some streaming platforms offer dedicated mobile apps for smartphones and tablets, enhancing the user experience with user-friendly interfaces, personalization features, and easy navigation. These factors are driving the segment's growth.
The revenue model segment includes advertising, rental and subscription. The subscription segment dominated the market, with a share of 45.2% in 2023. Subscription-based streaming services generate consistent and predictable revenue streams. Subscribers generally pay a monthly, half-yearly or annual fee, providing a stable income base for streaming platforms. Furthermore, subscription-based platforms can allocate a significant portion of their revenue toward content acquisition and original content production, attracting a wide range of viewers with high-quality content offerings. Streaming platforms also invest in exclusive content unavailable on other platforms to retain and attract subscribers. Exclusive shows and movies can become major selling points for subscription services.
The end user segment is split into enterprise and consumer. The consumer segment dominated the market, with a share of 53.1% in 2023. Consumers represent the audience that streaming platforms aim to attract. The size and engagement of the viewer base are critical for the success of streaming services. Moreover, consumers are the source of revenue for streaming platforms. Whether through subscription fees, pay-per-view models, or advertising, their viewership directly impacts the financial health of streaming services. Additionally, consumer preferences and demands shape the content libraries of streaming platforms. Platforms invest in content that resonates with their target audience to attract and retain subscribers.
| Attribute | Description |
|---|---|
| Market Size | Revenue (USD Billion) |
| Market size value in 2023 | USD 99.1 Billion |
| Market size value in 2033 | USD 219.36 Billion |
| CAGR (2024 to 2033) | 8.27% |
| Historical data | 2020-2022 |
| Base Year | 2023 |
| Forecast | 2024-2033 |
| Region | The regions analyzed for the market are Asia Pacific, Europe, South America, North America, and Middle East & Africa. Furthermore, the regions are further analyzed at the country level. |
| Segments | Type, Deployment, Solution, Service, Platform, Revenue Model, and End User |
As per The Brainy Insights, the size of the video streaming market was valued at USD 99.1 billion in 2023 to USD 219.36 billion by 2033.
The global video streaming market is growing at a CAGR of 8.27% during the forecast period 2024-2033.
The North American region became the largest market for video streaming.
Increased internet penetration and increasing users of smartphones and mobile devices are influencing the market's growth.
1. Introduction
1.1. Objectives of the Study
1.2. Market Definition
1.3. Research Scope
1.4. Currency
1.5. Key Target Audience
2. Research Methodology and Assumptions
3. Executive Summary
4. Premium Insights
4.1. Porter’s Five Forces Analysis
4.2. Value Chain Analysis
4.3. Top Investment Pockets
4.3.1. Market Attractiveness Analysis by Type
4.3.2. Market Attractiveness Analysis by Deployment
4.3.3. Market Attractiveness Analysis by Solution
4.3.4. Market Attractiveness Analysis by Service
4.3.5. Market Attractiveness Analysis by Platform
4.3.6. Market Attractiveness Analysis by Revenue Model
4.3.7. Market Attractiveness Analysis by End User
4.3.8. Market Attractiveness Analysis by Region
4.4. Industry Trends
5. Market Dynamics
5.1. Market Evaluation
5.2. Drivers
5.2.1. Increased Internet Penetration
5.2.2. Increasing users of Smartphones and Mobile Devices
5.2.3. Original Content Production
5.3. Restraints
5.3.1. Content Licensing Costs
5.3.2. Net Neutrality and Bandwidth Issues
5.4. Opportunities
5.4.1. Live Streaming
5.4.2. Hybrid Business Models
5.5. Challenges
5.5.1. Content Piracy
5.5.2. Competition and Fragmentation
6. Global Video Streaming Market Analysis and Forecast, By Type
6.1. Segment Overview
6.2. Live Video Streaming
6.3. Non-Linear Video Streaming
7. Global Video Streaming Market Analysis and Forecast, By Deployment
7.1. Segment Overview
7.2. Cloud
7.3. On-Premises
7.4. Hybrid
8. Global Video Streaming Market Analysis and Forecast, By Solution
8.1. Segment Overview
8.2. Internet Protocol TV
8.3. Over-the-Top (OTT)
8.4. Pay-TV
9. Global Video Streaming Market Analysis and Forecast, By Service
9.1. Segment Overview
9.2. Consulting
9.3. Managed Services
9.4. Training & Support
10. Global Video Streaming Market Analysis and Forecast, By Platform
10.1. Segment Overview
10.2. Gaming Consoles
10.3. Laptops & Desktops
10.4. Smartphones & Tablets
10.5. Smart TV
11. Global Video Streaming Market Analysis and Forecast, By Revenue Model
11.1. Segment Overview
11.2. Advertising
11.3. Rental
11.4. Subscription
12. Global Video Streaming Market Analysis and Forecast, By End User
12.1. Segment Overview
12.2. Enterprise
12.3. Consumer
13. Global Video Streaming Market Analysis and Forecast, By Regional Analysis
13.1. Segment Overview
13.2. North America
13.2.1. U.S.
13.2.2. Canada
13.2.3. Mexico
13.3. Europe
13.3.1. Germany
13.3.2. France
13.3.3. U.K.
13.3.4. Italy
13.3.5. Spain
13.4. Asia-Pacific
13.4.1. Japan
13.4.2. China
13.4.3. India
13.5. South America
13.5.1. Brazil
13.6. Middle East and Africa
13.6.1. UAE
13.6.2. South Africa
14. Global Video Streaming Market-Competitive Landscape
14.1. Overview
14.2. Market Share of Key Players in the Video Streaming Market
14.2.1. Global Company Market Share
14.2.2. North America Company Market Share
14.2.3. Europe Company Market Share
14.2.4. APAC Company Market Share
14.3. Competitive Situations and Trends
14.3.1. Product Launches and Developments
14.3.2. Partnerships, Collaborations, and Agreements
14.3.3. Mergers & Acquisitions
14.3.4. Expansions
15. Company Profiles
15.1. Apple Inc.
15.1.1. Business Overview
15.1.2. Company Snapshot
15.1.3. Company Market Share Analysis
15.1.4. Company Product Portfolio
15.1.5. Recent Developments
15.1.6. SWOT Analysis
15.2. Amazon Web Services, Inc.
15.2.1. Business Overview
15.2.2. Company Snapshot
15.2.3. Company Market Share Analysis
15.2.4. Company Product Portfolio
15.2.5. Recent Developments
15.2.6. SWOT Analysis
15.3. Adobe Inc.
15.3.1. Business Overview
15.3.2. Company Snapshot
15.3.3. Company Market Share Analysis
15.3.4. Company Product Portfolio
15.3.5. Recent Developments
15.3.6. SWOT Analysis
15.4. AT&T
15.4.1. Business Overview
15.4.2. Company Snapshot
15.4.3. Company Market Share Analysis
15.4.4. Company Product Portfolio
15.4.5. Recent Developments
15.4.6. SWOT Analysis
15.5. Akamai Technologies
15.5.1. Business Overview
15.5.2. Company Snapshot
15.5.3. Company Market Share Analysis
15.5.4. Company Product Portfolio
15.5.5. Recent Developments
15.5.6. SWOT Analysis
15.6. Baidu, Inc.
15.6.1. Business Overview
15.6.2. Company Snapshot
15.6.3. Company Market Share Analysis
15.6.4. Company Product Portfolio
15.6.5. Recent Developments
15.6.6. SWOT Analysis
15.7. BT
15.7.1. Business Overview
15.7.2. Company Snapshot
15.7.3. Company Market Share Analysis
15.7.4. Company Product Portfolio
15.7.5. Recent Developments
15.7.6. SWOT Analysis
15.8. Brightcove Inc.
15.8.1. Business Overview
15.8.2. Company Snapshot
15.8.3. Company Market Share Analysis
15.8.4. Company Product Portfolio
15.8.5. Recent Developments
15.8.6. SWOT Analysis
15.9. CDNetworks
15.9.1. Business Overview
15.9.2. Company Snapshot
15.9.3. Company Market Share Analysis
15.9.4. Company Product Portfolio
15.9.5. Recent Developments
15.9.6. SWOT Analysis
15.10. Crackle, Inc.
15.10.1. Business Overview
15.10.2. Company Snapshot
15.10.3. Company Market Share Analysis
15.10.4. Company Product Portfolio
15.10.5. Recent Developments
15.10.6. SWOT Analysis
15.11. Comcast Corporation
15.11.1. Business Overview
15.11.2. Company Snapshot
15.11.3. Company Market Share Analysis
15.11.4. Company Product Portfolio
15.11.5. Recent Developments
15.11.6. SWOT Analysis
15.12. Cisco Systems, Inc.
15.12.1. Business Overview
15.12.2. Company Snapshot
15.12.3. Company Market Share Analysis
15.12.4. Company Product Portfolio
15.12.5. Recent Developments
15.12.6. SWOT Analysis
15.13. Cox Communications, Inc.
15.13.1. Business Overview
15.13.2. Company Snapshot
15.13.3. Company Market Share Analysis
15.13.4. Company Product Portfolio
15.13.5. Recent Developments
15.13.6. SWOT Analysis
15.14. Deutsche Telekom AG
15.14.1. Business Overview
15.14.2. Company Snapshot
15.14.3. Company Market Share Analysis
15.14.4. Company Product Portfolio
15.14.5. Recent Developments
15.14.6. SWOT Analysis
15.15. Disney+
15.15.1. Business Overview
15.15.2. Company Snapshot
15.15.3. Company Market Share Analysis
15.15.4. Company Product Portfolio
15.15.5. Recent Developments
15.15.6. SWOT Analysis
15.16. Google LLC
15.16.1. Business Overview
15.16.2. Company Snapshot
15.16.3. Company Market Share Analysis
15.16.4. Company Product Portfolio
15.16.5. Recent Developments
15.16.6. SWOT Analysis
15.17. Haivision, Inc.
15.17.1. Business Overview
15.17.2. Company Snapshot
15.17.3. Company Market Share Analysis
15.17.4. Company Product Portfolio
15.17.5. Recent Developments
15.17.6. SWOT Analysis
15.18. Hulu, LLC
15.18.1. Business Overview
15.18.2. Company Snapshot
15.18.3. Company Market Share Analysis
15.18.4. Company Product Portfolio
15.18.5. Recent Developments
15.18.6. SWOT Analysis
15.19. Facebook
15.19.1. Business Overview
15.19.2. Company Snapshot
15.19.3. Company Market Share Analysis
15.19.4. Company Product Portfolio
15.19.5. Recent Developments
15.19.6. SWOT Analysis
15.20. Fandango
15.20.1. Business Overview
15.20.2. Company Snapshot
15.20.3. Company Market Share Analysis
15.20.4. Company Product Portfolio
15.20.5. Recent Developments
15.20.6. SWOT Analysis
15.21. IBM
15.21.1. Business Overview
15.21.2. Company Snapshot
15.21.3. Company Market Share Analysis
15.21.4. Company Product Portfolio
15.21.5. Recent Developments
15.21.6. SWOT Analysis
15.22. iNDIEFLIX Group Inc.
15.22.1. Business Overview
15.22.2. Company Snapshot
15.22.3. Company Market Share Analysis
15.22.4. Company Product Portfolio
15.22.5. Recent Developments
15.22.6. SWOT Analysis
15.23. Kaltura, Inc.
15.23.1. Business Overview
15.23.2. Company Snapshot
15.23.3. Company Market Share Analysis
15.23.4. Company Product Portfolio
15.23.5. Recent Developments
15.23.6. SWOT Analysis
15.24. Microsoft
15.24.1. Business Overview
15.24.2. Company Snapshot
15.24.3. Company Market Share Analysis
15.24.4. Company Product Portfolio
15.24.5. Recent Developments
15.24.6. SWOT Analysis
15.25. Netflix, Inc.
15.25.1. Business Overview
15.25.2. Company Snapshot
15.25.3. Company Market Share Analysis
15.25.4. Company Product Portfolio
15.25.5. Recent Developments
15.25.6. SWOT Analysis
15.26. Roku, Inc.
15.26.1. Business Overview
15.26.2. Company Snapshot
15.26.3. Company Market Share Analysis
15.26.4. Company Product Portfolio
15.26.5. Recent Developments
15.26.6. SWOT Analysis
15.27. STAR
15.27.1. Business Overview
15.27.2. Company Snapshot
15.27.3. Company Market Share Analysis
15.27.4. Company Product Portfolio
15.27.5. Recent Developments
15.27.6. SWOT Analysis
15.28. Snagfilms Inc.
15.28.1. Business Overview
15.28.2. Company Snapshot
15.28.3. Company Market Share Analysis
15.28.4. Company Product Portfolio
15.28.5. Recent Developments
15.28.6. SWOT Analysis
15.29. Twitter, Inc.
15.29.1. Business Overview
15.29.2. Company Snapshot
15.29.3. Company Market Share Analysis
15.29.4. Company Product Portfolio
15.29.5. Recent Developments
15.29.6. SWOT Analysis
15.30. TalkTalk TV Entertainment Limited
15.30.1. Business Overview
15.30.2. Company Snapshot
15.30.3. Company Market Share Analysis
15.30.4. Company Product Portfolio
15.30.5. Recent Developments
15.30.6. SWOT Analysis
15.31. Tencent Holdings Ltd.
15.31.1. Business Overview
15.31.2. Company Snapshot
15.31.3. Company Market Share Analysis
15.31.4. Company Product Portfolio
15.31.5. Recent Developments
15.31.6. SWOT Analysis
15.32. Ustream, Inc.
15.32.1. Business Overview
15.32.2. Company Snapshot
15.32.3. Company Market Share Analysis
15.32.4. Company Product Portfolio
15.32.5. Recent Developments
15.32.6. SWOT Analysis
15.33. Verizon Media
15.33.1. Business Overview
15.33.2. Company Snapshot
15.33.3. Company Market Share Analysis
15.33.4. Company Product Portfolio
15.33.5. Recent Developments
15.33.6. SWOT Analysis
15.34. Wowza Media Systems, LLC
15.34.1. Business Overview
15.34.2. Company Snapshot
15.34.3. Company Market Share Analysis
15.34.4. Company Product Portfolio
15.34.5. Recent Developments
15.34.6. SWOT Analysis
15.35. Xperi
15.35.1. Business Overview
15.35.2. Company Snapshot
15.35.3. Company Market Share Analysis
15.35.4. Company Product Portfolio
15.35.5. Recent Developments
15.35.6. SWOT Analysis
List of Table
1. Global Video Streaming Market, By Type, 2020-2033 (USD Billion)
2. Global Live Video Streaming Market, By Region, 2020-2033 (USD Billion)
3. Global Non-Linear Video Streaming Market, By Region, 2020-2033 (USD Billion)
4. Global Video Streaming Market, By Deployment, 2020-2033 (USD Billion)
5. Global Cloud Video Streaming Market, By Region, 2020-2033 (USD Billion)
6. Global On-Premises Video Streaming Market, By Region, 2020-2033 (USD Billion)
7. Global Hybrid Video Streaming Market, By Region, 2020-2033 (USD Billion)
8. Global Video Streaming Market, By Solution, 2020-2033 (USD Billion)
9. Global Internet Protocol TV Video Streaming Market, By Region, 2020-2033 (USD Billion)
10. Global Over-the-Top (OTT) Video Streaming Market, By Region, 2020-2033 (USD Billion)
11. Global Pay-TV Video Streaming Market, By Region, 2020-2033 (USD Billion)
12. Global Video Streaming Market, By Service, 2020-2033 (USD Billion)
13. Global Consulting Video Streaming Market, By Region, 2020-2033 (USD Billion)
14. Global Managed Services Video Streaming Market, By Region, 2020-2033 (USD Billion)
15. Global Training & Support Video Streaming Market, By Region, 2020-2033 (USD Billion)
16. Global Video Streaming Market, By Platform, 2020-2033 (USD Billion)
17. Global Gaming Consoles Video Streaming Market, By Region, 2020-2033 (USD Billion)
18. Global Laptops & Desktops Video Streaming Market, By Region, 2020-2033 (USD Billion)
19. Global Smartphones & Tablets Video Streaming Market, By Region, 2020-2033 (USD Billion)
20. Global Smart TV Video Streaming Market, By Region, 2020-2033 (USD Billion)
21. Global Video Streaming Market, By Revenue Model, 2020-2033 (USD Billion)
22. Global Advertising Video Streaming Market, By Region, 2020-2033 (USD Billion)
23. Global Rental Video Streaming Market, By Region, 2020-2033 (USD Billion)
24. Global Subscription Video Streaming Market, By Region, 2020-2033 (USD Billion)
25. Global Video Streaming Market, By End User, 2020-2033 (USD Billion)
26. Global Enterprise Video Streaming Market, By Region, 2020-2033 (USD Billion)
27. Global Consumer Video Streaming Market, By Region, 2020-2033 (USD Billion)
28. Global Video Streaming Market, By Region, 2020-2033 (USD Billion)
29. North America Video Streaming Market, By Type, 2020-2033 (USD Billion)
30. North America Video Streaming Market, By Deployment, 2020-2033 (USD Billion)
31. North America Video Streaming Market, By Solution, 2020-2033 (USD Billion)
32. North America Video Streaming Market, By Service, 2020-2033 (USD Billion)
33. North America Video Streaming Market, By Platform, 2020-2033 (USD Billion)
34. North America Video Streaming Market, By Revenue Model, 2020-2033 (USD Billion)
35. North America Video Streaming Market, By End User, 2020-2033 (USD Billion)
36. U.S. Video Streaming Market, By Type, 2020-2033 (USD Billion)
37. U.S. Video Streaming Market, By Deployment, 2020-2033 (USD Billion)
38. U.S. Video Streaming Market, By Solution, 2020-2033 (USD Billion)
39. U.S. Video Streaming Market, By Service, 2020-2033 (USD Billion)
40. U.S. Video Streaming Market, By Platform, 2020-2033 (USD Billion)
41. U.S. Video Streaming Market, By Revenue Model, 2020-2033 (USD Billion)
42. U.S. Video Streaming Market, By End User, 2020-2033 (USD Billion)
43. Canada Video Streaming Market, By Type, 2020-2033 (USD Billion)
44. Canada Video Streaming Market, By Deployment, 2020-2033 (USD Billion)
45. Canada Video Streaming Market, By Solution, 2020-2033 (USD Billion)
46. Canada Video Streaming Market, By Service, 2020-2033 (USD Billion)
47. Canada Video Streaming Market, By Platform, 2020-2033 (USD Billion)
48. Canada Video Streaming Market, By Revenue Model, 2020-2033 (USD Billion)
49. Canada Video Streaming Market, By End User, 2020-2033 (USD Billion)
50. Mexico Video Streaming Market, By Type, 2020-2033 (USD Billion)
51. Mexico Video Streaming Market, By Deployment, 2020-2033 (USD Billion)
52. Mexico Video Streaming Market, By Solution, 2020-2033 (USD Billion)
53. Mexico Video Streaming Market, By Service, 2020-2033 (USD Billion)
54. Mexico Video Streaming Market, By Platform, 2020-2033 (USD Billion)
55. Mexico Video Streaming Market, By Revenue Model, 2020-2033 (USD Billion)
56. Mexico Video Streaming Market, By End User, 2020-2033 (USD Billion)
57. Europe Video Streaming Market, By Type, 2020-2033 (USD Billion)
58. Europe Video Streaming Market, By Deployment, 2020-2033 (USD Billion)
59. Europe Video Streaming Market, By Solution, 2020-2033 (USD Billion)
60. Europe Video Streaming Market, By Service, 2020-2033 (USD Billion)
61. Europe Video Streaming Market, By Platform, 2020-2033 (USD Billion)
62. Europe Video Streaming Market, By Revenue Model, 2020-2033 (USD Billion)
63. Europe Video Streaming Market, By End User, 2020-2033 (USD Billion)
64. Germany Video Streaming Market, By Type, 2020-2033 (USD Billion)
65. Germany Video Streaming Market, By Deployment, 2020-2033 (USD Billion)
66. Germany Video Streaming Market, By Solution, 2020-2033 (USD Billion)
67. Germany Video Streaming Market, By Service, 2020-2033 (USD Billion)
68. Germany Video Streaming Market, By Platform, 2020-2033 (USD Billion)
69. Germany Video Streaming Market, By Revenue Model, 2020-2033 (USD Billion)
70. Germany Video Streaming Market, By End User, 2020-2033 (USD Billion)
71. France Video Streaming Market, By Type, 2020-2033 (USD Billion)
72. France Video Streaming Market, By Deployment, 2020-2033 (USD Billion)
73. France Video Streaming Market, By Solution, 2020-2033 (USD Billion)
74. France Video Streaming Market, By Service, 2020-2033 (USD Billion)
75. France Video Streaming Market, By Platform, 2020-2033 (USD Billion)
76. France Video Streaming Market, By Revenue Model, 2020-2033 (USD Billion)
77. France Video Streaming Market, By End User, 2020-2033 (USD Billion)
78. U.K. Video Streaming Market, By Type, 2020-2033 (USD Billion)
79. U.K. Video Streaming Market, By Deployment, 2020-2033 (USD Billion)
80. U.K. Video Streaming Market, By Solution, 2020-2033 (USD Billion)
81. U.K. Video Streaming Market, By Service, 2020-2033 (USD Billion)
82. U.K. Video Streaming Market, By Platform, 2020-2033 (USD Billion)
83. U.K. Video Streaming Market, By Revenue Model, 2020-2033 (USD Billion)
84. U.K. Video Streaming Market, By End User, 2020-2033 (USD Billion)
85. Italy Video Streaming Market, By Type, 2020-2033 (USD Billion)
86. Italy Video Streaming Market, By Deployment, 2020-2033 (USD Billion)
87. Italy Video Streaming Market, By Solution, 2020-2033 (USD Billion)
88. Italy Video Streaming Market, By Service, 2020-2033 (USD Billion)
89. Italy Video Streaming Market, By Platform, 2020-2033 (USD Billion)
90. Italy Video Streaming Market, By Revenue Model, 2020-2033 (USD Billion)
91. Italy Video Streaming Market, By End User, 2020-2033 (USD Billion)
92. Spain Video Streaming Market, By Type, 2020-2033 (USD Billion)
93. Spain Video Streaming Market, By Deployment, 2020-2033 (USD Billion)
94. Spain Video Streaming Market, By Solution, 2020-2033 (USD Billion)
95. Spain Video Streaming Market, By Service, 2020-2033 (USD Billion)
96. Spain Video Streaming Market, By Platform, 2020-2033 (USD Billion)
97. Spain Video Streaming Market, By Revenue Model, 2020-2033 (USD Billion)
98. Spain Video Streaming Market, By End User, 2020-2033 (USD Billion)
99. Asia Pacific Video Streaming Market, By Type, 2020-2033 (USD Billion)
100. Asia Pacific Video Streaming Market, By Deployment, 2020-2033 (USD Billion)
101. Asia Pacific Video Streaming Market, By Solution, 2020-2033 (USD Billion)
102. Asia Pacific Video Streaming Market, By Service, 2020-2033 (USD Billion)
103. Asia Pacific Video Streaming Market, By Platform, 2020-2033 (USD Billion)
104. Asia Pacific Video Streaming Market, By Revenue Model, 2020-2033 (USD Billion)
105. Asia Pacific Video Streaming Market, By End User, 2020-2033 (USD Billion)
106. Japan Video Streaming Market, By Type, 2020-2033 (USD Billion)
107. Japan Video Streaming Market, By Deployment, 2020-2033 (USD Billion)
108. Japan Video Streaming Market, By Solution, 2020-2033 (USD Billion)
109. Japan Video Streaming Market, By Service, 2020-2033 (USD Billion)
110. Japan Video Streaming Market, By Platform, 2020-2033 (USD Billion)
111. Japan Video Streaming Market, By Revenue Model, 2020-2033 (USD Billion)
112. Japan Video Streaming Market, By End User, 2020-2033 (USD Billion)
113. China Video Streaming Market, By Type, 2020-2033 (USD Billion)
114. China Video Streaming Market, By Deployment, 2020-2033 (USD Billion)
115. China Video Streaming Market, By Solution, 2020-2033 (USD Billion)
116. China Video Streaming Market, By Service, 2020-2033 (USD Billion)
117. China Video Streaming Market, By Platform, 2020-2033 (USD Billion)
118. China Video Streaming Market, By Revenue Model, 2020-2033 (USD Billion)
119. China Video Streaming Market, By End User, 2020-2033 (USD Billion)
120. India Video Streaming Market, By Type, 2020-2033 (USD Billion)
121. India Video Streaming Market, By Deployment, 2020-2033 (USD Billion)
122. India Video Streaming Market, By Solution, 2020-2033 (USD Billion)
123. India Video Streaming Market, By Service, 2020-2033 (USD Billion)
124. India Video Streaming Market, By Platform, 2020-2033 (USD Billion)
125. India Video Streaming Market, By Revenue Model, 2020-2033 (USD Billion)
126. India Video Streaming Market, By End User, 2020-2033 (USD Billion)
127. South America Video Streaming Market, By Type, 2020-2033 (USD Billion)
128. South America Video Streaming Market, By Deployment, 2020-2033 (USD Billion)
129. South America Video Streaming Market, By Solution, 2020-2033 (USD Billion)
130. South America Video Streaming Market, By Service, 2020-2033 (USD Billion)
131. South America Video Streaming Market, By Platform, 2020-2033 (USD Billion)
132. South America Video Streaming Market, By Revenue Model, 2020-2033 (USD Billion)
133. South America Video Streaming Market, By End User, 2020-2033 (USD Billion)
134. Brazil Video Streaming Market, By Type, 2020-2033 (USD Billion)
135. Brazil Video Streaming Market, By Deployment, 2020-2033 (USD Billion)
136. Brazil Video Streaming Market, By Solution, 2020-2033 (USD Billion)
137. Brazil Video Streaming Market, By Service, 2020-2033 (USD Billion)
138. Brazil Video Streaming Market, By Platform, 2020-2033 (USD Billion)
139. Brazil Video Streaming Market, By Revenue Model, 2020-2033 (USD Billion)
140. Brazil Video Streaming Market, By End User, 2020-2033 (USD Billion)
141. Middle East and Africa Video Streaming Market, By Type, 2020-2033 (USD Billion)
142. Middle East and Africa Video Streaming Market, By Deployment, 2020-2033 (USD Billion)
143. Middle East and Africa Video Streaming Market, By Solution, 2020-2033 (USD Billion)
144. Middle East and Africa Video Streaming Market, By Service, 2020-2033 (USD Billion)
145. Middle East and Africa Video Streaming Market, By Platform, 2020-2033 (USD Billion)
146. Middle East and Africa Video Streaming Market, By Revenue Model, 2020-2033 (USD Billion)
147. Middle East and Africa Video Streaming Market, By End User, 2020-2033 (USD Billion)
148. UAE Video Streaming Market, By Type, 2020-2033 (USD Billion)
149. UAE Video Streaming Market, By Deployment, 2020-2033 (USD Billion)
150. UAE Video Streaming Market, By Solution, 2020-2033 (USD Billion)
151. UAE Video Streaming Market, By Service, 2020-2033 (USD Billion)
152. UAE Video Streaming Market, By Platform, 2020-2033 (USD Billion)
153. UAE Video Streaming Market, By Revenue Model, 2020-2033 (USD Billion)
154. UAE Video Streaming Market, By End User, 2020-2033 (USD Billion)
155. South Africa Video Streaming Market, By Type, 2020-2033 (USD Billion)
156. South Africa Video Streaming Market, By Deployment, 2020-2033 (USD Billion)
157. South Africa Video Streaming Market, By Solution, 2020-2033 (USD Billion)
158. South Africa Video Streaming Market, By Service, 2020-2033 (USD Billion)
159. South Africa Video Streaming Market, By Platform, 2020-2033 (USD Billion)
160. South Africa Video Streaming Market, By Revenue Model, 2020-2033 (USD Billion)
161. South Africa Video Streaming Market, By End User, 2020-2033 (USD Billion)
List of Figures
1. Global Video Streaming Market Segmentation
2. Video Streaming Market: Research Methodology
3. Market Size Estimation Methodology: Bottom-Up Approach
4. Market Size Estimation Methodology: Top-Down Approach
5. Data Triangulation
6. Porter’s Five Forces Analysis
7. Value Chain Analysis
8. Global Video Streaming Market Attractiveness Analysis by Type
9. Global Video Streaming Market Attractiveness Analysis by Deployment
10. Global Video Streaming Market Attractiveness Analysis by Solution
11. Global Video Streaming Market Attractiveness Analysis by Service
12. Global Video Streaming Market Attractiveness Analysis by Platform
13. Global Video Streaming Market Attractiveness Analysis by Revenue Model
14. Global Video Streaming Market Attractiveness Analysis by End User
15. Global Video Streaming Market Attractiveness Analysis by Region
16. Global Video Streaming Market: Dynamics
17. Global Video Streaming Market Share by Type (2023 & 2033)
18. Global Video Streaming Market Share by Deployment (2023 & 2033)
19. Global Video Streaming Market Share by Solution (2023 & 2033)
20. Global Video Streaming Market Share by Service (2023 & 2033)
21. Global Video Streaming Market Share by Platform (2023 & 2033)
22. Global Video Streaming Market Share by Revenue Model (2023 & 2033)
23. Global Video Streaming Market Share by End User (2023 & 2033)
24. Global Video Streaming Market Share by Regions (2023 & 2033)
25. Global Video Streaming Market Share by Company (2023)
This study forecasts revenue at global, regional, and country levels from 2020 to 2033. The Brainy Insights has segmented the global Video Streaming market based on below-mentioned segments:
Global Video Streaming Market by Type:
Global Video Streaming Market by Deployment:
Global Video Streaming Market by Solution:
Global Video Streaming Market by Service:
Global Video Streaming Market by Platform:
Global Video Streaming Market by Revenue Model:
Global Video Streaming Market by End User:
Global Video Streaming Market by Region:
Research has its special purpose to undertake marketing efficiently. In this competitive scenario, businesses need information across all industry verticals; the information about customer wants, market demand, competition, industry trends, distribution channels etc. This information needs to be updated regularly because businesses operate in a dynamic environment. Our organization, The Brainy Insights incorporates scientific and systematic research procedures in order to get proper market insights and industry analysis for overall business success. The analysis consists of studying the market from a miniscule level wherein we implement statistical tools which helps us in examining the data with accuracy and precision.
Our research reports feature both; quantitative and qualitative aspects for any market. Qualitative information for any market research process are fundamental because they reveal the customer needs and wants, usage and consumption for any product/service related to a specific industry. This in turn aids the marketers/investors in knowing certain perceptions of the customers. Qualitative research can enlighten about the different product concepts and designs along with unique service offering that in turn, helps define marketing problems and generate opportunities. On the other hand, quantitative research engages with the data collection process through interviews, e-mail interactions, surveys and pilot studies. Quantitative aspects for the market research are useful to validate the hypotheses generated during qualitative research method, explore empirical patterns in the data with the help of statistical tools, and finally make the market estimations.
The Brainy Insights offers comprehensive research and analysis, based on a wide assortment of factual insights gained through interviews with CXOs and global experts and secondary data from reliable sources. Our analysts and industry specialist assume vital roles in building up statistical tools and analysis models, which are used to analyse the data and arrive at accurate insights with exceedingly informative research discoveries. The data provided by our organization have proven precious to a diverse range of companies, facilitating them to address issues such as determining which products/services are the most appealing, whether or not customers use the product in the manner anticipated, the purchasing intentions of the market and many others.
Our research methodology encompasses an idyllic combination of primary and secondary initiatives. Key phases involved in this process are listed below:

The phase involves the gathering and collecting of market data and its related information with the help of different sources & research procedures.

The data procurement stage involves in data gathering and collecting through various data sources.
This stage involves in extensive research. These data sources includes:
Purchased Database: Purchased databases play a crucial role in estimating the market sizes irrespective of the domain. Our purchased database includes:
Primary Research: The Brainy Insights interacts with leading companies and experts of the concerned domain to develop the analyst team’s market understanding and expertise. It improves and substantiates every single data presented in the market reports. Primary research mainly involves in telephonic interviews, E-mail interactions and face-to-face interviews with the raw material providers, manufacturers/producers, distributors, & independent consultants. The interviews that we conduct provides valuable data on market size and industry growth trends prevailing in the market. Our organization also conducts surveys with the various industry experts in order to gain overall insights of the industry/market. For instance, in healthcare industry we conduct surveys with the pharmacists, doctors, surgeons and nurses in order to gain insights and key information of a medical product/device/equipment which the customers are going to usage. Surveys are conducted in the form of questionnaire designed by our own analyst team. Surveys plays an important role in primary research because surveys helps us to identify the key target audiences of the market. Additionally, surveys helps to identify the key target audience engaged with the market. Our survey team conducts the survey by targeting the key audience, thus gaining insights from them. Based on the perspectives of the customers, this information is utilized to formulate market strategies. Moreover, market surveys helps us to understand the current competitive situation of the industry. To be precise, our survey process typically involve with the 360 analysis of the market. This analytical process begins by identifying the prospective customers for a product or service related to the market/industry to obtain data on how a product/service could fit into customers’ lives.

Secondary Research: The secondary data sources includes information published by the on-profit organizations such as World bank, WHO, company fillings, investor presentations, annual reports, national government documents, statistical databases, blogs, articles, white papers and others. From the annual report, we analyse a company’s revenue to understand the key segment and market share of that organization in a particular region. We analyse the company websites and adopt the product mapping technique which is important for deriving the segment revenue. In the product mapping method, we select and categorize the products offered by the companies catering to domain specific market, deduce the product revenue for each of the companies so as to get overall estimation of the market size. We also source data and analyses trends based on information received from supply side and demand side intermediaries in the value chain. The supply side denotes the data gathered from supplier, distributor, wholesaler and the demand side illustrates the data gathered from the end customers for respective market domain.

The supply side for a domain specific market is analysed by:
The demand side for the market is estimated through:
In-house Library: Apart from these third-party sources, we have our in-house library of qualitative and quantitative information. Our in-house database includes market data for various industry and domains. These data are updated on regular basis as per the changing market scenario. Our library includes, historic databases, internal audit reports and archives.
Sometimes there are instances where there is no metadata or raw data available for any domain specific market. For those cases, we use our expertise to forecast and estimate the market size in order to generate comprehensive data sets. Our analyst team adopt a robust research technique in order to produce the estimates:
Data Synthesis: This stage involves the analysis & mapping of all the information obtained from the previous step. It also involves in scrutinizing the data for any discrepancy observed while data gathering related to the market. The data is collected with consideration to the heterogeneity of sources. Robust scientific techniques are in place for synthesizing disparate data sets and provide the essential contextual information that can orient market strategies. The Brainy Insights has extensive experience in data synthesis where the data passes through various stages:


Market Deduction & Formulation: The final stage comprises of assigning data points at appropriate market spaces so as to deduce feasible conclusions. Analyst perspective & subject matter expert based holistic form of market sizing coupled with industry analysis also plays a crucial role in this stage.
This stage involves in finalization of the market size and numbers that we have collected from data integration step. With data interpolation, it is made sure that there is no gap in the market data. Successful trend analysis is done by our analysts using extrapolation techniques, which provide the best possible forecasts for the market.
Data Validation & Market Feedback: Validation is the most important step in the process. Validation & re-validation via an intricately designed process helps us finalize data-points to be used for final calculations.

The Brainy Insights interacts with leading companies and experts of the concerned domain to develop the analyst team’s market understanding and expertise. It improves and substantiates every single data presented in the market reports. The data validation interview and discussion panels are typically composed of the most experienced industry members. The participants include, however, are not limited to:
Moreover, we always validate our data and findings through primary respondents from all the major regions we are working on.


Free Customization
Fortune 500 Clients
Free Yearly Update On Purchase Of Multi/Corporate License
Companies Served Till Date