- +1-315-215-1633
- sales@thebrainyinsights.com

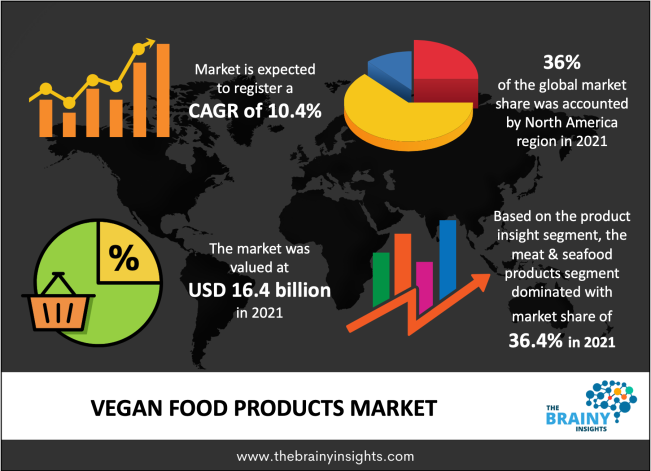
The vegan food products market size was valued at USD 16.4 billion in 2021 and is anticipated to register a CAGR of 10.4% from 2022 to 2030. The rising acceptance of vegan food owing to its health benefits is propelling market growth. Increasing concern among consumers about animal health & rising cases of cruelty has shifted their focus towards a vegan diet. The plant-based foods are rich in protein, antioxidants, and fibers, and low in saturated fats, thus, improving heart health and cholesterol levels in the body.
As an increasing number of people are turning to vegan owing to factors such as lactose intolerance, allergies to seafood, etc. food manufacturers have been trying to offer a wide range of products in various flavors and pack sizes. For instance, Better Food launched its canned vegan meat in the US, along with other products such as cold cuts, patties, and meatballs in September 2022. Similarly, in August 2022, OmniSeafood entered the UK market through Whole Foods Market in London and online at Ocado and The Vegan Kind Supermarket.
The outbreak of covid-19 positively impacted the demand for vegan food including meat, meals, cheese, butter, and yogurt. The covid-19 outbreak increased the health consciousness among consumers, which increased the demand for food products made from a plant-based source. According to Plant Based Food Association article published in June 2020, the retail sales of vegan foods in the US outpaced the total food sales and showed a growth of 90% in comparison to 2019. Furthermore, the pandemic showed a panic buying for plant-based meat as consumers were afraid to eat real meat.
Get an overview of this study by requesting a free sample
The price of vegan food products is higher in comparison to conventional food products, which is likely to hinder the market growth rate. As vegan food is still in the growing stage it is produced in small amounts which increases the production cost. Furthermore, companies also spent a lot of money on research & development & marketing strategies. Over the past few years, the prices of vegan food products will come down but still are likely to remain higher than conventional products.
The government of various countries is also supporting the expansion of vegan food products. For instance, in September 2021, the Food Safety and Standard Authority of India (FSSAI) launches a new logo for vegan foods to help the consumer identify vegan products. Further, later in 2022, FSSAI made it mandatory to have a logo on all vegan food sold in India. Such instances are likely to support market growth.
Meat & seafood products led the market with a share of 36.4% in 2021. More consumers have been trying out vegan meat products as they are made up of plant-based protein or ingredients such as soy, oats, etc. The plant-based ingredients are rich in protein and fiber and do not cause environmental pollution.
Furthermore, an increasing number of seafood allergies is also influencing consumers to switch to vegan seafood products. The rising number of product launches in this category is boding well for the segment growth. For instance, in October 2020, Good Catch, a brand manufactured by Gathered Foods launched vegan seafood in Canada in more than 600 retail stores.
Vegan sauces & spreads are expected to witness significant growth during the forecast period. Evolving food trends and acceptance of vegan spreads among all types of consumers are the major factors driving the market growth. Earlier vegan sauces were limited to lactose-intolerant people but now as consumers are becoming aware, the demand for vegan sauces has been soaring among non-lactose-intolerant consumers. According to the Good Food Institute (GFI), vegan sauces & spreads have shown a growth of 20% in the year 2020-2021. Hidden Valley, Kite Hill, Dean’s Ranch, Daiya, and Violife are some of the popular brands of vegan sauces & dips in the US.
The offline distribution channel held a larger share of more than 75% in 2021. Supermarkets & Hypermarkets such as Walmart, Kroger, Target, and Tesco have designated shelf space for vegan food products, thus, consumers like to purchase through this channel. The availability of a wide range of brands and membership discounts also influence consumers to shop through this channel.
The online distribution channel is anticipated to witness a higher CAGR of 11.5% from 2022 to 2030 owing to rising shopping through this channel. According to the Digital Commerce report 2021, Asia accounts for more than 50% of online retail sales in the world. Furthermore, according to the same report, China led online shopping in the region accounting for more than 30%. Thus, rising online shopping and growing D2C business worldwide is likely to boost market growth.
The Asia Pacific is expected to witness the fastest growth rate during the forecast period. The market is driven by the increasing adoption of western food habits and rising awareness about the benefits of vegan food products. Moreover, product launches by both domestic & international brands in countries like India, China, Australia, and others are expected to boost market growth.
Some of the key product launches in the Asia Pacific region include: -
North America led the market with a share of more than 36% in 2021. The increasing number of lactose-intolerant people are switching to vegan butter, cheese, and yogurt, which is driving the market growth. According to Boston Children’s Hospital, 30-50 million Americans are lactose intolerant. Further, the consumption of vegan food by non-vegan consumers owing to its health benefits is also expected to boost the market.
The vegan food products market consists of a large number of players, some of which are well established like General Mills Inc., Danone, Nestlé, and Kraft Heinz. While others are small & medium-sized enterprise offering only vegan products. Product launches & focus on research & development is a key to success in this highly competitive market.
Segments Covered in the Report
1. Introduction
1.1. Objectives of the Study
1.2. Market Definition
1.3. Research Scope
1.4. Currency
1.5. Key Target Audience
2. Research Methodology and Assumptions
3. Executive Summary
4. Premium Insights
4.1. Porter’s Five Forces Analysis
4.2. Value Chain Analysis
4.3. Top Investment Pockets
4.3.1. Market Attractiveness Analysis by Product Type
4.3.2. Market Attractiveness Analysis by Distribution Channel
4.3.3. Market Attractiveness Analysis by Region
4.4. Industry Trends
5. Market Dynamics
5.1. Market Evaluation
5.2. Drivers
5.2.1. Rising health consciousness
5.3. Restraints
5.3.1. Price for vegan foods is higher
5.4. Opportunities
5.4.1. Increasing demand at the offline restaurants
5.4.2. Growing e-commerce platforms
5.5. Challenges
5.5.1. Economic slowdown
6. Global Vegan Food Market Analysis and Forecast, By Product Type
6.1. Segment Overview
6.2. Meat and Seafood
6.3. Yogurt
6.4. Cheese
6.5. Butter
6.6. Creamers
6.7. Ice-creams and Frozen Novelties
6.8. Ready Meals
6.9. Others
7. Global Vegan Food Market Analysis and Forecast, By Distribution Channel
7.1. Segment Overview
7.2. Online
7.3. Offline
8. Global Vegan Food Market Analysis and Forecast, By Regional Analysis
8.1. Segment Overview
8.2. North America
8.2.1. U.S.
8.2.2. Canada
8.2.3. Mexico
8.3. Europe
8.3.1. Germany
8.3.2. France
8.3.3. U.K.
8.3.4. Italy
8.3.5. Spain
8.4. Asia-Pacific
8.4.1. Japan
8.4.2. China
8.4.3. India
8.4.4. South Korea
8.4.5. Australia
8.5. South America
8.5.1. Brazil
8.5.2. Argentina
8.6. Middle East and Africa
8.6.1. UAE
8.6.2. South Africa
8.6.3. Saudi Arabia
9. Global Vegan Food Market-Competitive Landscape
9.1. Overview
9.2. Market Share of Key Players in the Vegan Food Market
9.2.1. Global Company Market Share
9.2.2. North America Company Market Share
9.2.3. Europe Company Market Share
9.2.4. APAC Company Market Share
9.3. Competitive Situations and Trends
9.3.1. Product Launches and Developments
9.3.2. Partnerships, Collaborations, and Agreements
9.3.3. Mergers & Acquisitions
9.3.4. Expansions
10. Company Profiles
10.1. General Mills Inc.
10.1.1. Business Overview
10.1.2. Company Snapshot
10.1.3. Company Market Share Analysis
10.1.4. Company Product Portfolio
10.1.5. Recent Developments
10.1.6. SWOT Analysis
10.2. Kraft Heinz
10.2.1. Business Overview
10.2.2. Company Snapshot
10.2.3. Company Market Share Analysis
10.2.4. Company Product Portfolio
10.2.5. Recent Developments
10.2.6. SWOT Analysis
10.3. Danone
10.3.1. Business Overview
10.3.2. Company Snapshot
10.3.3. Company Market Share Analysis
10.3.4. Company Product Portfolio
10.3.5. Recent Developments
10.3.6. SWOT Analysis
10.4. VITASOY International Holdings Limited
10.4.1. Business Overview
10.4.2. Company Snapshot
10.4.3. Company Market Share Analysis
10.4.4. Company Product Portfolio
10.4.5. Recent Developments
10.4.6. SWOT Analysis
10.5. Amy's Kitchen
10.5.1. Business Overview
10.5.2. Company Snapshot
10.5.3. Company Market Share Analysis
10.5.4. Company Product Portfolio
10.5.5. Recent Developments
10.5.6. SWOT Analysis
10.6. VBites Foods Limited
10.6.1. Business Overview
10.6.2. Company Snapshot
10.6.3. Company Market Share Analysis
10.6.4. Company Product Portfolio
10.6.5. Recent Developments
10.6.6. SWOT Analysis
10.7. SunOpta.
10.7.1. Business Overview
10.7.2. Company Snapshot
10.7.3. Company Market Share Analysis
10.7.4. Company Product Portfolio
10.7.5. Recent Developments
10.7.6. SWOT Analysis
10.8. Daiya Foods Inc.
10.8.1. Business Overview
10.8.2. Company Snapshot
10.8.3. Company Market Share Analysis
10.8.4. Company Product Portfolio
10.8.5. Recent Developments
10.8.6. SWOT Analysis
10.9. Tofutti Brands Inc.
10.9.1. Business Overview
10.9.2. Company Snapshot
10.9.3. Company Market Share Analysis
10.9.4. Company Product Portfolio
10.9.5. Recent Developments
10.9.6. SWOT Analysis
10.10. Plamil Foods Ltd
10.10.1. Business Overview
10.10.2. Company Snapshot
10.10.3. Company Market Share Analysis
10.10.4. Company Product Portfolio
10.10.5. Recent Developments
10.10.6. SWOT Analysis
10.11. Eden Foods Inc.
10.11.1. Business Overview
10.11.2. Company Snapshot
10.11.3. Company Market Share Analysis
10.11.4. Company Product Portfolio
10.11.5. Recent Developments
10.11.6. SWOT Analysis
List of Table
1. Global Vegan Food Market, By Product Type, 2019-2030 (USD Billion) (Tons)
2. Global Meat and Seafood Vegan Food Market, By Region, 2019-2030 (USD Billion) (Tons)
3. Global Yogurt Vegan Food Market, By Region, 2019-2030 (USD Billion) (Tons)
4. Global Cheese Vegan Food Market, By Region, 2019-2030 (USD Billion) (Tons)
5. Global Butter Vegan Food Market, By Region, 2019-2030 (USD Billion) (Tons)
6. Global Creamers Vegan Food Market, By Region, 2019-2030 (USD Billion) (Tons)
7. Global Ice-creams and Frozen Novelties Vegan Food Market, By Region, 2019-2030 (USD Billion) (Tons)
8. Global Ready Meals Vegan Food Market, By Region, 2019-2030 (USD Billion) (Tons)
9. Global Others Vegan Food Market, By Region, 2019-2030 (USD Billion) (Tons)
10. Global Vegan Food Market, By Distribution Channel, 2019-2030 (USD Billion) (Tons)
11. Global Online Vegan Food Market, By Region, 2019-2030 (USD Billion) (Tons)
12. Global Offline Vegan Food Market, By Region, 2019-2030 (USD Billion) (Tons)
13. Global Vegan Food Market, By Region, 2019-2030 (USD Billion) (Tons)
14. North America Vegan Food Market, By Product Type, 2019-2030 (USD Billion) (Tons)
15. North America Vegan Food Market, By Distribution Channel, 2019-2030 (USD Billion) (Tons)
16. U.S. Vegan Food Market, By Product Type, 2019-2030 (USD Billion) (Tons)
17. U.S. Vegan Food Market, By Distribution Channel, 2019-2030 (USD Billion) (Tons)
18. Canada Vegan Food Market, By Product Type, 2019-2030 (USD Billion) (Tons)
19. Canada Vegan Food Market, By Distribution Channel, 2019-2030 (USD Billion) (Tons)
20. Mexico Vegan Food Market, By Product Type, 2019-2030 (USD Billion) (Tons)
21. Mexico Vegan Food Market, By Distribution Channel, 2019-2030 (USD Billion) (Tons)
22. Europe Vegan Food Market, By Product Type, 2019-2030 (USD Billion) (Tons)
23. Europe Vegan Food Market, By Distribution Channel, 2019-2030 (USD Billion) (Tons)
24. Germany Vegan Food Market, By Product Type, 2019-2030 (USD Billion) (Tons)
25. Germany Vegan Food Market, By Distribution Channel, 2019-2030 (USD Billion) (Tons)
26. France Vegan Food Market, By Product Type, 2019-2030 (USD Billion) (Tons)
27. France Vegan Food Market, By Distribution Channel, 2019-2030 (USD Billion) (Tons)
28. U.K. Vegan Food Market, By Product Type, 2019-2030 (USD Billion) (Tons)
29. U.K. Vegan Food Market, By Distribution Channel, 2019-2030 (USD Billion) (Tons)
30. Italy Vegan Food Market, By Product Type, 2019-2030 (USD Billion) (Tons)
31. Italy Vegan Food Market, By Distribution Channel, 2019-2030 (USD Billion) (Tons)
32. Spain Vegan Food Market, By Product Type, 2019-2030 (USD Billion) (Tons)
33. Spain Vegan Food Market, By Distribution Channel, 2019-2030 (USD Billion) (Tons)
34. Asia Pacific Vegan Food Market, By Product Type, 2019-2030 (USD Billion) (Tons)
35. Asia Pacific Vegan Food Market, By Distribution Channel, 2019-2030 (USD Billion) (Tons)
36. Japan Vegan Food Market, By Product Type, 2019-2030 (USD Billion) (Tons)
37. Japan Vegan Food Market, By Distribution Channel, 2019-2030 (USD Billion) (Tons)
38. China Vegan Food Market, By Product Type, 2019-2030 (USD Billion) (Tons)
39. China Vegan Food Market, By Distribution Channel, 2019-2030 (USD Billion) (Tons)
40. India Vegan Food Market, By Product Type, 2019-2030 (USD Billion) (Tons)
41. India Vegan Food Market, By Distribution Channel, 2019-2030 (USD Billion) (Tons)
42. South Korea Vegan Food Market, By Product Type, 2019-2030 (USD Billion) (Tons)
43. South Korea Vegan Food Market, By Distribution Channel, 2019-2030 (USD Billion) (Tons)
44. Australia Vegan Food Market, By Product Type, 2019-2030 (USD Billion) (Tons)
45. Australia Vegan Food Market, By Distribution Channel, 2019-2030 (USD Billion) (Tons)
46. South America Vegan Food Market, By Product Type, 2019-2030 (USD Billion) (Tons)
47. South America Vegan Food Market, By Distribution Channel, 2019-2030 (USD Billion) (Tons)
48. Brazil Vegan Food Market, By Product Type, 2019-2030 (USD Billion) (Tons)
49. Brazil Vegan Food Market, By Distribution Channel, 2019-2030 (USD Billion) (Tons)
50. Argentina Vegan Food Market, By Product Type, 2019-2030 (USD Billion) (Tons)
51. Argentina Vegan Food Market, By Distribution Channel, 2019-2030 (USD Billion) (Tons)
52. Middle East and Africa Vegan Food Market, By Product Type, 2019-2030 (USD Billion) (Tons)
53. Middle East and Africa Vegan Food Market, By Distribution Channel, 2019-2030 (USD Billion) (Tons)
54. UAE Vegan Food Market, By Product Type, 2019-2030 (USD Billion) (Tons)
55. UAE Vegan Food Market, By Distribution Channel, 2019-2030 (USD Billion) (Tons)
56. South Africa Vegan Food Market, By Product Type, 2019-2030 (USD Billion) (Tons)
57. South Africa Vegan Food Market, By Distribution Channel, 2019-2030 (USD Billion) (Tons)
58. Saudi Arabia Vegan Food Market, By Product Type, 2019-2030 (USD Billion) (Tons)
59. Saudi Arabia Vegan Food Market, By Distribution Channel, 2019-2030 (USD Billion) (Tons)
List of Figures
1. Global Vegan Food Market Segmentation
2. Vegan Food Market: Research Methodology
3. Market Size Estimation Methodology: Bottom-Up Approach
4. Market Size Estimation Methodology: Top-Down Approach
5. Data Triangulation
6. Porter’s Five Forces Analysis
7. Value Chain Analysis
8. Global Vegan Food Market Attractiveness Analysis by Product Type
9. Global Vegan Food Market Attractiveness Analysis by Distribution Channel
10. Global Vegan Food Market Attractiveness Analysis by Region
11. Global Vegan Food Market: Dynamics
12. Global Vegan Food Market Share by Product Type (2022 & 2030)
13. Global Vegan Food Market Share by Distribution Channel (2022 & 2030)
14. Global Vegan Food Market Share by Regions (2022 & 2030)
15. Global Vegan Food Market Share by Company (2021)
Segments Covered in the Report
Research has its special purpose to undertake marketing efficiently. In this competitive scenario, businesses need information across all industry verticals; the information about customer wants, market demand, competition, industry trends, distribution channels etc. This information needs to be updated regularly because businesses operate in a dynamic environment. Our organization, The Brainy Insights incorporates scientific and systematic research procedures in order to get proper market insights and industry analysis for overall business success. The analysis consists of studying the market from a miniscule level wherein we implement statistical tools which helps us in examining the data with accuracy and precision.
Our research reports feature both; quantitative and qualitative aspects for any market. Qualitative information for any market research process are fundamental because they reveal the customer needs and wants, usage and consumption for any product/service related to a specific industry. This in turn aids the marketers/investors in knowing certain perceptions of the customers. Qualitative research can enlighten about the different product concepts and designs along with unique service offering that in turn, helps define marketing problems and generate opportunities. On the other hand, quantitative research engages with the data collection process through interviews, e-mail interactions, surveys and pilot studies. Quantitative aspects for the market research are useful to validate the hypotheses generated during qualitative research method, explore empirical patterns in the data with the help of statistical tools, and finally make the market estimations.
The Brainy Insights offers comprehensive research and analysis, based on a wide assortment of factual insights gained through interviews with CXOs and global experts and secondary data from reliable sources. Our analysts and industry specialist assume vital roles in building up statistical tools and analysis models, which are used to analyse the data and arrive at accurate insights with exceedingly informative research discoveries. The data provided by our organization have proven precious to a diverse range of companies, facilitating them to address issues such as determining which products/services are the most appealing, whether or not customers use the product in the manner anticipated, the purchasing intentions of the market and many others.
Our research methodology encompasses an idyllic combination of primary and secondary initiatives. Key phases involved in this process are listed below:

The phase involves the gathering and collecting of market data and its related information with the help of different sources & research procedures.

The data procurement stage involves in data gathering and collecting through various data sources.
This stage involves in extensive research. These data sources includes:
Purchased Database: Purchased databases play a crucial role in estimating the market sizes irrespective of the domain. Our purchased database includes:
Primary Research: The Brainy Insights interacts with leading companies and experts of the concerned domain to develop the analyst team’s market understanding and expertise. It improves and substantiates every single data presented in the market reports. Primary research mainly involves in telephonic interviews, E-mail interactions and face-to-face interviews with the raw material providers, manufacturers/producers, distributors, & independent consultants. The interviews that we conduct provides valuable data on market size and industry growth trends prevailing in the market. Our organization also conducts surveys with the various industry experts in order to gain overall insights of the industry/market. For instance, in healthcare industry we conduct surveys with the pharmacists, doctors, surgeons and nurses in order to gain insights and key information of a medical product/device/equipment which the customers are going to usage. Surveys are conducted in the form of questionnaire designed by our own analyst team. Surveys plays an important role in primary research because surveys helps us to identify the key target audiences of the market. Additionally, surveys helps to identify the key target audience engaged with the market. Our survey team conducts the survey by targeting the key audience, thus gaining insights from them. Based on the perspectives of the customers, this information is utilized to formulate market strategies. Moreover, market surveys helps us to understand the current competitive situation of the industry. To be precise, our survey process typically involve with the 360 analysis of the market. This analytical process begins by identifying the prospective customers for a product or service related to the market/industry to obtain data on how a product/service could fit into customers’ lives.

Secondary Research: The secondary data sources includes information published by the on-profit organizations such as World bank, WHO, company fillings, investor presentations, annual reports, national government documents, statistical databases, blogs, articles, white papers and others. From the annual report, we analyse a company’s revenue to understand the key segment and market share of that organization in a particular region. We analyse the company websites and adopt the product mapping technique which is important for deriving the segment revenue. In the product mapping method, we select and categorize the products offered by the companies catering to domain specific market, deduce the product revenue for each of the companies so as to get overall estimation of the market size. We also source data and analyses trends based on information received from supply side and demand side intermediaries in the value chain. The supply side denotes the data gathered from supplier, distributor, wholesaler and the demand side illustrates the data gathered from the end customers for respective market domain.

The supply side for a domain specific market is analysed by:
The demand side for the market is estimated through:
In-house Library: Apart from these third-party sources, we have our in-house library of qualitative and quantitative information. Our in-house database includes market data for various industry and domains. These data are updated on regular basis as per the changing market scenario. Our library includes, historic databases, internal audit reports and archives.
Sometimes there are instances where there is no metadata or raw data available for any domain specific market. For those cases, we use our expertise to forecast and estimate the market size in order to generate comprehensive data sets. Our analyst team adopt a robust research technique in order to produce the estimates:
Data Synthesis: This stage involves the analysis & mapping of all the information obtained from the previous step. It also involves in scrutinizing the data for any discrepancy observed while data gathering related to the market. The data is collected with consideration to the heterogeneity of sources. Robust scientific techniques are in place for synthesizing disparate data sets and provide the essential contextual information that can orient market strategies. The Brainy Insights has extensive experience in data synthesis where the data passes through various stages:


Market Deduction & Formulation: The final stage comprises of assigning data points at appropriate market spaces so as to deduce feasible conclusions. Analyst perspective & subject matter expert based holistic form of market sizing coupled with industry analysis also plays a crucial role in this stage.
This stage involves in finalization of the market size and numbers that we have collected from data integration step. With data interpolation, it is made sure that there is no gap in the market data. Successful trend analysis is done by our analysts using extrapolation techniques, which provide the best possible forecasts for the market.
Data Validation & Market Feedback: Validation is the most important step in the process. Validation & re-validation via an intricately designed process helps us finalize data-points to be used for final calculations.

The Brainy Insights interacts with leading companies and experts of the concerned domain to develop the analyst team’s market understanding and expertise. It improves and substantiates every single data presented in the market reports. The data validation interview and discussion panels are typically composed of the most experienced industry members. The participants include, however, are not limited to:
Moreover, we always validate our data and findings through primary respondents from all the major regions we are working on.


Free Customization
Fortune 500 Clients
Free Yearly Update On Purchase Of Multi/Corporate License
Companies Served Till Date