- +1-315-215-1633
- sales@thebrainyinsights.com

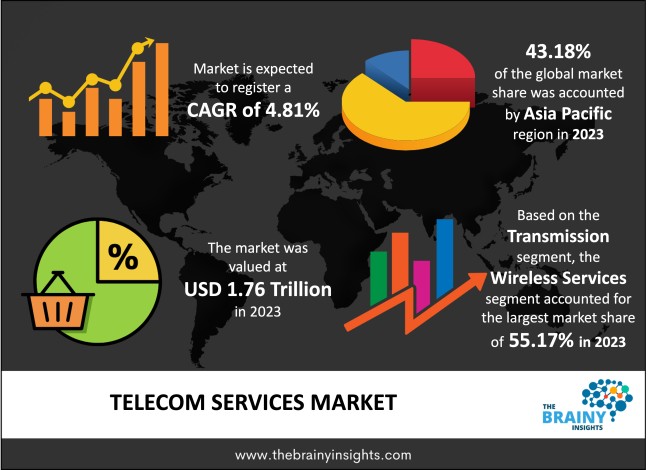
The global telecom services market was valued at USD 1.76 Trillion in 2023, growing at a CAGR of 4.81% from 2024 to 2033. The market is expected to reach USD 2.81 Trillion by 2033. The growing demand for high-speed data connectivity for suitable Internet of Things (IoT) applications, like smart home energy management, is expected to propel the market growth.
Telecommunications, or telecom, is the electronic exchange of information over significant distances & refers to all kinds of voice, data and video transmission. Telecom services consist of services telecommunication firms provide to make connectivity possible worldwide. This is done via the phone or the internet, wired or wireless. The offerings include telephone, voice, internet, video, and communication services. Telephone administration, which can be done wireless or wired, is the most well-known type of media communications administration. Telecom equipment contains the devices customers use to communicate, like modems, phones, landlines, wireless infrastructure equipment & networking machines like Wi-Fi routers. The types of companies that work in the telecom equipment subset include phone, computer, and semiconductor manufacturers. The telecommunication service sector is experiencing substantial change due to several factors, such as the deployment of 5G technology, the surge in the use of sophisticated communication technologies and the growing use of IoT device connectivity.
Get an overview of this study by requesting a free sample
The widespread adoption of cellular networks: The increasing expenditures on wireless communication infrastructures due to the shift in consumer preferences towards mobile devices and cloud-based technology drive the market growth. Moreover, the migration of business applications and services to the cloud and the rising penetration of 4G and 5G are expected to drive market growth over the forecast period. Additionally, the migration of cellular instruments from characteristic phones to 5G-enabled smartphones has provoked an enormous demand for high bandwidth connectivity, enhanced voice services, and other value-added services, which are helping to boost market growth.
The high capital investments: The lack of expertise and infrastructure in rural areas restrain market growth. Further, the lack of high-quality services in rural areas & most people in these areas being unaware of how to use cellular instruments also hinder the market growth over the forecast period.
Technological advancements: The growing availability of futuristic technologies is an opportunity for market growth. Further, the rising exponential growth in global IP and cloud traffic will drive market growth during the forecast period. Further, the increasing technological advancements and modernization of in-network services are helping to drive market growth. Moreover, the evolution of the mobile industry and rising government initiatives on digital integration are expected to drive market growth over the forecast period. However, the rising deployment of cellular IoT modules in smart city infrastructure & building industrialization verticals is expected to propel the market growth over the forecast period.
The regions analyzed for the market include North America, Europe, South America, Asia Pacific, the Middle East, and Africa. Asia Pacific emerged as the largest global telecom services market, with a 43.18% market revenue share in 2023. The rapidly growing population, rising internet penetration rate, and significant adoption of smartphones are expected to propel market growth in this region. Moreover, the early adoption of digitized technologies and high customer spending is expected to drive market growth in this region. Additionally, the raised focus on digitalization initiatives by governments across different economies, including Singapore, India, and China, propels market growth over the forecast period. However, the increasing spending on 5G infrastructure implementation due to a change in customer inclination toward next-generation technology and smartphone devices is helping to stimulate market growth. The North American region will account for the largest market share with revenue growth. This growth is attributed to the increasing activity of key market players. Further, several factors, including a highly developed technical infrastructure and the rising network traffic with high customer churn & falling exchange rates, are expected to drive market growth in this region. Additionally, the increasing mobile ecosystem, machine learning, artificial intelligence, and value-added managed services are helping to boost market growth in this region. However, an increase in demand for internet-based communication services among SMEs is also helping to boost the market growth in this region.
Asia Pacific Region Telecom Services Market Share in 2023 - 43.18%
www.thebrainyinsights.com
Check the geographical analysis of this market by requesting a free sample
The transmission segment is divided into wireless services and wireline services. The wireless services segment dominated the market, with a share of around 55.17% in 2023. This growth is attributed to the augmenting demand for mobile services among consumers and businesses.
The service segment is divided into fixed internet access services, fixed voice services, machine-to-machine (mobile IoT) services, pay-tv services, mobile data services, and mobile voice services. The mobile data services segment dominated the market, with a market share of around 28.11% in 2023. This growth is attributed to the rapidly increasing usage of data services for applications like smartphones, cloud augmented reality (AR) & virtual reality (VR) gaming, OTT, smart cities, and UHD video access.
The end-user segment is divided into corporates, residential, hospitals, offices, and others. The residential segment dominated the market, with a market share of around 34.18% in 2023. This growth is attributed to the growing trend of using ultra-high-definition videos and online gaming.
| Attribute | Description |
|---|---|
| Market Size | Revenue (USD Trillion) |
| Market size value in 2023 | USD 1.76 Trillion |
| Market size value in 2033 | USD 2.81 Trillion |
| CAGR (2024 to 2033) | 4.81% |
| Historical data | 2020-2022 |
| Base Year | 2023 |
| Forecast | 2024-2033 |
| Region | The regions analyzed for the market are Asia Pacific, Europe, South America, North America, and Middle East & Africa. Furthermore, the regions are further analyzed at the country level. |
| Segments | Transmission, Service, and End-User |
Asia Pacific region emerged as the largest market for telecom services.
The market's growth will be influenced by the widespread adoption of cellular networks.
The high capital investments could hamper the market growth.
The growing availability of futuristic technologies will provide huge opportunities to the market.
1. Introduction
1.1. Objectives of the Study
1.2. Market Definition
1.3. Research Scope
1.4. Currency
1.5. Key Target Audience
2. Research Methodology and Assumptions
3. Executive Summary
4. Premium Insights
4.1. Porter’s Five Forces Analysis
4.2. Value Chain Analysis
4.3. Top Investment Pockets
4.3.1. Market Attractiveness Analysis By Transmission
4.3.2. Market Attractiveness Analysis By Service
4.3.3. Market Attractiveness Analysis By End-User
4.3.4. Market Attractiveness Analysis By Region
4.4. Industry Trends
5. Market Dynamics
5.1. Market Evaluation
5.2. Drivers
5.2.1. The growing usage of smartphones among consumers
5.2.2. The widespread adoption of cellular networks
5.3. Restraints
5.3.1. The technical issues related to telecommunication services and networks
5.3.2. The lack of expertise and infrastructure in rural areas
5.4. Opportunities
5.4.1. The growing availability of futuristic technologies
5.4.2. Increased demand for high-speed broadband connections
6. Global Telecom Services Market Analysis and Forecast, By Transmission
6.1. Segment Overview
6.2. Wireless Services
6.3. Wireline Services
7. Global Telecom Services Market Analysis and Forecast, By Service
7.1. Segment Overview
7.2. Fixed Internet Access Services
7.3. Fixed Voice Services
7.4. Machine-to-Machine (Mobile IoT) Services
7.5. Pay-TV Services
7.6. Mobile Data Services
7.7. Mobile Voice Services
8. Global Telecom Services Market Analysis and Forecast, By End-User
8.1. Segment Overview
8.2. Corporates
8.3. Residential
8.4. Hospitals
8.5. Offices
8.6. Others
9. Global Telecom Services Market Analysis and Forecast, By Regional Analysis
9.1. Segment Overview
9.2. North America
9.2.1. U.S.
9.2.2. Canada
9.2.3. Mexico
9.3. Europe
9.3.1. Germany
9.3.2. France
9.3.3. U.K.
9.3.4. Italy
9.3.5. Spain
9.4. Asia-Pacific
9.4.1. Japan
9.4.2. China
9.4.3. India
9.5. South America
9.5.1. Brazil
9.6. Middle East and Africa
9.6.1. UAE
9.6.2. South Africa
10. Global Telecom Services Market-Competitive Landscape
10.1. Overview
10.2. Market Share of Key Players in Global Telecom Services Market
10.2.1. Global Company Market Share
10.2.2. North America Company Market Share
10.2.3. Europe Company Market Share
10.2.4. APAC Company Market Share
10.3. Competitive Situations and Trends
10.3.1. Product Launches and Developments
10.3.2. Partnerships, Collaborations, and Agreements
10.3.3. Mergers & Acquisitions
10.3.4. Expansions
11. Company Profiles
11.1. NTT
11.1.1. Business Overview
11.1.2. Company Snapshot
11.1.3. Company Market Share Analysis
11.1.4. Company Product Portfolio
11.1.5. Recent Developments
11.1.6. SWOT Analysis
11.2. AT&T Inc.
11.2.1. Business Overview
11.2.2. Company Snapshot
11.2.3. Company Market Share Analysis
11.2.4. Company Product Portfolio
11.2.5. Recent Developments
11.2.6. SWOT Analysis
11.3. China Mobile Ltd
11.3.1. Business Overview
11.3.2. Company Snapshot
11.3.3. Company Market Share Analysis
11.3.4. Company Product Portfolio
11.3.5. Recent Developments
11.3.6. SWOT Analysis
11.4. Verizon Communications Inc.
11.4.1. Business Overview
11.4.2. Company Snapshot
11.4.3. Company Market Share Analysis
11.4.4. Company Product Portfolio
11.4.5. Recent Developments
11.4.6. SWOT Analysis
11.5. SoftBank Group Corp
11.5.1. Business Overview
11.5.2. Company Snapshot
11.5.3. Company Market Share Analysis
11.5.4. Company Product Portfolio
11.5.5. Recent Developments
11.5.6. SWOT Analysis
11.6. Deutsche Telekom AG
11.6.1. Business Overview
11.6.2. Company Snapshot
11.6.3. Company Market Share Analysis
11.6.4. Company Product Portfolio
11.6.5. Recent Developments
11.6.6. SWOT Analysis
11.7. Telefonica SA
11.7.1. Business Overview
11.7.2. Company Snapshot
11.7.3. Company Market Share Analysis
11.7.4. Company Product Portfolio
11.7.5. Recent Developments
11.7.6. SWOT Analysis
11.8. China Telecom Corp Ltd
11.8.1. Business Overview
11.8.2. Company Snapshot
11.8.3. Company Market Share Analysis
11.8.4. Company Product Portfolio
11.8.5. Recent Developments
11.8.6. SWOT Analysis
11.9. Vodafone Group
11.9.1. Business Overview
11.9.2. Company Snapshot
11.9.3. Company Market Share Analysis
11.9.4. Company Product Portfolio
11.9.5. Recent Developments
11.9.6. SWOT Analysis
11.10. Telefonica SA
11.10.1. Business Overview
11.10.2. Company Snapshot
11.10.3. Company Market Share Analysis
11.10.4. Company Product Portfolio
11.10.5. Recent Developments
11.10.6. SWOT Analysis
11.11. Bharati Airtel Limited
11.11.1. Business Overview
11.11.2. Company Snapshot
11.11.3. Company Market Share Analysis
11.11.4. Company Product Portfolio
11.11.5. Recent Developments
11.11.6. SWOT Analysis
11.12. Telefonica SA
11.12.1. Business Overview
11.12.2. Company Snapshot
11.12.3. Company Market Share Analysis
11.12.4. Company Product Portfolio
11.12.5. Recent Developments
11.12.6. SWOT Analysis
11.13. Reliance Jio Infocomm Limited
11.13.1. Business Overview
11.13.2. Company Snapshot
11.13.3. Company Market Share Analysis
11.13.4. Company Product Portfolio
11.13.5. Recent Developments
11.13.6. SWOT Analysis
11.14. Comcast Corporation
11.14.1. Business Overview
11.14.2. Company Snapshot
11.14.3. Company Market Share Analysis
11.14.4. Company Product Portfolio
11.14.5. Recent Developments
11.14.6. SWOT Analysis
11.15. KDDI Corporation
11.15.1. Business Overview
11.15.2. Company Snapshot
11.15.3. Company Market Share Analysis
11.15.4. Company Product Portfolio
11.15.5. Recent Developments
11.15.6. SWOT Analysis
11.16. BT Group plc.
11.16.1. Business Overview
11.16.2. Company Snapshot
11.16.3. Company Market Share Analysis
11.16.4. Company Product Portfolio
11.16.5. Recent Developments
11.16.6. SWOT Analysis
11.17. Orange SA
11.17.1. Business Overview
11.17.2. Company Snapshot
11.17.3. Company Market Share Analysis
11.17.4. Company Product Portfolio
11.17.5. Recent Developments
11.17.6. SWOT Analysis
11.18. KT Corporation
11.18.1. Business Overview
11.18.2. Company Snapshot
11.18.3. Company Market Share Analysis
11.18.4. Company Product Portfolio
11.18.5. Recent Developments
11.18.6. SWOT Analysis
List of Table
1. Global Telecom Services Market, By Transmission, 2020 to 2033 (USD Trillion)
2. Global Wireless Services, Telecom Services Market, By Region, 2020 to 2033 (USD Trillion)
3. Global Wireline Services, Telecom Services Market, By Region, 2020 to 2033 (USD Trillion)
4. Global Telecom Services Market, By Service, 2020 to 2033 (USD Trillion)
5. Global Fixed Internet Access Services, Telecom Services Market, By Region, 2020 to 2033 (USD Trillion)
6. Global Fixed Voice Services, Telecom Services Market, By Region, 2020 to 2033 (USD Trillion)
7. Global Machine-to-Machine (Mobile IoT) Services, Telecom Services Market, By Region, 2020 to 2033 (USD Trillion)
8. Global Pay-TV Services, Telecom Services Market, By Region, 2020 to 2033 (USD Trillion)
9. Global Mobile Data Services, Telecom Services Market, By Region, 2020 to 2033 (USD Trillion)
10. Global Mobile Voice Services, Telecom Services Market, By Region, 2020 to 2033 (USD Trillion)
11. Global Telecom Services Market, By End-User, 2020 to 2033 (USD Trillion)
12. Global Corporates, Telecom Services Market, By Region, 2020 to 2033 (USD Trillion)
13. Global Residential, Telecom Services Market, By Region, 2020 to 2033 (USD Trillion)
14. Global Hospitals, Telecom Services Market, By Region, 2020 to 2033 (USD Trillion)
15. Global Offices, Telecom Services Market, By Region, 2020 to 2033 (USD Trillion)
16. Global Others, Telecom Services Market, By Region, 2020 to 2033 (USD Trillion)
17. North America Telecom Services Market, By Transmission, 2020 to 2033 (USD Trillion)
18. North America Telecom Services Market, By Service, 2020 to 2033 (USD Trillion)
19. North America Telecom Services Market, By End-User, 2020 to 2033 (USD Trillion)
20. U.S. Telecom Services Market, By Transmission, 2020 to 2033 (USD Trillion)
21. U.S. Telecom Services Market, By Service, 2020 to 2033 (USD Trillion)
22. U.S. Telecom Services Market, By End-User, 2020 to 2033 (USD Trillion)
23. Canada Telecom Services Market, By Transmission, 2020 to 2033 (USD Trillion)
24. Canada Telecom Services Market, By Service, 2020 to 2033 (USD Trillion)
25. Canada Telecom Services Market, By End-User, 2020 to 2033 (USD Trillion)
26. Mexico Telecom Services Market, By Transmission, 2020 to 2033 (USD Trillion)
27. Mexico Telecom Services Market, By Service, 2020 to 2033 (USD Trillion)
28. Mexico Telecom Services Market, By End-User, 2020 to 2033 (USD Trillion)
29. Europe Telecom Services Market, By Transmission, 2020 to 2033 (USD Trillion)
30. Europe Telecom Services Market, By Service, 2020 to 2033 (USD Trillion)
31. Europe Telecom Services Market, By End-User, 2020 to 2033 (USD Trillion)
32. Germany Telecom Services Market, By Transmission, 2020 to 2033 (USD Trillion)
33. Germany Telecom Services Market, By Service, 2020 to 2033 (USD Trillion)
34. Germany Telecom Services Market, By End-User, 2020 to 2033 (USD Trillion)
35. France Telecom Services Market, By Transmission, 2020 to 2033 (USD Trillion)
36. France Telecom Services Market, By Service, 2020 to 2033 (USD Trillion)
37. France Telecom Services Market, By End-User, 2020 to 2033 (USD Trillion)
38. U.K. Telecom Services Market, By Transmission, 2020 to 2033 (USD Trillion)
39. U.K. Telecom Services Market, By Service, 2020 to 2033 (USD Trillion)
40. U.K. Telecom Services Market, By End-User, 2020 to 2033 (USD Trillion)
41. Italy Telecom Services Market, By Transmission, 2020 to 2033 (USD Trillion)
42. Italy Telecom Services Market, By Service, 2020 to 2033 (USD Trillion)
43. Italy Telecom Services Market, By End-User, 2020 to 2033 (USD Trillion)
44. Spain Telecom Services Market, By Transmission, 2020 to 2033 (USD Trillion)
45. Spain Telecom Services Market, By Service, 2020 to 2033 (USD Trillion)
46. Spain Telecom Services Market, By End-User, 2020 to 2033 (USD Trillion)
47. Asia Pacific Telecom Services Market, By Transmission, 2020 to 2033 (USD Trillion)
48. Asia Pacific Telecom Services Market, By Service, 2020 to 2033 (USD Trillion)
49. Asia Pacific Telecom Services Market, By End-User, 2020 to 2033 (USD Trillion)
50. Japan Telecom Services Market, By Transmission, 2020 to 2033 (USD Trillion)
51. Japan Telecom Services Market, By Service, 2020 to 2033 (USD Trillion)
52. Japan Telecom Services Market, By End-User, 2020 to 2033 (USD Trillion)
53. China Telecom Services Market, By Transmission, 2020 to 2033 (USD Trillion)
54. China Telecom Services Market, By Service, 2020 to 2033 (USD Trillion)
55. China Telecom Services Market, By End-User, 2020 to 2033 (USD Trillion)
56. India Telecom Services Market, By Transmission, 2020 to 2033 (USD Trillion)
57. India Telecom Services Market, By Service, 2020 to 2033 (USD Trillion)
58. India Telecom Services Market, By End-User, 2020 to 2033 (USD Trillion)
59. South America Telecom Services Market, By Transmission, 2020 to 2033 (USD Trillion)
60. South America Telecom Services Market, By Service, 2020 to 2033 (USD Trillion)
61. South America Telecom Services Market, By End-User, 2020 to 2033 (USD Trillion)
62. Brazil Telecom Services Market, By Transmission, 2020 to 2033 (USD Trillion)
63. Brazil Telecom Services Market, By Service, 2020 to 2033 (USD Trillion)
64. Brazil Telecom Services Market, By End-User, 2020 to 2033 (USD Trillion)
65. Middle East and Africa Telecom Services Market, By Transmission, 2020 to 2033 (USD Trillion)
66. Middle East and Africa Telecom Services Market, By Service, 2020 to 2033 (USD Trillion)
67. Middle East and Africa Telecom Services Market, By End-User, 2020 to 2033 (USD Trillion)
68. UAE Telecom Services Market, By Transmission, 2020 to 2033 (USD Trillion)
69. UAE Telecom Services Market, By Service, 2020 to 2033 (USD Trillion)
70. UAE Telecom Services Market, By End-User, 2020 to 2033 (USD Trillion)
71. South Africa Telecom Services Market, By Transmission, 2020 to 2033 (USD Trillion)
72. South Africa Telecom Services Market, By Service, 2020 to 2033 (USD Trillion)
73. South Africa Telecom Services Market, By End-User, 2020 to 2033 (USD Trillion)
List of Figures
1. Global Telecom Services Market Segmentation
2. Global Telecom Services Market: Research Methodology
3. Market Size Estimation Methodology: Bottom-Up Approach
4. Market Size Estimation Methodology: Top- Approach
5. Data Triangulation
6. Porter’s Five Forces Analysis
7. Value Chain Analysis
8. Global Telecom Services Market Attractiveness Analysis By Transmission
9. Global Telecom Services Market Attractiveness Analysis By Service
10. Global Telecom Services Market Attractiveness Analysis By End-User
11. Global Telecom Services Market Attractiveness Analysis By Region
12. Global Telecom Services Market: Dynamics
13. Global Telecom Services Market Share By Transmission (2023 & 2033)
14. Global Telecom Services Market Share By Service (2023 & 2033)
15. Global Telecom Services Market Share By End-User (2023 & 2033)
16. Global Telecom Services Market Share By Regions (2023 & 2033)
17. Global Telecom Services Market Share By Company (2023)
This study forecasts revenue at global, regional, and country levels from 2020 to 2033. The Brainy Insights has segmented the global telecom services based on below mentioned segments:
Global Telecom Services Market by Transmission:
Global Telecom Services Market by Service:
Global Telecom Services Market by End-User:
Global Telecom Services by Region:
Research has its special purpose to undertake marketing efficiently. In this competitive scenario, businesses need information across all industry verticals; the information about customer wants, market demand, competition, industry trends, distribution channels etc. This information needs to be updated regularly because businesses operate in a dynamic environment. Our organization, The Brainy Insights incorporates scientific and systematic research procedures in order to get proper market insights and industry analysis for overall business success. The analysis consists of studying the market from a miniscule level wherein we implement statistical tools which helps us in examining the data with accuracy and precision.
Our research reports feature both; quantitative and qualitative aspects for any market. Qualitative information for any market research process are fundamental because they reveal the customer needs and wants, usage and consumption for any product/service related to a specific industry. This in turn aids the marketers/investors in knowing certain perceptions of the customers. Qualitative research can enlighten about the different product concepts and designs along with unique service offering that in turn, helps define marketing problems and generate opportunities. On the other hand, quantitative research engages with the data collection process through interviews, e-mail interactions, surveys and pilot studies. Quantitative aspects for the market research are useful to validate the hypotheses generated during qualitative research method, explore empirical patterns in the data with the help of statistical tools, and finally make the market estimations.
The Brainy Insights offers comprehensive research and analysis, based on a wide assortment of factual insights gained through interviews with CXOs and global experts and secondary data from reliable sources. Our analysts and industry specialist assume vital roles in building up statistical tools and analysis models, which are used to analyse the data and arrive at accurate insights with exceedingly informative research discoveries. The data provided by our organization have proven precious to a diverse range of companies, facilitating them to address issues such as determining which products/services are the most appealing, whether or not customers use the product in the manner anticipated, the purchasing intentions of the market and many others.
Our research methodology encompasses an idyllic combination of primary and secondary initiatives. Key phases involved in this process are listed below:

The phase involves the gathering and collecting of market data and its related information with the help of different sources & research procedures.

The data procurement stage involves in data gathering and collecting through various data sources.
This stage involves in extensive research. These data sources includes:
Purchased Database: Purchased databases play a crucial role in estimating the market sizes irrespective of the domain. Our purchased database includes:
Primary Research: The Brainy Insights interacts with leading companies and experts of the concerned domain to develop the analyst team’s market understanding and expertise. It improves and substantiates every single data presented in the market reports. Primary research mainly involves in telephonic interviews, E-mail interactions and face-to-face interviews with the raw material providers, manufacturers/producers, distributors, & independent consultants. The interviews that we conduct provides valuable data on market size and industry growth trends prevailing in the market. Our organization also conducts surveys with the various industry experts in order to gain overall insights of the industry/market. For instance, in healthcare industry we conduct surveys with the pharmacists, doctors, surgeons and nurses in order to gain insights and key information of a medical product/device/equipment which the customers are going to usage. Surveys are conducted in the form of questionnaire designed by our own analyst team. Surveys plays an important role in primary research because surveys helps us to identify the key target audiences of the market. Additionally, surveys helps to identify the key target audience engaged with the market. Our survey team conducts the survey by targeting the key audience, thus gaining insights from them. Based on the perspectives of the customers, this information is utilized to formulate market strategies. Moreover, market surveys helps us to understand the current competitive situation of the industry. To be precise, our survey process typically involve with the 360 analysis of the market. This analytical process begins by identifying the prospective customers for a product or service related to the market/industry to obtain data on how a product/service could fit into customers’ lives.

Secondary Research: The secondary data sources includes information published by the on-profit organizations such as World bank, WHO, company fillings, investor presentations, annual reports, national government documents, statistical databases, blogs, articles, white papers and others. From the annual report, we analyse a company’s revenue to understand the key segment and market share of that organization in a particular region. We analyse the company websites and adopt the product mapping technique which is important for deriving the segment revenue. In the product mapping method, we select and categorize the products offered by the companies catering to domain specific market, deduce the product revenue for each of the companies so as to get overall estimation of the market size. We also source data and analyses trends based on information received from supply side and demand side intermediaries in the value chain. The supply side denotes the data gathered from supplier, distributor, wholesaler and the demand side illustrates the data gathered from the end customers for respective market domain.

The supply side for a domain specific market is analysed by:
The demand side for the market is estimated through:
In-house Library: Apart from these third-party sources, we have our in-house library of qualitative and quantitative information. Our in-house database includes market data for various industry and domains. These data are updated on regular basis as per the changing market scenario. Our library includes, historic databases, internal audit reports and archives.
Sometimes there are instances where there is no metadata or raw data available for any domain specific market. For those cases, we use our expertise to forecast and estimate the market size in order to generate comprehensive data sets. Our analyst team adopt a robust research technique in order to produce the estimates:
Data Synthesis: This stage involves the analysis & mapping of all the information obtained from the previous step. It also involves in scrutinizing the data for any discrepancy observed while data gathering related to the market. The data is collected with consideration to the heterogeneity of sources. Robust scientific techniques are in place for synthesizing disparate data sets and provide the essential contextual information that can orient market strategies. The Brainy Insights has extensive experience in data synthesis where the data passes through various stages:


Market Deduction & Formulation: The final stage comprises of assigning data points at appropriate market spaces so as to deduce feasible conclusions. Analyst perspective & subject matter expert based holistic form of market sizing coupled with industry analysis also plays a crucial role in this stage.
This stage involves in finalization of the market size and numbers that we have collected from data integration step. With data interpolation, it is made sure that there is no gap in the market data. Successful trend analysis is done by our analysts using extrapolation techniques, which provide the best possible forecasts for the market.
Data Validation & Market Feedback: Validation is the most important step in the process. Validation & re-validation via an intricately designed process helps us finalize data-points to be used for final calculations.

The Brainy Insights interacts with leading companies and experts of the concerned domain to develop the analyst team’s market understanding and expertise. It improves and substantiates every single data presented in the market reports. The data validation interview and discussion panels are typically composed of the most experienced industry members. The participants include, however, are not limited to:
Moreover, we always validate our data and findings through primary respondents from all the major regions we are working on.


Free Customization
Fortune 500 Clients
Free Yearly Update On Purchase Of Multi/Corporate License
Companies Served Till Date