- +1-315-215-1633
- sales@thebrainyinsights.com

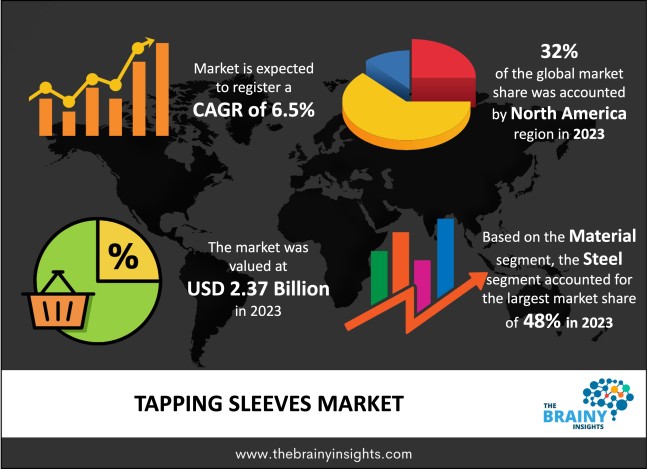
Global tapping sleeves market is projected to reach USD 4.44 billion by 2033, at a CAGR of 6.5% from 2024 to 2033. Global tapping sleeves market is growing at a steady growth rate, owing to the growth in the levels of fluid transportation and distribution. The demand for tapping sleeves is increasing due to infrastructure development. This is because the need for water supply and gas distribution networks will also increase due to infrastructure development. Along with this, there is also a need to upgrade the existing aging infrastructure, so due to this also the demand for tapping sleeves is high.
A tapping sleeve provides entry to an existing water main and branching off it. Tapping sleeves are extra piping components that are mounted on the piping systems to divert the water supply/flow from the existing main pipes. The term' tapping' implies entering the current water main. Tapping typically classifies as entering the already established water system and this method requires the use of tapping sleeves for its performance. When growing urbanization and discharge of wastewater go side by side, the pipeline network needs to be extended accordingly. There is growing addition across the globe throughout the pipeline network; contrarily, the current pipelines cannot be interrupted. In this situation, pipelines are used to attach a connection to the current pipelines. This tapping process is carried out using a tapping sleeve that is put on the pipe. This sleeve is equipped with a tapping valve, and a tapping machine is linked to the tapping valve for drilling the pipe. The tapping machine uses an extendable shaft to continue the pipe wall via the tapping sleeve. Tapping sleeves are mainly made of stainless steel, and are typically two piece assemblies apart from the bolts/etc. The first piece includes a flange on it which will be mounted on a rubber gasketed saddle that will finally be put over the current pipe. The second piece is placed on gasketted saddle on the opposite side of the pipe attached to it. The bolts are then tightened to appropriate torque.
Get an overview of this study by requesting a free sample
The global demand for fluid transportation such as wastewater, water, petroleum, and oil and gas products are increasing primarily due to the increasing population. Thus, the need for tapping sleeves is also increasing, thereby boosting tapping sleeves market.
Local manufacturers offer tapping sleeves at a price lower than the existing market price levels. Countries in Asia, such as India and China, are witnessing growing numbers of unorganized local tapping sleeve producers. Global producers are concentrating on expanding into emerging countries like China and India. Nevertheless, the existence of a substantial number of producers of unorganized tapping sleeves is anticipated to hamper the entrance of new tapping sleeve suppliers into such emerging markets.
Countries with unequal water supply are progressively relying on water distributed through pipeline networks. Consequently, governments, along with private investors, are rapidly involved in new pipeline projects aimed at transporting water from long distances, including cross borders. Thus, providing huge opportunity to the market growth.
The global tapping sleeves market has been segmented based on material, inches, fluid motion, application and regions.
The regions evaluated for the tapping sleeves market include North America, Europe, South America, Asia Pacific, and the Middle East and Africa. North America region is anticipated to maintain its major share in the market with around 32% of the total market share in 2023.
North America Tapping Sleeves Market Share in 2023 - 32%
www.thebrainyinsights.com
Check the geographical analysis of this market by requesting a free sample
The key players are now concentrating on implementing strategies like adopting new technology, product innovations, mergers & acquisitions, joint venture, alliances, and partnerships to improve their market position in the global tapping sleeves industry.
In July 2017, Mueller Water Supplies, Inc. revealed the introduction of a new tapping sleeve constructed from imported steel, designed for thick plastic wall pipes and hot tapping ductile iron pipes. The "H-306" coded product is constructed from fabricated steel and it has a nylon coating that can withstand pressures of up to 300psi. The package is 4-16'' in dimension.
In May 2019, AMERICAN declared that they have founded a new company concentrated on valve and hydrant research and development. "AMERICAN Flow Control Center for Innovative Excellence" will be established in Crawfordsville, Indiana, USA. For its construction the building would be constructed over thirty-thousand square-foot costs in the USD 9-12 million range. This plant would concentrate on advances and technical advancement with the new valve-and hydrant-related equipment and products to be utilized in a broad variety of applications.
As per The Brainy Insights, the size of the tapping sleeves market was valued at USD 2.37 billion in 2023 and is anticipated to reach USD 4.44 billion by 2033.
Global tapping sleeves market is growing at a CAGR of 6.5% during the forecast period 2024-2033.
The Asia Pacific region emerged as the largest market for the tapping sleeves.
Growth in the levels of fluid transportation and distribution is the key driving factor for the tapping sleeves market.
Presence of unorganized manufacturers providing low-cost alternative may hamper the market growth.
Initiatives undertaken by government authorities will provide huge opportunities to the market.
Key players are AMERICAN (American Cast Iron Pipe Company), Everett J. Prescott, Inc., JCM Industries Inc., Mueller Water Products, Petersen Products Co., PowerSeal Corporation
1. Introduction
1.1. Objectives of the Study
1.2. Market Definition
1.3. Research Scope
1.4. Currency
1.5. Key Target Audience
2. Research Methodology and Assumptions
3. Executive Summary
4. Premium Insights
4.1. Porter’s Five Forces Analysis
4.2. Value Chain Analysis
4.3. Top Investment Pockets
4.3.1. Market Attractiveness Analysis By Material
4.3.2. Market Attractiveness Analysis By Inches
4.3.3. Market Attractiveness Analysis By Fluid Motion
4.3.4. Market Attractiveness Analysis By Application
4.3.5. Market Attractiveness Analysis By Region
4.4. Industry Trends
5. Market Dynamics
5.1. Market Evaluation
5.2. Drivers
5.2.1. Growth in the levels of fluid transportation and distribution
5.3. Restrains
5.3.1. Presence of unorganized manufacturers providing low-cost alternative
5.4. Opportunities
5.4.1. Initiatives undertaken by government authorities
6. Global Tapping Sleeves Market Analysis and Forecast, By Material
6.1. Segment Overview
6.2. Steel
6.3. Ductile iron
6.4. Cast iron
7. Global Tapping Sleeves Market Analysis and Forecast, By Inches
7.1. Segment Overview
7.2. 1-10
7.3. 11-20
7.4. 21-30
7.5. 31-40
7.6. Above 40
8. Global Tapping Sleeves Market Analysis and Forecast, By Fluid Motion
8.1. Segment Overview
8.2. Liquid
8.3. Gas
8.4. Oil
9. Global Tapping Sleeves Market Analysis and Forecast, By Application
9.1. Segment Overview
9.2. Drinking Water Distribution
9.3. Wastewater Systems
9.4. Gas Solution
9.5. Petroleum Solution
10. Global Tapping Sleeves Market Analysis and Forecast, By Regional Analysis
10.1. Segment Overview
10.2. North America
10.2.1. U.S.
10.2.2. Canada
10.2.3. Mexico
10.3. Europe
10.3.1. Germany
10.3.2. France
10.3.3. U.K.
10.3.4. Italy
10.3.5. Spain
10.4. Asia-Pacific
10.4.1. Japan
10.4.2. China
10.4.3. India
10.5. South America
10.5.1. Brazil
10.6. Middle East and Africa
10.6.1. UAE
10.6.2. South Africa
11. Global Tapping Sleeves Market-Competitive Landscape
11.1. Overview
11.2. Market Share of Key Players in Global Tapping Sleeves Market
11.2.1. Global Company Market Share
11.2.2. North America Company Market Share
11.2.3. Europe Company Market Share
11.2.4. APAC Company Market Share
11.3. Competitive Situations and Trends
11.3.1. Product Launches and Developments
11.3.2. Partnerships, Collaborations, and Agreements
11.3.3. Mergers & Acquisitions
11.3.4. Expansions
12. Company Profiles
12.1. AMERICAN (American Cast Iron Pipe Company)
12.1.1. Business Overview
12.1.2. Company Snapshot
12.1.3. Company Market Share Analysis
12.1.4. Company Product Portfolio
12.1.5. Recent Developments
12.1.6. SWOT Analysis
12.2. Everett J. Prescott, Inc.
12.2.1. Business Overview
12.2.2. Company Snapshot
12.2.3. Company Market Share Analysis
12.2.4. Company Product Portfolio
12.2.5. Recent Developments
12.2.6. SWOT Analysis
12.3. JCM Industries Inc.
12.3.1. Business Overview
12.3.2. Company Snapshot
12.3.3. Company Market Share Analysis
12.3.4. Company Product Portfolio
12.3.5. Recent Developments
12.3.6. SWOT Analysis
12.4. Mueller Water Products
12.4.1. Business Overview
12.4.2. Company Snapshot
12.4.3. Company Market Share Analysis
12.4.4. Company Product Portfolio
12.4.5. Recent Developments
12.4.6. SWOT Analysis
12.5. Petersen Products Co.
12.5.1. Business Overview
12.5.2. Company Snapshot
12.5.3. Company Market Share Analysis
12.5.4. Company Product Portfolio
12.5.5. Recent Developments
12.5.6. SWOT Analysis
12.6. PowerSeal Corporation
12.6.1. Business Overview
12.6.2. Company Snapshot
12.6.3. Company Market Share Analysis
12.6.4. Company Product Portfolio
12.6.5. Recent Developments
12.6.6. SWOT Analysis
12.7. Robar Industries Ltd.
12.7.1. Business Overview
12.7.2. Company Snapshot
12.7.3. Company Market Share Analysis
12.7.4. Company Product Portfolio
12.7.5. Recent Developments
12.7.6. SWOT Analysis
12.8. Romac Industries, Inc.
12.8.1. Business Overview
12.8.2. Company Snapshot
12.8.3. Company Market Share Analysis
12.8.4. Company Product Portfolio
12.8.5. Recent Developments
12.8.6. SWOT Analysis
12.9. The Ford Meter Box Company, Inc.
12.9.1. Business Overview
12.9.2. Company Snapshot
12.9.3. Company Market Share Analysis
12.9.4. Company Product Portfolio
12.9.5. Recent Developments
12.9.6. SWOT Analysis
12.10. UTS Engineering
12.10.1. Business Overview
12.10.2. Company Snapshot
12.10.3. Company Market Share Analysis
12.10.4. Company Product Portfolio
12.10.5. Recent Developments
12.10.6. SWOT Analysis
List of Table
1. Global Tapping Sleeves Market, By Material, 2020–2033 (USD Billion)(Units)
2. Global Steel Market, By Region, 2020–2033 (USD Billion)(Units)
3. Global Ductile iron Market, By Region, 2020–2033 (USD Billion)(Units)
4. Global Cast iron Market, By Region, 2020–2033 (USD Billion)(Units)
5. Global Tapping Sleeves Market, By Inches, 2020–2033 (USD Billion)(Units)
6. Global 1-10 Tapping Sleeves Market, By Region, 2020–2033 (USD Billion)(Units)
7. Global 11-20 Tapping Sleeves Market, By Region, 2020–2033 (USD Billion)(Units)
8. Global 21-30 Tapping Sleeves Market, By Region, 2020–2033 (USD Billion)(Units)
9. Global 31-40 Tapping Sleeves Market, By Region, 2020–2033 (USD Billion)(Units)
10. Global Above 40 Tapping Sleeves Market, By Region, 2020–2033 (USD Billion)(Units)
11. Global Tapping Sleeves Market, By Fluid Motion, 2020–2033 (USD Billion)(Units)
12. Global Liquid Tapping Sleeves Market, By Region, 2020–2033 (USD Billion)(Units)
13. Global Gas Tapping Sleeves Market, By Region, 2020–2033 (USD Billion)(Units)
14. Global Oil Tapping Sleeves Market, By Region, 2020–2033 (USD Billion)(Units)
15. Global Tapping Sleeves Market, By Application, 2020–2033 (USD Billion)(Units)
16. Global Drinking Water Distribution Tapping Sleeves Market, By Region, 2020–2033 (USD Billion)(Units)
17. Global Wastewater Systems Tapping Sleeves Market, By Region, 2020–2033 (USD Billion)(Units)
18. Global Gas Solution Tapping Sleeves Market, By Region, 2020–2033 (USD Billion)(Units)
19. Global Petroleum Solution Tapping Sleeves Market, By Region, 2020–2033 (USD Billion)(Units)
20. Global Tapping Sleeves Market, By Region, 2020–2033 (USD Billion)(Units)
21. Global Tapping Sleeves Market, By North America, 2020–2033 (USD Billion)(Units)
22. North America Tapping Sleeves Market, By Material, 2020–2033 (USD Billion)(Units)
23. North America Tapping Sleeves Market, By Inches, 2020–2033 (USD Billion)(Units)
24. North America Tapping Sleeves Market, By Fluid Motion, 2020–2033 (USD Billion)(Units)
25. North America Tapping Sleeves Market, By Application, 2020–2033 (USD Billion)(Units)
26. U.S. Tapping Sleeves Market, By Material, 2020–2033 (USD Billion)(Units)
27. U.S. Tapping Sleeves Market, By Inches, 2020–2033 (USD Billion)(Units)
28. U.S. Tapping Sleeves Market, By Fluid Motion, 2020–2033 (USD Billion)(Units)
29. U.S. Tapping Sleeves Market, By Application, 2020–2033 (USD Billion)(Units)
30. Canada Tapping Sleeves Market, By Material, 2020–2033 (USD Billion)(Units)
31. Canada Tapping Sleeves Market, By Inches, 2020–2033 (USD Billion)(Units)
32. Canada Tapping Sleeves Market, By Fluid Motion, 2020–2033 (USD Billion)(Units)
33. Canada Tapping Sleeves Market, By Application, 2020–2033 (USD Billion)(Units)
34. Mexico Tapping Sleeves Market, By Material, 2020–2033 (USD Billion)(Units)
35. Mexico Tapping Sleeves Market, By Inches, 2020–2033 (USD Billion)(Units)
36. Mexico Tapping Sleeves Market, By Fluid Motion, 2020–2033 (USD Billion)(Units)
37. Mexico Tapping Sleeves Market, By Application, 2020–2033 (USD Billion)(Units)
38. Europe Tapping Sleeves Market, By Material, 2020–2033 (USD Billion)(Units)
39. Europe Tapping Sleeves Market, By Inches, 2020–2033 (USD Billion)(Units)
40. Europe Tapping Sleeves Market, By Fluid Motion, 2020–2033 (USD Billion)(Units)
41. Europe Tapping Sleeves Market, By Application, 2020–2033 (USD Billion)(Units)
42. Germany Tapping Sleeves Market, By Material, 2020–2033 (USD Billion)(Units)
43. Germany Tapping Sleeves Market, By Inches, 2020–2033 (USD Billion)(Units)
44. Germany Tapping Sleeves Market, By Fluid Motion, 2020–2033 (USD Billion)(Units)
45. Germany Tapping Sleeves Market, By Application, 2020–2033 (USD Billion)(Units)
46. France Tapping Sleeves Market, By Material, 2020–2033 (USD Billion)(Units)
47. France Tapping Sleeves Market, By Inches, 2020–2033 (USD Billion)(Units)
48. France Tapping Sleeves Market, By Fluid Motion, 2020–2033 (USD Billion)(Units)
49. France Tapping Sleeves Market, By Application, 2020–2033 (USD Billion)(Units)
50. U.K. Tapping Sleeves Market, By Material, 2020–2033 (USD Billion)(Units)
51. U.K. Tapping Sleeves Market, By Inches, 2020–2033 (USD Billion)(Units)
52. U.K. Tapping Sleeves Market, By Fluid Motion, 2020–2033 (USD Billion)(Units)
53. U.K. Tapping Sleeves Market, By Application, 2020–2033 (USD Billion)(Units)
54. Italy Tapping Sleeves Market, By Material, 2020–2033 (USD Billion)(Units)
55. Italy Tapping Sleeves Market, By Inches, 2020–2033 (USD Billion)(Units)
56. Italy Tapping Sleeves Market, By Fluid Motion, 2020–2033 (USD Billion)(Units)
57. Italy Tapping Sleeves Market, By Application, 2020–2033 (USD Billion)(Units)
58. Spain Tapping Sleeves Market, By Material, 2020–2033 (USD Billion)(Units)
59. Spain Tapping Sleeves Market, By Inches, 2020–2033 (USD Billion)(Units)
60. Spain Tapping Sleeves Market, By Fluid Motion, 2020–2033 (USD Billion)(Units)
61. Spain Tapping Sleeves Market, By Application, 2020–2033 (USD Billion)(Units)
62. Asia Pacific Tapping Sleeves Market, By Material, 2020–2033 (USD Billion)(Units)
63. Asia Pacific Tapping Sleeves Market, By Inches, 2020–2033 (USD Billion)(Units)
64. Asia Pacific Tapping Sleeves Market, By Fluid Motion, 2020–2033 (USD Billion)(Units)
65. Asia Pacific Tapping Sleeves Market, By Application, 2020–2033 (USD Billion)(Units)
66. Japan Tapping Sleeves Market, By Material, 2020–2033 (USD Billion)(Units)
67. Japan Tapping Sleeves Market, By Inches, 2020–2033 (USD Billion)(Units)
68. Japan Tapping Sleeves Market, By Fluid Motion, 2020–2033 (USD Billion)(Units)
69. Japan Tapping Sleeves Market, By Application, 2020–2033 (USD Billion)(Units)
70. China Tapping Sleeves Market, By Material, 2020–2033 (USD Billion)(Units)
71. China Tapping Sleeves Market, By Inches, 2020–2033 (USD Billion)(Units)
72. China Tapping Sleeves Market, By Fluid Motion, 2020–2033 (USD Billion)(Units)
73. China Tapping Sleeves Market, By Application, 2020–2033 (USD Billion)(Units)
74. India Tapping Sleeves Market, By Material, 2020–2033 (USD Billion)(Units)
75. India Tapping Sleeves Market, By Inches, 2020–2033 (USD Billion)(Units)
76. India Tapping Sleeves Market, By Fluid Motion, 2020–2033 (USD Billion)(Units)
77. India Tapping Sleeves Market, By Application, 2020–2033 (USD Billion)(Units)
78. South America Tapping Sleeves Market, By Material, 2020–2033 (USD Billion)(Units)
79. South America Tapping Sleeves Market, By Inches, 2020–2033 (USD Billion)(Units)
80. South America Tapping Sleeves Market, By Fluid Motion, 2020–2033 (USD Billion)(Units)
81. South America Tapping Sleeves Market, By Application, 2020–2033 (USD Billion)(Units)
82. Brazil Tapping Sleeves Market, By Material, 2020–2033 (USD Billion)(Units)
83. Brazil Tapping Sleeves Market, By Inches, 2020–2033 (USD Billion)(Units)
84. Brazil Tapping Sleeves Market, By Fluid Motion, 2020–2033 (USD Billion)(Units)
85. Brazil Tapping Sleeves Market, By Application, 2020–2033 (USD Billion)(Units)
86. Middle East and Africa Tapping Sleeves Market, By Material, 2020–2033 (USD Billion)(Units)
87. Middle East and Africa Tapping Sleeves Market, By Inches, 2020–2033 (USD Billion)(Units)
88. Middle East and Africa Tapping Sleeves Market, By Fluid Motion, 2020–2033 (USD Billion)(Units)
89. Middle East and Africa Tapping Sleeves Market, By Application, 2020–2033 (USD Billion)(Units)
90. UAE Tapping Sleeves Market, By Material, 2020–2033 (USD Billion)(Units)
91. UAE Tapping Sleeves Market, By Inches, 2020–2033 (USD Billion)(Units)
92. UAE Tapping Sleeves Market, By Fluid Motion, 2020–2033 (USD Billion)(Units)
93. UAE Tapping Sleeves Market, By Application, 2020–2033 (USD Billion)(Units)
94. South Africa Tapping Sleeves Market, By Material, 2020–2033 (USD Billion)(Units)
95. South Africa Tapping Sleeves Market, By Inches, 2020–2033 (USD Billion)(Units)
96. South Africa Tapping Sleeves Market, By Fluid Motion, 2020–2033 (USD Billion)(Units)
97. South Africa Tapping Sleeves Market, By Application, 2020–2033 (USD Billion)(Units)
List of Figures
1. Global Tapping Sleeves Market Segmentation
2. Tapping Sleeves Market: Research Methodology
3. Market Size Estimation Methodology: Bottom-Up Approach
4. Market Size Estimation Methodology: Top-Down Approach
5. Data Triangulation
6. Porter’s Five Forces Analysis
7. Value Chain Analysis
8. Global Tapping Sleeves Market Attractiveness Analysis By Material
9. Global Tapping Sleeves Market Attractiveness Analysis By Inches
10. Global Tapping Sleeves Market Attractiveness Analysis By Fluid Motion
11. Global Tapping Sleeves Market Attractiveness Analysis By Application
12. Global Tapping Sleeves Market Attractiveness Analysis By Region
13. Global Tapping Sleeves Market: Dynamics
14. Global Tapping Sleeves Market Share by Material (2023 & 2033)
15. Global Tapping Sleeves Market Share by Inches (2023 & 2033)
16. Global Tapping Sleeves Market Share by Fluid Motion (2023 & 2033)
17. Global Tapping Sleeves Market Share by Application (2023 & 2033)
18. Global Tapping Sleeves Market Share by Regions (2023 & 2033)
19. Global Tapping Sleeves Market Share by Company (2023)
This study forecasts revenue at global, regional, and country levels from 2020 to 2033. The Brainy Insights has segmented the global tapping sleeves market on the basis of below mentioned segments:
Global Tapping Sleeves Market by Material:
Global Tapping Sleeves Market by Inches:
Global Tapping Sleeves Market by Fluid Motion:
Global Tapping Sleeves Market by Application:
Global Tapping Sleeves Market by Region:
Research has its special purpose to undertake marketing efficiently. In this competitive scenario, businesses need information across all industry verticals; the information about customer wants, market demand, competition, industry trends, distribution channels etc. This information needs to be updated regularly because businesses operate in a dynamic environment. Our organization, The Brainy Insights incorporates scientific and systematic research procedures in order to get proper market insights and industry analysis for overall business success. The analysis consists of studying the market from a miniscule level wherein we implement statistical tools which helps us in examining the data with accuracy and precision.
Our research reports feature both; quantitative and qualitative aspects for any market. Qualitative information for any market research process are fundamental because they reveal the customer needs and wants, usage and consumption for any product/service related to a specific industry. This in turn aids the marketers/investors in knowing certain perceptions of the customers. Qualitative research can enlighten about the different product concepts and designs along with unique service offering that in turn, helps define marketing problems and generate opportunities. On the other hand, quantitative research engages with the data collection process through interviews, e-mail interactions, surveys and pilot studies. Quantitative aspects for the market research are useful to validate the hypotheses generated during qualitative research method, explore empirical patterns in the data with the help of statistical tools, and finally make the market estimations.
The Brainy Insights offers comprehensive research and analysis, based on a wide assortment of factual insights gained through interviews with CXOs and global experts and secondary data from reliable sources. Our analysts and industry specialist assume vital roles in building up statistical tools and analysis models, which are used to analyse the data and arrive at accurate insights with exceedingly informative research discoveries. The data provided by our organization have proven precious to a diverse range of companies, facilitating them to address issues such as determining which products/services are the most appealing, whether or not customers use the product in the manner anticipated, the purchasing intentions of the market and many others.
Our research methodology encompasses an idyllic combination of primary and secondary initiatives. Key phases involved in this process are listed below:

The phase involves the gathering and collecting of market data and its related information with the help of different sources & research procedures.

The data procurement stage involves in data gathering and collecting through various data sources.
This stage involves in extensive research. These data sources includes:
Purchased Database: Purchased databases play a crucial role in estimating the market sizes irrespective of the domain. Our purchased database includes:
Primary Research: The Brainy Insights interacts with leading companies and experts of the concerned domain to develop the analyst team’s market understanding and expertise. It improves and substantiates every single data presented in the market reports. Primary research mainly involves in telephonic interviews, E-mail interactions and face-to-face interviews with the raw material providers, manufacturers/producers, distributors, & independent consultants. The interviews that we conduct provides valuable data on market size and industry growth trends prevailing in the market. Our organization also conducts surveys with the various industry experts in order to gain overall insights of the industry/market. For instance, in healthcare industry we conduct surveys with the pharmacists, doctors, surgeons and nurses in order to gain insights and key information of a medical product/device/equipment which the customers are going to usage. Surveys are conducted in the form of questionnaire designed by our own analyst team. Surveys plays an important role in primary research because surveys helps us to identify the key target audiences of the market. Additionally, surveys helps to identify the key target audience engaged with the market. Our survey team conducts the survey by targeting the key audience, thus gaining insights from them. Based on the perspectives of the customers, this information is utilized to formulate market strategies. Moreover, market surveys helps us to understand the current competitive situation of the industry. To be precise, our survey process typically involve with the 360 analysis of the market. This analytical process begins by identifying the prospective customers for a product or service related to the market/industry to obtain data on how a product/service could fit into customers’ lives.

Secondary Research: The secondary data sources includes information published by the on-profit organizations such as World bank, WHO, company fillings, investor presentations, annual reports, national government documents, statistical databases, blogs, articles, white papers and others. From the annual report, we analyse a company’s revenue to understand the key segment and market share of that organization in a particular region. We analyse the company websites and adopt the product mapping technique which is important for deriving the segment revenue. In the product mapping method, we select and categorize the products offered by the companies catering to domain specific market, deduce the product revenue for each of the companies so as to get overall estimation of the market size. We also source data and analyses trends based on information received from supply side and demand side intermediaries in the value chain. The supply side denotes the data gathered from supplier, distributor, wholesaler and the demand side illustrates the data gathered from the end customers for respective market domain.

The supply side for a domain specific market is analysed by:
The demand side for the market is estimated through:
In-house Library: Apart from these third-party sources, we have our in-house library of qualitative and quantitative information. Our in-house database includes market data for various industry and domains. These data are updated on regular basis as per the changing market scenario. Our library includes, historic databases, internal audit reports and archives.
Sometimes there are instances where there is no metadata or raw data available for any domain specific market. For those cases, we use our expertise to forecast and estimate the market size in order to generate comprehensive data sets. Our analyst team adopt a robust research technique in order to produce the estimates:
Data Synthesis: This stage involves the analysis & mapping of all the information obtained from the previous step. It also involves in scrutinizing the data for any discrepancy observed while data gathering related to the market. The data is collected with consideration to the heterogeneity of sources. Robust scientific techniques are in place for synthesizing disparate data sets and provide the essential contextual information that can orient market strategies. The Brainy Insights has extensive experience in data synthesis where the data passes through various stages:


Market Deduction & Formulation: The final stage comprises of assigning data points at appropriate market spaces so as to deduce feasible conclusions. Analyst perspective & subject matter expert based holistic form of market sizing coupled with industry analysis also plays a crucial role in this stage.
This stage involves in finalization of the market size and numbers that we have collected from data integration step. With data interpolation, it is made sure that there is no gap in the market data. Successful trend analysis is done by our analysts using extrapolation techniques, which provide the best possible forecasts for the market.
Data Validation & Market Feedback: Validation is the most important step in the process. Validation & re-validation via an intricately designed process helps us finalize data-points to be used for final calculations.

The Brainy Insights interacts with leading companies and experts of the concerned domain to develop the analyst team’s market understanding and expertise. It improves and substantiates every single data presented in the market reports. The data validation interview and discussion panels are typically composed of the most experienced industry members. The participants include, however, are not limited to:
Moreover, we always validate our data and findings through primary respondents from all the major regions we are working on.


Free Customization
Fortune 500 Clients
Free Yearly Update On Purchase Of Multi/Corporate License
Companies Served Till Date