- +1-315-215-1633
- sales@thebrainyinsights.com

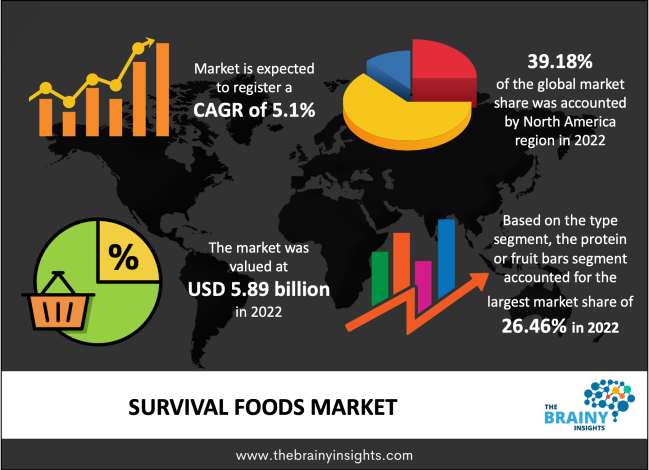
The global survival foods market was valued at USD 5.89 billion in 2022, increasing at a CAGR of 5.1% from 2022 to 2030 and is anticipated to reach USD 8.77 billion by 2030. Asia-Pacific is expected to grow the fastest during the forecast period. The survival foods industry was positively affected by the COVID-19 epidemic owing to people who are looking for food having varieties, longer shelf life, and can be prepared quickly with comfort. Around 16 per cent of the consumers started stocking up the groceries in March 2020 in the US, but by the mid of April, it was found that around six of the ten consumers were found stocking up the groceries.
Survival foods are food that can be stored for a long time. These are the foods used to help people and families in times of famine, disaster or long and short-term crisis. These are in the form of food which cannot be easily spoiled in normal room temperature conditions. Survival food can generally secure man's food for an undefined set of times. These foods can be anything which, ranged from cookies or crackers, energy bars, canned products, grains, cereals, fresh meat, and dehydrated and frozen dried food. It not only secures the food but also satisfies the daily nutritional requirement of the individual or family who is stocking it and helps them keep them healthy even in times of crisis. In the time of immediate travel and evacuation, the survival food must be portable and light so that there is no need to carry the bulk of things. These survival food packs must be light so that one can able to bring other important items like clothing and water without compromising mobility. Survival food is required to sustain life for as long as it is possible.
Get an overview of this study by requesting a free sample
For example, in January 2022, Goode Partners LLC acquired ReadyWise, the leading organization in the emergency food preparedness market. ReadyWise is fast growing food brand that provides ready-to-eat meals and others. The Goode Partners is doing so as they plan to continue their expansion for their leadership position in the survival food market. It also accelerates the growth in outdoor reaction and everyday meals and snacks categories, making ReadyWise a top household brand.
The leading organizations are acquiring companies to enter the consumer emergency preparedness market. For instance, in February 2019, SOS Food Lab, which offers survival food to maritime, aviation and mining sectors along with for military operations, entered the consumer emergency preparedness market by acquiring Survivor Industries Inc. This is helping the organizations in reaching a large consumer base for addressing emergency situations all the year round.
Surge in geopolitical tensions: It has been observed that there is an increase in geopolitical tension globally. For instance, the Ukraine conflict is happening, and on the other side, the uncertainty in the South China Sea is growing. The geopolitical Risk Index, generated by the US Federal Reserve, is at its most elevated point since the attack on Iraq in 2003. In the last decade, it has been observed that the world is moving away from the unipolar world concept in which the US-dominated diplomatic, economic, military and geopolitical spheres as China is playing the powerful counter-balancing role. Also, Russia and Ukraine conflict has led to strategic competition between the western camp dominated by the US and Europe and Russia and China-centered zone. All these factors have led to conflict and war zones which is eventually driving the survival food market.
Growing cases of natural disaster: Based on one of the studies, the world has witnessed a tenfold increase in natural disasters since the 1960s. It has been observed that flood has become the most familiar natural disaster since 1990. Based on one of the studies from 1990 to 2019, 9,924 natural disasters happened globally, of which around 42% were flooded. Storms, including hurricanes, tornadoes, cyclones, blizzards and dust storms, accounted for around 30% of the total natural disasters in the same period. Hence together, they accounted for around 71% of the disasters. This is attributed to the change in the climatic condition, especially the warming of global temperature, which increases the likelihood of natural disasters like drought, storms, wetter monsoons, wildfires etc. All these factors are eventually driving the survival food market.
High price: Survival food varies significantly from cookies, energy bars, canned products, fresh meats and dehydrated, frozen, and dried food, among others. But these products have high prices, so generally, people don’t prefer to buy these products, and they have several other good options, which are like fruits etc. These products are generally preferred in the time of some emergency. Also, there is a perception that these foods do not have good taste and are also not good for health in daily life. All these factors are acting as a restraint for the market.
Surge in product development: The organizations are focused on product development to expand their market share in this market. They are introducing new survival food products which are nutritional and tasty. Some of the recent nutrient survival meals are mac n cheese, lasagna, scrambled eggs, shakes and vitamin instant coffee, among others. Also, people with a surge in their disposable income prefer to be mobile and explore the world. This is increasing the sales of survival food as these are light in weight and easy to carry. All these factors would eventually propel the growth of the survival food market all across the world.
Stringent quality regulations: There is a growing case of emergency food quality test failures, and also, there is a surge in the health problem of a younger population due to poor eating habits and sedentary lifestyles. These factors are acting as challenges for the market to grow.
The regions analyzed for the market include Europe, South America, Asia Pacific, North America, the Middle East, and Africa. North America emerged as the largest market for the global survival foods market, with a 39.18% share of the market revenue in 2022. North America dominates the market because it has a high product penetration. The growing cases of floods and storms in the region have increased the demand for the survival food market. The survival food market is evolving with organizations introducing new products; for instance, in May 2012, an American-based Survivalist Foods came up with a new collection of seasoned freeze-dried meats, which include stroganoff style beef, roasted ground beef, vegetable-with gourmet sauces, teriyaki style chicken, roasted chicken and many more items were included which offered many options like in restaurant menu. Based on one of the studies, there are many advantages to preferring freeze-fried foods for meals in catastrophic conditions, as it has an extremely long shelf life. The Asia Pacific is expected to grow the fastest during the forecast period due to growing awareness for preparedness in some disasters. The survival foods which are most common these days are canned foods, grains and frozen, dried food; these are considered both emergency food as well as survival food as it has the potential to keep families fed for a longer period of time.
North America Region Survival Foods Market Share in 2022 - 39.18%
www.thebrainyinsights.com
Check the geographical analysis of this market by requesting a free sample
The type segment is divided into canned food, compressed biscuit, freeze-dried food, ready to eat meals, protein or fruit bars, dry cereals or granola, peanut butter, dried fruit and canned juice. The protein or fruit bars segment dominated, with a market share of around 26.46% in 2022. This growth is attributed to its easy-to-carry and lightweight features. It offers convenience to consumers. Moreover, the health-conscious consumers are also turning towards specialty diets which does not include cooking or which are instant and hence protein bars demand is increasing because of their ready to eat and on the go nature.
The application segment is divided into online retails and offline retails. In 2022, the offline segment dominated the market with the largest market share of 66.23% and market revenue of USD 3.90 billion. The survival foods are sold in club stores and Walmart etc. For instance, Walmart offers a kit which can last for two days to a year, and the price ranges from USD 25.88 to USD 1290.99. The market is competitive, and the price tends to vary based on the number of calories each kit offers per person per day.
| Attribute | Description |
|---|---|
| Market Size | Revenue (USD Billion) |
| Market size value in 2022 | USD 5.89 Billion |
| Market size value in 2030 | USD 8.77 Billion |
| CAGR (2022 to 2030) | 5.1% |
| Historical data | 2019-2020 |
| Base Year | 2021 |
| Forecast | 2022-2030 |
| Segments | Key Segments are type, application and regions |
| Regional Segments | The key regions are South America, North America, Europe, Asia Pacific, and Middle East & Africa. |
North America region emerged as the largest market for the survival foods.
The market's growth will be influenced by the surge in the geopolitical tension and growing cases of natural disater.
The high price could hamper the market growth.
The surge in the product development will provide huge opportunities to the market.
1. Introduction
1.1. Objectives of the Study
1.2. Market Definition
1.3. Research Scope
1.4. Currency
1.5. Key Target Audience
2. Research Methodology and Assumptions
3. Executive Summary
4. Premium Insights
4.1. Porter’s Five Forces Analysis
4.2. Value Chain Analysis
4.3. Top Investment Pockets
4.3.1. Market Attractiveness Analysis By Application
4.3.2. Market Attractiveness Analysis By Type
4.3.3. MARKET Attractiveness Analysis By Region
4.4. Industry Trends
5. Market Dynamics
5.1. Market Evaluation
5.2. Drivers
5.2.1. Surge in Geopolitical Tensions
5.2.2. Growing Cases of Natural Disaster
5.3. Restraints
5.3.1. High Price
5.4. Opportunities
5.4.1. Surge in Product Development
5.5. Challenges
5.5.1. Stringent quality regulations
6. Global Survival Foods Market Analysis and Forecast, By Application
6.1. Segment Overview
6.2. Online Retails
6.3. Offline Retails
7. Global Survival Foods Market Analysis and Forecast, By Type
7.1. Segment Overview
7.2. Canned Food
7.3. Compressed Biscuit
7.4. Freeze-dried Food
7.5. Ready to Eat Meals
7.6. Protein or Fruit Bars
7.7. Dry Cereals or Granola
7.8. Peanut Butter
7.9. Dried Fruit
7.10. Canned Juice
8. Global Survival Foods Market Analysis and Forecast, By Regional Analysis
8.1. Segment Overview
8.2. North America
8.2.1. U.S.
8.2.2. Canada
8.2.3. Mexico
8.3. Europe
8.3.1. Germany
8.3.2. France
8.3.3. U.K.
8.3.4. Italy
8.3.5. Spain
8.4. Asia-Pacific
8.4.1. Japan
8.4.2. China
8.4.3. India
8.5. South America
8.5.1. Brazil
8.6. Middle East and Africa
8.6.1. UAE
8.6.2. South Africa
9. Global Survival Foods Market-Competitive Landscape
9.1. Overview
9.2. Market Share of Key Players in Global Survival Foods Market
9.2.1. Global Company Market Share
9.2.2. North America Company Market Share
9.2.3. Europe Company Market Share
9.2.4. APAC Company Market Share
9.3. Competitive Situations and Trends
9.3.1. Product Launches and Developments
9.3.2. Partnerships, Collaborations, and Agreements
9.3.3. Mergers & Acquisitions
9.3.4. Expansions
10. Company Profiles
10.1. Nestle S.A
10.1.1. Business Overview
10.1.2. Company Snapshot
10.1.3. Company Market Share Analysis
10.1.4. Company Product Portfolio
10.1.5. Recent Developments
10.1.6. SWOT Analysis
10.2. Kraft Heinz Company
10.2.1. Business Overview
10.2.2. Company Snapshot
10.2.3. Company Market Share Analysis
10.2.4. Company Product Portfolio
10.2.5. Recent Developments
10.2.6. SWOT Analysis
10.3. Kelloggs
10.3.1. Business Overview
10.3.2. Company Snapshot
10.3.3. Company Market Share Analysis
10.3.4. Company Product Portfolio
10.3.5. Recent Developments
10.3.6. SWOT Analysis
10.4. Conagra Brands Inc
10.4.1. Business Overview
10.4.2. Company Snapshot
10.4.3. Company Market Share Analysis
10.4.4. Company Product Portfolio
10.4.5. Recent Developments
10.4.6. SWOT Analysis
10.5. Del Monte Foods
10.5.1. Business Overview
10.5.2. Company Snapshot
10.5.3. Company Market Share Analysis
10.5.4. Company Product Portfolio
10.5.5. Recent Developments
10.5.6. SWOT Analysis
10.6. My Patriot Supply
10.6.1. Business Overview
10.6.2. Company Snapshot
10.6.3. Company Market Share Analysis
10.6.4. Company Product Portfolio
10.6.5. Recent Developments
10.6.6. SWOT Analysis
10.7. 4Patriots, LLC
10.7.1. Business Overview
10.7.2. Company Snapshot
10.7.3. Company Market Share Analysis
10.7.4. Company Product Portfolio
10.7.5. Recent Developments
10.7.6. SWOT Analysis
10.8. Mountain House (Subsidiary of Oregon Freeze Dry)
10.8.1. Business Overview
10.8.2. Company Snapshot
10.8.3. Company Market Share Analysis
10.8.4. Company Product Portfolio
10.8.5. Recent Developments
10.8.6. SWOT Analysis
10.9. SOS Food Lab LLC
10.9.1. Business Overview
10.9.2. Company Snapshot
10.9.3. Company Market Share Analysis
10.9.4. Company Product Portfolio
10.9.5. Recent Developments
10.9.6. SWOT Analysis
10.10. Legacy Food Storage
10.10.1. Business Overview
10.10.2. Company Snapshot
10.10.3. Company Market Share Analysis
10.10.4. Company Product Portfolio
10.10.5. Recent Developments
10.10.6. SWOT Analysis
10.11. Survival Frog
10.11.1. Business Overview
10.11.2. Company Snapshot
10.11.3. Company Market Share Analysis
10.11.4. Company Product Portfolio
10.11.5. Recent Developments
10.11.6. SWOT Analysis
10.12. Emergency Essentials (Beprepared.Com)
10.12.1. Business Overview
10.12.2. Company Snapshot
10.12.3. Company Market Share Analysis
10.12.4. Company Product Portfolio
10.12.5. Recent Developments
10.12.6. SWOT Analysis
10.13. Mother Earth Products (Subsidiary Of Virginia's Finest)
10.13.1. Business Overview
10.13.2. Company Snapshot
10.13.3. Company Market Share Analysis
10.13.4. Company Product Portfolio
10.13.5. Recent Developments
10.13.6. SWOT Analysis
10.14. Augason Farms
10.14.1. Business Overview
10.14.2. Company Snapshot
10.14.3. Company Market Share Analysis
10.14.4. Company Product Portfolio
10.14.5. Recent Developments
10.14.6. SWOT Analysis
10.15. Readywise (Subsidiary Of Goode Partners Llc)
10.15.1. Business Overview
10.15.2. Company Snapshot
10.15.3. Company Market Share Analysis
10.15.4. Company Product Portfolio
10.15.5. Recent Developments
10.15.6. SWOT Analysis
10.16. Alpineaire Foods (Subsidiary Of Katadyn Group)
10.16.1. Business Overview
10.16.2. Company Snapshot
10.16.3. Company Market Share Analysis
10.16.4. Company Product Portfolio
10.16.5. Recent Developments
10.16.6. SWOT Analysis
10.17. My Patriot Supply
10.17.1. Business Overview
10.17.2. Company Snapshot
10.17.3. Company Market Share Analysis
10.17.4. Company Product Portfolio
10.17.5. Recent Developments
10.17.6. SWOT Analysis
10.18. Peak Refuel
10.18.1. Business Overview
10.18.2. Company Snapshot
10.18.3. Company Market Share Analysis
10.18.4. Company Product Portfolio
10.18.5. Recent Developments
10.18.6. SWOT Analysis
10.19. Thrive Life, LLC
10.19.1. Business Overview
10.19.2. Company Snapshot
10.19.3. Company Market Share Analysis
10.19.4. Company Product Portfolio
10.19.5. Recent Developments
10.19.6. SWOT Analysis
List of Table
1. Global Survival Foods Market, By Application, 2019-2030 (USD Billion)
2. Global Online Retails, Survival Foods Market, By Region, 2019-2030 (USD Billion)
3. Global Offline Retails, Survival Foods Market, By Region, 2019-2030 (USD Billion)
4. Global Survival Foods Market, By Type, 2019-2030 (USD Billion)
5. Global Canned Food, Survival Foods Market, By Region, 2019-2030 (USD Billion)
6. Global Compressed Biscuit, Survival Foods Market, By Region, 2019-2030 (USD Billion)
7. Global Freeze-Dried Food, Survival Foods Market, By Region, 2019-2030 (USD Billion)
8. Global Ready To Eat Meals, Survival Foods Market, By Region, 2019-2030 (USD Billion)
9. Global Protein or Fruit Bars, Survival Foods Market, By Region, 2019-2030 (USD Billion)
10. Global Dry Cereals or Granola, Survival Foods Market, By Region, 2019-2030 (USD Billion)
11. Global Peanut Butter, Survival Foods Market, By Region, 2019-2030 (USD Billion)
12. Global Dried Fruit, Survival Foods Market, By Region, 2019-2030 (USD Billion)
13. Global Canned Juice, Survival Foods Market, By Region, 2019-2030 (USD Billion)
14. North America Survival Foods Market, By Application, 2019-2030 (USD Billion)
15. North America Survival Foods Market, By Type, 2019-2030 (USD Billion)
16. U.S. Survival Foods Market, By Application, 2019-2030 (USD Billion)
17. U.S. Survival Foods Market, By Type, 2019-2030 (USD Billion)
18. Canada Survival Foods Market, By Application, 2019-2030 (USD Billion)
19. Canada Survival Foods Market, By Type, 2019-2030 (USD Billion)
20. Mexico Survival Foods Market, By Application, 2019-2030 (USD Billion)
21. Mexico Survival Foods Market, By Type, 2019-2030 (USD Billion)
22. Europe Survival Foods Market, By Application, 2019-2030 (USD Billion)
23. Europe Survival Foods Market, By Type, 2019-2030 (USD Billion)
24. Germany Survival Foods Market, By Application, 2019-2030 (USD Billion)
25. Germany Survival Foods Market, By Type, 2019-2030 (USD Billion)
26. France Survival Foods Market, By Application, 2019-2030 (USD Billion)
27. France Survival Foods Market, By Type, 2019-2030 (USD Billion)
28. U.K. Survival Foods Market, By Application, 2019-2030 (USD Billion)
29. U.K. Survival Foods Market, By Type, 2019-2030 (USD Billion)
30. Italy Survival Foods Market, By Application, 2019-2030 (USD Billion)
31. Italy Survival Foods Market, By Type, 2019-2030 (USD Billion)
32. Spain Survival Foods Market, By Application, 2019-2030 (USD Billion)
33. Spain Survival Foods Market, By Type, 2019-2030 (USD Billion)
34. Asia Pacific Survival Foods Market, By Application, 2019-2030 (USD Billion)
35. Asia Pacific Survival Foods Market, By Type, 2019-2030 (USD Billion)
36. Japan Survival Foods Market, By Application, 2019-2030 (USD Billion)
37. Japan Survival Foods Market, By Type, 2019-2030 (USD Billion)
38. China Survival Foods Market, By Application, 2019-2030 (USD Billion)
39. China Survival Foods Market, By Type, 2019-2030 (USD Billion)
40. India Survival Foods Market, By Application, 2019-2030 (USD Billion)
41. India Survival Foods Market, By Type, 2019-2030 (USD Billion)
42. South America Survival Foods Market, By Application, 2019-2030 (USD Billion)
43. South America Survival Foods Market, By Type, 2019-2030 (USD Billion)
44. Brazil Survival Foods Market, By Application, 2019-2030 (USD Billion)
45. Brazil Survival Foods Market, By Type, 2019-2030 (USD Billion)
46. Middle East and Africa Survival Foods Market, By Application, 2019-2030 (USD Billion)
47. Middle East and Africa Survival Foods Market, By Type, 2019-2030 (USD Billion)
48. UAE Survival Foods Market, By Application, 2019-2030 (USD Billion)
49. UAE Survival Foods Market, By Type, 2019-2030 (USD Billion)
50. South Africa Survival Foods Market, By Application, 2019-2030 (USD Billion)
51. South Africa Survival Foods Market, By Type, 2019-2030 (USD Billion)
List of Figures
1. Global Survival Foods Market Segmentation
2. Global Survival Foods Market: Research Methodology
3. Market Size Estimation Methodology: Bottom-Up Approach
4. Market Size Estimation Methodology: Top-Down Approach
5. Data Triangulation
6. Porter’s Five Forces Analysis
7. Value Chain Analysis
8. Global Survival Foods Market Attractiveness Analysis By Application
9. Global Survival Foods Market Attractiveness Analysis By Type
10. Global Survival Foods Market Attractiveness Analysis By Region
11. Global Survival Foods Market: Dynamics
12. Global Survival Foods Market Share By Application (2022 & 2030)
13. Global Survival Foods Market Share By Type (2022 & 2030)
14. Global Survival Foods Market Share By Regions (2022 & 2030)
15. Global Survival Foods Market Share By Company (2021)
This study forecasts revenue at global, regional, and country levels from 2019 to 2030. The Brainy Insights has segmented the global survival foods market based on below mentioned segments:
Global Survival Foods Market by Type:
Global Survival Foods Market by Application:
Global Survival Foods by Region:
Research has its special purpose to undertake marketing efficiently. In this competitive scenario, businesses need information across all industry verticals; the information about customer wants, market demand, competition, industry trends, distribution channels etc. This information needs to be updated regularly because businesses operate in a dynamic environment. Our organization, The Brainy Insights incorporates scientific and systematic research procedures in order to get proper market insights and industry analysis for overall business success. The analysis consists of studying the market from a miniscule level wherein we implement statistical tools which helps us in examining the data with accuracy and precision.
Our research reports feature both; quantitative and qualitative aspects for any market. Qualitative information for any market research process are fundamental because they reveal the customer needs and wants, usage and consumption for any product/service related to a specific industry. This in turn aids the marketers/investors in knowing certain perceptions of the customers. Qualitative research can enlighten about the different product concepts and designs along with unique service offering that in turn, helps define marketing problems and generate opportunities. On the other hand, quantitative research engages with the data collection process through interviews, e-mail interactions, surveys and pilot studies. Quantitative aspects for the market research are useful to validate the hypotheses generated during qualitative research method, explore empirical patterns in the data with the help of statistical tools, and finally make the market estimations.
The Brainy Insights offers comprehensive research and analysis, based on a wide assortment of factual insights gained through interviews with CXOs and global experts and secondary data from reliable sources. Our analysts and industry specialist assume vital roles in building up statistical tools and analysis models, which are used to analyse the data and arrive at accurate insights with exceedingly informative research discoveries. The data provided by our organization have proven precious to a diverse range of companies, facilitating them to address issues such as determining which products/services are the most appealing, whether or not customers use the product in the manner anticipated, the purchasing intentions of the market and many others.
Our research methodology encompasses an idyllic combination of primary and secondary initiatives. Key phases involved in this process are listed below:

The phase involves the gathering and collecting of market data and its related information with the help of different sources & research procedures.

The data procurement stage involves in data gathering and collecting through various data sources.
This stage involves in extensive research. These data sources includes:
Purchased Database: Purchased databases play a crucial role in estimating the market sizes irrespective of the domain. Our purchased database includes:
Primary Research: The Brainy Insights interacts with leading companies and experts of the concerned domain to develop the analyst team’s market understanding and expertise. It improves and substantiates every single data presented in the market reports. Primary research mainly involves in telephonic interviews, E-mail interactions and face-to-face interviews with the raw material providers, manufacturers/producers, distributors, & independent consultants. The interviews that we conduct provides valuable data on market size and industry growth trends prevailing in the market. Our organization also conducts surveys with the various industry experts in order to gain overall insights of the industry/market. For instance, in healthcare industry we conduct surveys with the pharmacists, doctors, surgeons and nurses in order to gain insights and key information of a medical product/device/equipment which the customers are going to usage. Surveys are conducted in the form of questionnaire designed by our own analyst team. Surveys plays an important role in primary research because surveys helps us to identify the key target audiences of the market. Additionally, surveys helps to identify the key target audience engaged with the market. Our survey team conducts the survey by targeting the key audience, thus gaining insights from them. Based on the perspectives of the customers, this information is utilized to formulate market strategies. Moreover, market surveys helps us to understand the current competitive situation of the industry. To be precise, our survey process typically involve with the 360 analysis of the market. This analytical process begins by identifying the prospective customers for a product or service related to the market/industry to obtain data on how a product/service could fit into customers’ lives.

Secondary Research: The secondary data sources includes information published by the on-profit organizations such as World bank, WHO, company fillings, investor presentations, annual reports, national government documents, statistical databases, blogs, articles, white papers and others. From the annual report, we analyse a company’s revenue to understand the key segment and market share of that organization in a particular region. We analyse the company websites and adopt the product mapping technique which is important for deriving the segment revenue. In the product mapping method, we select and categorize the products offered by the companies catering to domain specific market, deduce the product revenue for each of the companies so as to get overall estimation of the market size. We also source data and analyses trends based on information received from supply side and demand side intermediaries in the value chain. The supply side denotes the data gathered from supplier, distributor, wholesaler and the demand side illustrates the data gathered from the end customers for respective market domain.

The supply side for a domain specific market is analysed by:
The demand side for the market is estimated through:
In-house Library: Apart from these third-party sources, we have our in-house library of qualitative and quantitative information. Our in-house database includes market data for various industry and domains. These data are updated on regular basis as per the changing market scenario. Our library includes, historic databases, internal audit reports and archives.
Sometimes there are instances where there is no metadata or raw data available for any domain specific market. For those cases, we use our expertise to forecast and estimate the market size in order to generate comprehensive data sets. Our analyst team adopt a robust research technique in order to produce the estimates:
Data Synthesis: This stage involves the analysis & mapping of all the information obtained from the previous step. It also involves in scrutinizing the data for any discrepancy observed while data gathering related to the market. The data is collected with consideration to the heterogeneity of sources. Robust scientific techniques are in place for synthesizing disparate data sets and provide the essential contextual information that can orient market strategies. The Brainy Insights has extensive experience in data synthesis where the data passes through various stages:


Market Deduction & Formulation: The final stage comprises of assigning data points at appropriate market spaces so as to deduce feasible conclusions. Analyst perspective & subject matter expert based holistic form of market sizing coupled with industry analysis also plays a crucial role in this stage.
This stage involves in finalization of the market size and numbers that we have collected from data integration step. With data interpolation, it is made sure that there is no gap in the market data. Successful trend analysis is done by our analysts using extrapolation techniques, which provide the best possible forecasts for the market.
Data Validation & Market Feedback: Validation is the most important step in the process. Validation & re-validation via an intricately designed process helps us finalize data-points to be used for final calculations.

The Brainy Insights interacts with leading companies and experts of the concerned domain to develop the analyst team’s market understanding and expertise. It improves and substantiates every single data presented in the market reports. The data validation interview and discussion panels are typically composed of the most experienced industry members. The participants include, however, are not limited to:
Moreover, we always validate our data and findings through primary respondents from all the major regions we are working on.


Free Customization
Fortune 500 Clients
Free Yearly Update On Purchase Of Multi/Corporate License
Companies Served Till Date