- +1-315-215-1633
- sales@thebrainyinsights.com

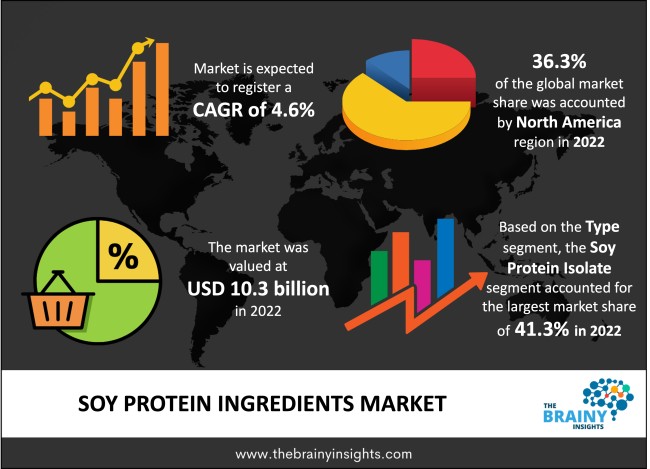
The global soy protein ingredients market was valued at USD 10.3 billion in 2022 and grew at a CAGR of 4.6% from 2023 to 2032. The market is expected to reach USD 16.2 billion by 2032. Soybeans are used to make the components of soy protein. They are made out of defatted and dehulled soybean meal. Soybeans that have been defatted and dehulled are then processed into three different high-protein products: soy protein isolates, soy flour, and soy protein concentrates. All three of these soy protein component categories are 70% protein, 20% carbohydrate, 6% ash, and 1% or less oil. Almost all of the essential amino acids for human nutrition are included in soy protein components, which are also one of the cheapest forms of protein and are equivalent to other bean pulses.
Because of a number of causes, the demand for soy protein components has been rapidly expanding in recent years. One of the key factors is the rising demand for plant-based protein products, which is being fueled by the popularity of vegetarian and vegan diets as well as an increased understanding of the advantages of plant-based diets for the environment and human health. An extremely well-liked form of plant-based protein is soy protein, which is produced from soybeans. It is frequently utilized as a replacement for animal-based proteins in the food and beverage industries.
Get an overview of this study by requesting a free sample
There is a growing market for protein sources made from plants as vegan and vegetarian diets become more and more well-liked and as the environmental impacts of animal agriculture become more widely recognized. As a complete protein with a decent amino acid profile, soy protein is a beneficial substitute for animal-based proteins. The health advantages of soy protein include lowering cholesterol levels, promoting heart health, and supplying the body with necessary amino acids. Additionally, it has few saturated fats and is a rich source of fiber, vitamins, and minerals. The demand for soy protein is increasing as people grow more health aware and look for protein sources that have nutritional benefits.
Even though soy protein is a frequently utilized and well-liked protein from plants source, it competes with other plant-based proteins including pea, rice, and wheat proteins. These alternatives have various nutritional profiles and functional qualities, which might segment the market and cause replacement.
In addition to conventional food and beverage goods, soy protein components may be used in a variety of other products. In industries including animal feed, cosmetics, personal care, and medicines, there is room to investigate and grow their use. New markets may be unlocked by the creation of creative soy protein component formulations suited to these sectors.
North America led the market in 2022 with the largest market share of 36.3%. This expansion can be due to the rising demand for plant-based goods, particularly in the US and Canada, where there were around 10 million vegans in total as of 2021. The United States significantly contributes to the need for soy protein in the region as one of the world's top producers of soybeans. Production of soybeans reached a record high of 4.44 billion bushels in 2021, an increase of 5% over 2020.
North America Region Soy Protein Ingredients Market Share in 2022 - 36.3%
www.thebrainyinsights.com
Check the geographical analysis of this market by requesting a free sample
The soy protein isolate segment dominated the global market in 2022 with a market share of 41.3%. Due to the growing need for soy protein components in newborn meals, prepared foods, and packaged foods, the infant foods category has the largest market potential for soy protein ingredients. Another important factor driving the demand for soy protein isolate components globally is the surge in demand for effective and affordable meat substitutes among newborns. Due to the rising demand for soy protein components and ongoing expansion in per capita disposable income, the usage of ingredients containing soy protein in infant diets has seen significant changes.
The dry segment held a significant market share of 73.2% in 2022. Industries are concentrating on keeping the texture of soy-based food due to the increase in demand for meat substitutes and developing preferences for plant-based cuisine. They are attempting to imitate meat as closely as possible. Texturized soy protein components are thus included in the product lines of market participants. Since they are mostly in dry form, the need for texturized soy protein is pushing up demand for soy protein in dry form. Their demand in the market is also being driven by their extended shelf life, practical packaging, simplicity of usage in recipes, and capacity to combine with other ingredients.
| Attribute | Description |
|---|---|
| Market Size | Revenue (USD Billion) |
| Market size value in 2022 | USD 10.3 Billion |
| Market size value in 2032 | USD 16.2 Billion |
| CAGR (2023 to 2032) | 4.6% |
| Historical data | 2019-2021 |
| Base Year | 2022 |
| Forecast | 2023-2032 |
| Region | The regions analyzed for the market are Asia Pacific, Europe, South America, North America, and Middle East & Africa. Furthermore, the regions are further analyzed at the country level. |
| Segments | Type, Form |
As per The Brainy Insights, the size of the soy protein ingredients market was valued at USD 10.3 billion in 2022 to USD 16.2 billion by 2032.
The global soy protein ingredients market is growing at a CAGR of 4.6% during the forecast period 2023-2032.
The North American region emerged as the largest market for the soy protein ingredients.
The rise in demand for plant based protein will influence the market's growth.
1. Introduction
1.1. Objectives of the Study
1.2. Market Definition
1.3. Research Scope
1.4. Currency
1.5. Key Target Audience
2. Research Methodology and Assumptions
3. Executive Summary
4. Premium Insights
4.1. Porter’s Five Forces Analysis
4.2. Value Chain Analysis
4.3. Top Investment Pockets
4.3.1. Market Attractiveness Analysis by Type
4.3.2. Market Attractiveness Analysis by Form
4.3.3. Market Attractiveness Analysis by Region
4.4. Industry Trends
5. Market Dynamics
5.1. Market Evaluation
5.2. Drivers
5.2.1. Rise in demand for plant based protein
5.3. Restraints
5.3.1. Presence of alternative source
5.4. Opportunities
5.4.1. Rise in demand from various industries
5.5. Challenges
5.5.1. High cost
6. Global Soy Protein Ingredients Market Analysis and Forecast, By Type
6.1. Segment Overview
6.2. Soy Flour
6.3. Soy Protein Isolate
6.4. Soy Protein Concentrate
7. Global Soy Protein Ingredients Market Analysis and Forecast, By Form
7.1. Segment Overview
7.2. Dry
7.3. Liquid
8. Global Soy Protein Ingredients Market Analysis and Forecast, By Regional Analysis
8.1. Segment Overview
8.2. North America
8.2.1. U.S.
8.2.2. Canada
8.2.3. Mexico
8.3. Europe
8.3.1. Germany
8.3.2. France
8.3.3. U.K.
8.3.4. Italy
8.3.5. Spain
8.4. Asia-Pacific
8.4.1. Japan
8.4.2. China
8.4.3. India
8.5. South America
8.5.1. Brazil
8.6. Middle East and Africa
8.6.1. UAE
8.6.2. South Africa
9. Global Soy Protein Ingredients Market-Competitive Landscape
9.1. Overview
9.2. Market Share of Key Players in the Soy Protein Ingredients Market
9.2.1. Global Company Market Share
9.2.2. North America Company Market Share
9.2.3. Europe Company Market Share
9.2.4. APAC Company Market Share
9.3. Competitive Situations and Trends
9.3.1. Product Launches and Developments
9.3.2. Partnerships, Collaborations, and Agreements
9.3.3. Mergers & Acquisitions
9.3.4. Expansions
10. Company Profiles
10.1. Wilmar International Limited
10.1.1. Business Overview
10.1.2. Company Snapshot
10.1.3. Company Market Share Analysis
10.1.4. Company Product Portfolio
10.1.5. Recent Developments
10.1.6. SWOT Analysis
10.2. The Kellogg Company
10.2.1. Business Overview
10.2.2. Company Snapshot
10.2.3. Company Market Share Analysis
10.2.4. Company Product Portfolio
10.2.5. Recent Developments
10.2.6. SWOT Analysis
10.3. Kraft Heinz Company
10.3.1. Business Overview
10.3.2. Company Snapshot
10.3.3. Company Market Share Analysis
10.3.4. Company Product Portfolio
10.3.5. Recent Developments
10.3.6. SWOT Analysis
10.4. Kerry Group, Plc.
10.4.1. Business Overview
10.4.2. Company Snapshot
10.4.3. Company Market Share Analysis
10.4.4. Company Product Portfolio
10.4.5. Recent Developments
10.4.6. SWOT Analysis
10.5. E. I. Du Pont De Nemours and Company
10.5.1. Business Overview
10.5.2. Company Snapshot
10.5.3. Company Market Share Analysis
10.5.4. Company Product Portfolio
10.5.5. Recent Developments
10.5.6. SWOT Analysis
10.6. Doves Farm Foods Ltd.
10.6.1. Business Overview
10.6.2. Company Snapshot
10.6.3. Company Market Share Analysis
10.6.4. Company Product Portfolio
10.6.5. Recent Developments
10.6.6. SWOT Analysis
10.7. CHS Inc.
10.7.1. Business Overview
10.7.2. Company Snapshot
10.7.3. Company Market Share Analysis
10.7.4. Company Product Portfolio
10.7.5. Recent Developments
10.7.6. SWOT Analysis
10.8. Cargill, Inc.
10.8.1. Business Overview
10.8.2. Company Snapshot
10.8.3. Company Market Share Analysis
10.8.4. Company Product Portfolio
10.8.5. Recent Developments
10.8.6. SWOT Analysis
10.9. Archer-Daniels-Midland Company
10.9.1. Business Overview
10.9.2. Company Snapshot
10.9.3. Company Market Share Analysis
10.9.4. Company Product Portfolio
10.9.5. Recent Developments
10.9.6. SWOT Analysis
10.10. AG Processing Inc.
10.10.1. Business Overview
10.10.2. Company Snapshot
10.10.3. Company Market Share Analysis
10.10.4. Company Product Portfolio
10.10.5. Recent Developments
10.10.6. SWOT Analysis
List of Table
1. Global Soy Protein Ingredients Market, By Type, 2019-2032 (USD Billion)
2. Global Soy Flour, Soy Protein Ingredients Market, By Region, 2019-2032 (USD Billion)
3. Global Soy Protein Isolate, Soy Protein Ingredients Market, By Region, 2019-2032 (USD Billion)
4. Global Soy Protein Concentrate, Soy Protein Ingredients Market, By Region, 2019-2032 (USD Billion)
5. Global Soy Protein Ingredients Market, By Form, 2019-2032 (USD Billion)
6. Global Dry, Soy Protein Ingredients Market, By Region, 2019-2032 (USD Billion)
7. Global Liquid, Soy Protein Ingredients Market, By Region, 2019-2032 (USD Billion)
8. Global Soy Protein Ingredients Market, By Region, 2019-2032 (USD Billion)
9. North America Soy Protein Ingredients Market, By Type, 2019-2032 (USD Billion)
10. North America Soy Protein Ingredients Market, By Form, 2019-2032 (USD Billion)
11. U.S. Soy Protein Ingredients Market, By Type, 2019-2032 (USD Billion)
12. U.S. Soy Protein Ingredients Market, By Form, 2019-2032 (USD Billion)
13. Canada Soy Protein Ingredients Market, By Type, 2019-2032 (USD Billion)
14. Canada Soy Protein Ingredients Market, By Form, 2019-2032 (USD Billion)
15. Mexico Soy Protein Ingredients Market, By Type, 2019-2032 (USD Billion)
16. Mexico Soy Protein Ingredients Market, By Form, 2019-2032 (USD Billion)
17. Europe Soy Protein Ingredients Market, By Type, 2019-2032 (USD Billion)
18. Europe Soy Protein Ingredients Market, By Form, 2019-2032 (USD Billion)
19. Germany Soy Protein Ingredients Market, By Type, 2019-2032 (USD Billion)
20. Germany Soy Protein Ingredients Market, By Form, 2019-2032 (USD Billion)
21. France Soy Protein Ingredients Market, By Type, 2019-2032 (USD Billion)
22. France Soy Protein Ingredients Market, By Form, 2019-2032 (USD Billion)
23. U.K. Soy Protein Ingredients Market, By Type, 2019-2032 (USD Billion)
24. U.K. Soy Protein Ingredients Market, By Form, 2019-2032 (USD Billion)
25. Italy Soy Protein Ingredients Market, By Type, 2019-2032 (USD Billion)
26. Italy Soy Protein Ingredients Market, By Form, 2019-2032 (USD Billion)
27. Spain Soy Protein Ingredients Market, By Type, 2019-2032 (USD Billion)
28. Spain Soy Protein Ingredients Market, By Form, 2019-2032 (USD Billion)
29. Asia Pacific Soy Protein Ingredients Market, By Type, 2019-2032 (USD Billion)
30. Asia Pacific Soy Protein Ingredients Market, By Form, 2019-2032 (USD Billion)
31. Japan Soy Protein Ingredients Market, By Type, 2019-2032 (USD Billion)
32. Japan Soy Protein Ingredients Market, By Form, 2019-2032 (USD Billion)
33. China Soy Protein Ingredients Market, By Type, 2019-2032 (USD Billion)
34. China Soy Protein Ingredients Market, By Form, 2019-2032 (USD Billion)
35. India Soy Protein Ingredients Market, By Type, 2019-2032 (USD Billion)
36. India Soy Protein Ingredients Market, By Form, 2019-2032 (USD Billion)
37. South America Soy Protein Ingredients Market, By Type, 2019-2032 (USD Billion)
38. South America Soy Protein Ingredients Market, By Form, 2019-2032 (USD Billion)
39. Brazil Soy Protein Ingredients Market, By Type, 2019-2032 (USD Billion)
40. Brazil Soy Protein Ingredients Market, By Form, 2019-2032 (USD Billion)
41. Middle East and Africa Soy Protein Ingredients Market, By Type, 2019-2032 (USD Billion)
42. Middle East and Africa Soy Protein Ingredients Market, By Form, 2019-2032 (USD Billion)
43. UAE Soy Protein Ingredients Market, By Type, 2019-2032 (USD Billion)
44. UAE Soy Protein Ingredients Market, By Form, 2019-2032 (USD Billion)
45. South Africa Soy Protein Ingredients Market, By Type, 2019-2032 (USD Billion)
46. South Africa Soy Protein Ingredients Market, By Form, 2019-2032 (USD Billion)
List of Figures
1. Global Soy Protein Ingredients Market Segmentation
2. Soy Protein Ingredients Market: Research Methodology
3. Market Size Estimation Methodology: Bottom-Up Approach
4. Market Size Estimation Methodology: Top-Down Approach
5. Data Triangulation
6. Porter’s Five Forces Analysis
7. Value Chain Analysis
8. Global Soy Protein Ingredients Market Attractiveness Analysis by Type
9. Global Soy Protein Ingredients Market Attractiveness Analysis by Form
10. Global Soy Protein Ingredients Market Attractiveness Analysis by Region
11. Global Soy Protein Ingredients Market: Dynamics
12. Global Soy Protein Ingredients Market Share by Type (2022 & 2032)
13. Global Soy Protein Ingredients Market Share by Form (2022 & 2032)
14. Global Soy Protein Ingredients Market Share by Regions (2022 & 2032)
15. Global Soy Protein Ingredients Market Share by Company (2022)
This study forecasts revenue at global, regional, and country levels from 2019 to 2032. The Brainy Insights has segmented the global soy protein ingredients market based on below-mentioned segments:
Global Soy Protein Ingredients Market by Type:
Global Soy Protein Ingredients Market by Form:
Global Soy Protein Ingredients Market by Region:
Research has its special purpose to undertake marketing efficiently. In this competitive scenario, businesses need information across all industry verticals; the information about customer wants, market demand, competition, industry trends, distribution channels etc. This information needs to be updated regularly because businesses operate in a dynamic environment. Our organization, The Brainy Insights incorporates scientific and systematic research procedures in order to get proper market insights and industry analysis for overall business success. The analysis consists of studying the market from a miniscule level wherein we implement statistical tools which helps us in examining the data with accuracy and precision.
Our research reports feature both; quantitative and qualitative aspects for any market. Qualitative information for any market research process are fundamental because they reveal the customer needs and wants, usage and consumption for any product/service related to a specific industry. This in turn aids the marketers/investors in knowing certain perceptions of the customers. Qualitative research can enlighten about the different product concepts and designs along with unique service offering that in turn, helps define marketing problems and generate opportunities. On the other hand, quantitative research engages with the data collection process through interviews, e-mail interactions, surveys and pilot studies. Quantitative aspects for the market research are useful to validate the hypotheses generated during qualitative research method, explore empirical patterns in the data with the help of statistical tools, and finally make the market estimations.
The Brainy Insights offers comprehensive research and analysis, based on a wide assortment of factual insights gained through interviews with CXOs and global experts and secondary data from reliable sources. Our analysts and industry specialist assume vital roles in building up statistical tools and analysis models, which are used to analyse the data and arrive at accurate insights with exceedingly informative research discoveries. The data provided by our organization have proven precious to a diverse range of companies, facilitating them to address issues such as determining which products/services are the most appealing, whether or not customers use the product in the manner anticipated, the purchasing intentions of the market and many others.
Our research methodology encompasses an idyllic combination of primary and secondary initiatives. Key phases involved in this process are listed below:

The phase involves the gathering and collecting of market data and its related information with the help of different sources & research procedures.

The data procurement stage involves in data gathering and collecting through various data sources.
This stage involves in extensive research. These data sources includes:
Purchased Database: Purchased databases play a crucial role in estimating the market sizes irrespective of the domain. Our purchased database includes:
Primary Research: The Brainy Insights interacts with leading companies and experts of the concerned domain to develop the analyst team’s market understanding and expertise. It improves and substantiates every single data presented in the market reports. Primary research mainly involves in telephonic interviews, E-mail interactions and face-to-face interviews with the raw material providers, manufacturers/producers, distributors, & independent consultants. The interviews that we conduct provides valuable data on market size and industry growth trends prevailing in the market. Our organization also conducts surveys with the various industry experts in order to gain overall insights of the industry/market. For instance, in healthcare industry we conduct surveys with the pharmacists, doctors, surgeons and nurses in order to gain insights and key information of a medical product/device/equipment which the customers are going to usage. Surveys are conducted in the form of questionnaire designed by our own analyst team. Surveys plays an important role in primary research because surveys helps us to identify the key target audiences of the market. Additionally, surveys helps to identify the key target audience engaged with the market. Our survey team conducts the survey by targeting the key audience, thus gaining insights from them. Based on the perspectives of the customers, this information is utilized to formulate market strategies. Moreover, market surveys helps us to understand the current competitive situation of the industry. To be precise, our survey process typically involve with the 360 analysis of the market. This analytical process begins by identifying the prospective customers for a product or service related to the market/industry to obtain data on how a product/service could fit into customers’ lives.

Secondary Research: The secondary data sources includes information published by the on-profit organizations such as World bank, WHO, company fillings, investor presentations, annual reports, national government documents, statistical databases, blogs, articles, white papers and others. From the annual report, we analyse a company’s revenue to understand the key segment and market share of that organization in a particular region. We analyse the company websites and adopt the product mapping technique which is important for deriving the segment revenue. In the product mapping method, we select and categorize the products offered by the companies catering to domain specific market, deduce the product revenue for each of the companies so as to get overall estimation of the market size. We also source data and analyses trends based on information received from supply side and demand side intermediaries in the value chain. The supply side denotes the data gathered from supplier, distributor, wholesaler and the demand side illustrates the data gathered from the end customers for respective market domain.

The supply side for a domain specific market is analysed by:
The demand side for the market is estimated through:
In-house Library: Apart from these third-party sources, we have our in-house library of qualitative and quantitative information. Our in-house database includes market data for various industry and domains. These data are updated on regular basis as per the changing market scenario. Our library includes, historic databases, internal audit reports and archives.
Sometimes there are instances where there is no metadata or raw data available for any domain specific market. For those cases, we use our expertise to forecast and estimate the market size in order to generate comprehensive data sets. Our analyst team adopt a robust research technique in order to produce the estimates:
Data Synthesis: This stage involves the analysis & mapping of all the information obtained from the previous step. It also involves in scrutinizing the data for any discrepancy observed while data gathering related to the market. The data is collected with consideration to the heterogeneity of sources. Robust scientific techniques are in place for synthesizing disparate data sets and provide the essential contextual information that can orient market strategies. The Brainy Insights has extensive experience in data synthesis where the data passes through various stages:


Market Deduction & Formulation: The final stage comprises of assigning data points at appropriate market spaces so as to deduce feasible conclusions. Analyst perspective & subject matter expert based holistic form of market sizing coupled with industry analysis also plays a crucial role in this stage.
This stage involves in finalization of the market size and numbers that we have collected from data integration step. With data interpolation, it is made sure that there is no gap in the market data. Successful trend analysis is done by our analysts using extrapolation techniques, which provide the best possible forecasts for the market.
Data Validation & Market Feedback: Validation is the most important step in the process. Validation & re-validation via an intricately designed process helps us finalize data-points to be used for final calculations.

The Brainy Insights interacts with leading companies and experts of the concerned domain to develop the analyst team’s market understanding and expertise. It improves and substantiates every single data presented in the market reports. The data validation interview and discussion panels are typically composed of the most experienced industry members. The participants include, however, are not limited to:
Moreover, we always validate our data and findings through primary respondents from all the major regions we are working on.


Free Customization
Fortune 500 Clients
Free Yearly Update On Purchase Of Multi/Corporate License
Companies Served Till Date