- +1-315-215-1633
- sales@thebrainyinsights.com

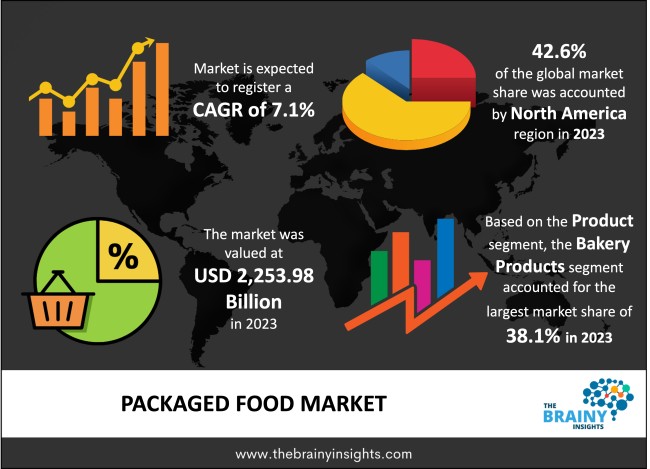
The global packaged food market was valued at USD 2,253.98 billion in 2023 and grew at a CAGR of 7.1% from 2024 to 2033. The market is expected to reach USD 4,475.53 billion by 2033. Packaged foods are regarded as the greatest cooking substitute in the modern world. Due to several benefits such as ready-to-eat items, simple handling, quick availability, and transportation, packaged foods are significantly growing in favor among urban residents. In emerging markets, where a number of reasons, including shifting consumer preferences, accelerating changes in consumer lifestyle and standard of living, and rising disposable income, play a significant role, the demand for packaged food is growing rapidly. The demand for packaged food is also increasing due to technological advancements. These advancements maintain the freshness of these food items, which customers can store for a long time. People living in foreign countries do not have to search for the food of their choice.
Due to urbanization, changing lifestyles, and the desire for quick and easy meal alternatives, packaged foods have grown in popularity. They provide advantages such as portability, an extended shelf life, control over quantity, and simplicity of storage. Busy schedules, increased disposable incomes, shifting dietary preferences, and the demand for quick and simple meal options are some of the drivers driving the industry. Packaged food is the name given to the food product that is made, processed, sealed, and sold. These food products are safe and edible in these boxes, and because they are sealed, there is no chance of contamination.
The boxes of these food products are designed so that they can be consumed anywhere. Due to technological advancements, variety can be given to these food products, allowing customers to taste different food varieties. Packaged food products are also used a lot by students, bachelors, or people who do not know how to cook.
Get an overview of this study by requesting a free sample
The convenience that packaged foods provide is one of the main factors driving the industry. Packaged meals are a practical choice for people who lead hectic lives since they are either ready to eat or need little preparation. Customers look at packaged products for quick and simple meal choices, especially those with busy schedules or limited culinary abilities. Additionally, processed and packaged goods have a longer shelf life, which lowers the chance of spoiling and food waste. Customers like the convenience of being able to keep and consume packaged goods for a longer period of time since it gives them more flexibility when planning meals and reduces the need for regular supermarket shopping.
Health concerns about packaged foods are a substantial restriction, even as convenience is a key incentive. Added sugars, salt, trans fats, and artificial additives are just a few of the dangerous elements that are frequently included in many packaged foods. The market for various packaged food products has been impacted by customers looking for healthier, fresher alternatives as their awareness of these health issues has grown.
Plant-based and alternative protein products have prospects in the packaged food industry due to the rising popularity of diets based on plants and environmental issues associated with animal agriculture. A number of solutions, including plant-based burgers, lactose-free milk, and vegan cheese, can be developed by businesses as plant-based substitutes for meat, milk, and egg products.
North America led the market in 2023 with the largest market share of 42.6%. In recent years, packaged food has seen a significant increase in demand and consumption across North America due to a number of advantages, including its practical convenience in use or preparation, the variety of options it offers consumers, the absence of the risk of food tampering, a decrease in food spoilage and damage to the product, and many more.
North America Region Packaged Foods Market Share in 2023 - 42.6%
www.thebrainyinsights.com
Check the geographical analysis of this market by requesting a free sample
The bakery products segment dominated the global market in 2023 with a market share of 38.1%. Many diets depend on bread, and the packaged bread segment is a significant area for the bakery business. Bread variations have room for innovation, including full-grain, artisanal, free-of-gluten, and organic possibilities. Popularity is also rising for bakery goods with extra nutritional benefits for health, such as high-fiber or fortified bread. Additionally, customer preferences for natural ingredients, decreased sugar content, and clean-label alternatives are driving an increase in demand for healthier bakery items. There are opportunities to create packaged baked products using whole grains, alternative sugars, and useful components like seeds, nuts, and old grains. Additionally, baked foods that are vegan, gluten-free, and allergen-free offer potential specialty items.
The Supermarkets/hypermarkets segment dominated the global market in 2023 with a market share of 53.6%. Because of the shopping experiences given by these businesses, a substantial percentage of customers choose to purchase their food from supermarkets and hypermarkets. One of the key elements in this distribution channel's success in the market is the opportunity to physically inspect a product and receive professional help. The growth of the supermarkets and hypermarket industry over the past ten years has also been aided by the continuous expansion of Walmart Supercenters, which have elevated Walmart to the position of largest grocery retailer in the United States. The biggest conventional grocery store, Kroger, has been actively involved in mergers and acquisitions lately, buying businesses like Roundy's and Harris Teeter.
| Attribute | Description |
|---|---|
| Market Size | Revenue (USD Billion) |
| Market size value in 2023 | USD 2,253.98 Billion |
| Market size value in 2033 | USD 4,475.53 Billion |
| CAGR (2024 to 2033) | 7.1% |
| Historical data | 2020-2022 |
| Base Year | 2023 |
| Forecast | 2024-2033 |
| Region | The regions analyzed for the market are Asia Pacific, Europe, South America, North America, and Middle East & Africa. Furthermore, the regions are further analyzed at the country level. |
| Segments | Product, Distribution Channel |
As per The Brainy Insights, the size of the packaged food market was valued at USD 2,253.98 billion in 2023 to USD 4,475.53 billion by 2033.
The global packaged food market is growing at a CAGR of 7.1 % during the forecast period 2024-2033.
The North America region emerged as the largest market for the packaged food.
Rise in demand due to busy schedule will influence the market's growth.
1. Introduction
1.1. Objectives of the Study
1.2. Market Definition
1.3. Research Scope
1.4. Currency
1.5. Key Target Audience
2. Research Methodology and Assumptions
3. Executive Summary
4. Premium Insights
4.1. Porter’s Five Forces Analysis
4.2. Value Chain Analysis
4.3. Top Investment Pockets
4.3.1. Market Attractiveness Analysis by Product
4.3.2. Market Attractiveness Analysis by Distribution Channel
4.3.3. Market Attractiveness Analysis by Region
4.4. Industry Trends
5. Market Dynamics
5.1. Market Evaluation
5.2. Drivers
5.2.1. Rise in demand due to busy schedule
5.3. Restraints
5.3.1. Heath concerns due to addition of preservatives
5.4. Opportunities
5.4.1. Adoption of plant based packaged food
5.5. Challenges
5.5.1. Limited Shelf Life
6. Global Packaged Food Market Analysis and Forecast, By Product
6.1. Segment Overview
6.2. Dairy Products
6.3. Beverages
6.4. Bakery Products
6.5. Breakfast Products
6.6. Meals
6.7. Others
7. Global Packaged Food Market Analysis and Forecast, By Distribution Channel
7.1. Segment Overview
7.2. Supermarkets/Hypermarkets
7.3. Convenience Stores
7.4. Specialty Stores
7.5. Online
7.6. Others
8. Global Packaged Food Market Analysis and Forecast, By Regional Analysis
8.1. Segment Overview
8.2. North America
8.2.1. U.S.
8.2.2. Canada
8.2.3. Mexico
8.3. Europe
8.3.1. Germany
8.3.2. France
8.3.3. U.K.
8.3.4. Italy
8.3.5. Spain
8.4. Asia-Pacific
8.4.1. Japan
8.4.2. China
8.4.3. India
8.5. South America
8.5.1. Brazil
8.6. Middle East and Africa
8.6.1. UAE
8.6.2. South Africa
9. Global Packaged Food Market-Competitive Landscape
9.1. Overview
9.2. Market Share of Key Players in the Packaged Food Market
9.2.1. Global Company Market Share
9.2.2. North America Company Market Share
9.2.3. Europe Company Market Share
9.2.4. APAC Company Market Share
9.3. Competitive Situations and Trends
9.3.1. Product Launches and Developments
9.3.2. Partnerships, Collaborations, and Agreements
9.3.3. Mergers & Acquisitions
9.3.4. Expansions
10. Company Profiles
10.1. ConAgra Foods
10.1.1. Business Overview
10.1.2. Company Snapshot
10.1.3. Company Market Share Analysis
10.1.4. Company Product Portfolio
10.1.5. Recent Developments
10.1.6. SWOT Analysis
10.2. Frito-Lay
10.2.1. Business Overview
10.2.2. Company Snapshot
10.2.3. Company Market Share Analysis
10.2.4. Company Product Portfolio
10.2.5. Recent Developments
10.2.6. SWOT Analysis
10.3. JBS Food
10.3.1. Business Overview
10.3.2. Company Snapshot
10.3.3. Company Market Share Analysis
10.3.4. Company Product Portfolio
10.3.5. Recent Developments
10.3.6. SWOT Analysis
10.4. Kellogg's
10.4.1. Business Overview
10.4.2. Company Snapshot
10.4.3. Company Market Share Analysis
10.4.4. Company Product Portfolio
10.4.5. Recent Developments
10.4.6. SWOT Analysis
10.5. Kraft Food, Inc.
10.5.1. Business Overview
10.5.2. Company Snapshot
10.5.3. Company Market Share Analysis
10.5.4. Company Product Portfolio
10.5.5. Recent Developments
10.5.6. SWOT Analysis
10.6. Mann Packing Co., Inc.
10.6.1. Business Overview
10.6.2. Company Snapshot
10.6.3. Company Market Share Analysis
10.6.4. Company Product Portfolio
10.6.5. Recent Developments
10.6.6. SWOT Analysis
10.7. Mars, Inc.
10.7.1. Business Overview
10.7.2. Company Snapshot
10.7.3. Company Market Share Analysis
10.7.4. Company Product Portfolio
10.7.5. Recent Developments
10.7.6. SWOT Analysis
10.8. Misionero
10.8.1. Business Overview
10.8.2. Company Snapshot
10.8.3. Company Market Share Analysis
10.8.4. Company Product Portfolio
10.8.5. Recent Developments
10.8.6. SWOT Analysis
10.9. Nestlé
10.9.1. Business Overview
10.9.2. Company Snapshot
10.9.3. Company Market Share Analysis
10.9.4. Company Product Portfolio
10.9.5. Recent Developments
10.9.6. SWOT Analysis
10.10. Ready Pac Foods
10.10.1. Business Overview
10.10.2. Company Snapshot
10.10.3. Company Market Share Analysis
10.10.4. Company Product Portfolio
10.10.5. Recent Developments
10.10.6. SWOT Analysis
10.11. Smithfield Food, Inc., LLC
10.11.1. Business Overview
10.11.2. Company Snapshot
10.11.3. Company Market Share Analysis
10.11.4. Company Product Portfolio
10.11.5. Recent Developments
10.11.6. SWOT Analysis
10.12. Tyson Foods
10.12.1. Business Overview
10.12.2. Company Snapshot
10.12.3. Company Market Share Analysis
10.12.4. Company Product Portfolio
10.12.5. Recent Developments
10.12.6. SWOT Analysis
List of Table
1. Global Packaged Food Market, By Product, 2020-2033 (USD Billion)
2. Global Dairy Products, Packaged Food Market, By Region, 2020-2033 (USD Billion)
3. Global Beverages, Packaged Food Market, By Region, 2020-2033 (USD Billion)
4. Global Bakery Products, Packaged Food Market, By Region, 2020-2033 (USD Billion)
5. Global Breakfast Products, Packaged Food Market, By Region, 2020-2033 (USD Billion)
6. Global Meals, Packaged Food Market, By Region, 2020-2033 (USD Billion)
7. Global Others, Packaged Food Market, By Region, 2020-2033 (USD Billion)
8. Global Packaged Food Market, By Distribution Channel, 2020-2033 (USD Billion)
9. Global Supermarkets/Hypermarkets Packaged Food Market, By Region, 2020-2033 (USD Billion)
10. Global Convenience Stores, Packaged Food Market, By Region, 2020-2033 (USD Billion)
11. Global Specialty Stores, Packaged Food Market, By Region, 2020-2033 (USD Billion)
12. Global Online, Packaged Food Market, By Region, 2020-2033 (USD Billion)
13. Global Others, Packaged Food Market, By Region, 2020-2033 (USD Billion)
14. Global Packaged Food Market, By Region, 2020-2033 (USD Billion)
15. North America Packaged Food Market, By Product, 2020-2033 (USD Billion)
16. North America Packaged Food Market, By Distribution Channel, 2020-2033 (USD Billion)
17. U.S. Packaged Food Market, By Product, 2020-2033 (USD Billion)
18. U.S. Packaged Food Market, By Distribution Channel, 2020-2033 (USD Billion)
19. Canada Packaged Food Market, By Product, 2020-2033 (USD Billion)
20. Canada Packaged Food Market, By Distribution Channel, 2020-2033 (USD Billion)
21. Mexico Packaged Food Market, By Product, 2020-2033 (USD Billion)
22. Mexico Packaged Food Market, By Distribution Channel, 2020-2033 (USD Billion)
23. Europe Packaged Food Market, By Product, 2020-2033 (USD Billion)
24. Europe Packaged Food Market, By Distribution Channel, 2020-2033 (USD Billion)
25. Germany Packaged Food Market, By Product, 2020-2033 (USD Billion)
26. Germany Packaged Food Market, By Distribution Channel, 2020-2033 (USD Billion)
27. France Packaged Food Market, By Product, 2020-2033 (USD Billion)
28. France Packaged Food Market, By Distribution Channel, 2020-2033 (USD Billion)
29. U.K. Packaged Food Market, By Product, 2020-2033 (USD Billion)
30. U.K. Packaged Food Market, By Distribution Channel, 2020-2033 (USD Billion)
31. Italy Packaged Food Market, By Product, 2020-2033 (USD Billion)
32. Italy Packaged Food Market, By Distribution Channel, 2020-2033 (USD Billion)
33. Spain Packaged Food Market, By Product, 2020-2033 (USD Billion)
34. Spain Packaged Food Market, By Distribution Channel, 2020-2033 (USD Billion)
35. Asia Pacific Packaged Food Market, By Product, 2020-2033 (USD Billion)
36. Asia Pacific Packaged Food Market, By Distribution Channel, 2020-2033 (USD Billion)
37. Japan Packaged Food Market, By Product, 2020-2033 (USD Billion)
38. Japan Packaged Food Market, By Distribution Channel, 2020-2033 (USD Billion)
39. China Packaged Food Market, By Product, 2020-2033 (USD Billion)
40. China Packaged Food Market, By Distribution Channel, 2020-2033 (USD Billion)
41. India Packaged Food Market, By Product, 2020-2033 (USD Billion)
42. India Packaged Food Market, By Distribution Channel, 2020-2033 (USD Billion)
43. South America Packaged Food Market, By Product, 2020-2033 (USD Billion)
44. South America Packaged Food Market, By Distribution Channel, 2020-2033 (USD Billion)
45. Brazil Packaged Food Market, By Product, 2020-2033 (USD Billion)
46. Brazil Packaged Food Market, By Distribution Channel, 2020-2033 (USD Billion)
47. Middle East and Africa Packaged Food Market, By Product, 2020-2033 (USD Billion)
48. Middle East and Africa Packaged Food Market, By Distribution Channel, 2020-2033 (USD Billion)
49. UAE Packaged Food Market, By Product, 2020-2033 (USD Billion)
50. UAE Packaged Food Market, By Distribution Channel, 2020-2033 (USD Billion)
51. South Africa Packaged Food Market, By Product, 2020-2033 (USD Billion)
52. South Africa Packaged Food Market, By Distribution Channel, 2020-2033 (USD Billion)
List of Figures
1. Global Packaged Food Market Segmentation
2. Packaged Food Market: Research Methodology
3. Market Size Estimation Methodology: Bottom-Up Approach
4. Market Size Estimation Methodology: Top-Down Approach
5. Data Triangulation
6. Porter’s Five Forces Analysis
7. Value Chain Analysis
8. Global Packaged Food Market Attractiveness Analysis by Product
9. Global Packaged Food Market Attractiveness Analysis by Distribution Channel
10. Global Packaged Food Market Attractiveness Analysis by Region
11. Global Packaged Food Market: Dynamics
12. Global Packaged Food Market Share by Product (2023 & 2033)
13. Global Packaged Food Market Share by Distribution Channel (2023 & 2033)
14. Global Packaged Food Market Share by Regions (2023 & 2033)
15. Global Packaged Food Market Share by Company (2023)
This study forecasts revenue at global, regional, and country levels from 2020 to 2033. The Brainy Insights has segmented the global packaged food market based on below-mentioned segments:
Global Packaged Food Market by Product:
Global Packaged Food Market by Distribution Channel:
Global Packaged Food Market by Region:
Research has its special purpose to undertake marketing efficiently. In this competitive scenario, businesses need information across all industry verticals; the information about customer wants, market demand, competition, industry trends, distribution channels etc. This information needs to be updated regularly because businesses operate in a dynamic environment. Our organization, The Brainy Insights incorporates scientific and systematic research procedures in order to get proper market insights and industry analysis for overall business success. The analysis consists of studying the market from a miniscule level wherein we implement statistical tools which helps us in examining the data with accuracy and precision.
Our research reports feature both; quantitative and qualitative aspects for any market. Qualitative information for any market research process are fundamental because they reveal the customer needs and wants, usage and consumption for any product/service related to a specific industry. This in turn aids the marketers/investors in knowing certain perceptions of the customers. Qualitative research can enlighten about the different product concepts and designs along with unique service offering that in turn, helps define marketing problems and generate opportunities. On the other hand, quantitative research engages with the data collection process through interviews, e-mail interactions, surveys and pilot studies. Quantitative aspects for the market research are useful to validate the hypotheses generated during qualitative research method, explore empirical patterns in the data with the help of statistical tools, and finally make the market estimations.
The Brainy Insights offers comprehensive research and analysis, based on a wide assortment of factual insights gained through interviews with CXOs and global experts and secondary data from reliable sources. Our analysts and industry specialist assume vital roles in building up statistical tools and analysis models, which are used to analyse the data and arrive at accurate insights with exceedingly informative research discoveries. The data provided by our organization have proven precious to a diverse range of companies, facilitating them to address issues such as determining which products/services are the most appealing, whether or not customers use the product in the manner anticipated, the purchasing intentions of the market and many others.
Our research methodology encompasses an idyllic combination of primary and secondary initiatives. Key phases involved in this process are listed below:

The phase involves the gathering and collecting of market data and its related information with the help of different sources & research procedures.

The data procurement stage involves in data gathering and collecting through various data sources.
This stage involves in extensive research. These data sources includes:
Purchased Database: Purchased databases play a crucial role in estimating the market sizes irrespective of the domain. Our purchased database includes:
Primary Research: The Brainy Insights interacts with leading companies and experts of the concerned domain to develop the analyst team’s market understanding and expertise. It improves and substantiates every single data presented in the market reports. Primary research mainly involves in telephonic interviews, E-mail interactions and face-to-face interviews with the raw material providers, manufacturers/producers, distributors, & independent consultants. The interviews that we conduct provides valuable data on market size and industry growth trends prevailing in the market. Our organization also conducts surveys with the various industry experts in order to gain overall insights of the industry/market. For instance, in healthcare industry we conduct surveys with the pharmacists, doctors, surgeons and nurses in order to gain insights and key information of a medical product/device/equipment which the customers are going to usage. Surveys are conducted in the form of questionnaire designed by our own analyst team. Surveys plays an important role in primary research because surveys helps us to identify the key target audiences of the market. Additionally, surveys helps to identify the key target audience engaged with the market. Our survey team conducts the survey by targeting the key audience, thus gaining insights from them. Based on the perspectives of the customers, this information is utilized to formulate market strategies. Moreover, market surveys helps us to understand the current competitive situation of the industry. To be precise, our survey process typically involve with the 360 analysis of the market. This analytical process begins by identifying the prospective customers for a product or service related to the market/industry to obtain data on how a product/service could fit into customers’ lives.

Secondary Research: The secondary data sources includes information published by the on-profit organizations such as World bank, WHO, company fillings, investor presentations, annual reports, national government documents, statistical databases, blogs, articles, white papers and others. From the annual report, we analyse a company’s revenue to understand the key segment and market share of that organization in a particular region. We analyse the company websites and adopt the product mapping technique which is important for deriving the segment revenue. In the product mapping method, we select and categorize the products offered by the companies catering to domain specific market, deduce the product revenue for each of the companies so as to get overall estimation of the market size. We also source data and analyses trends based on information received from supply side and demand side intermediaries in the value chain. The supply side denotes the data gathered from supplier, distributor, wholesaler and the demand side illustrates the data gathered from the end customers for respective market domain.

The supply side for a domain specific market is analysed by:
The demand side for the market is estimated through:
In-house Library: Apart from these third-party sources, we have our in-house library of qualitative and quantitative information. Our in-house database includes market data for various industry and domains. These data are updated on regular basis as per the changing market scenario. Our library includes, historic databases, internal audit reports and archives.
Sometimes there are instances where there is no metadata or raw data available for any domain specific market. For those cases, we use our expertise to forecast and estimate the market size in order to generate comprehensive data sets. Our analyst team adopt a robust research technique in order to produce the estimates:
Data Synthesis: This stage involves the analysis & mapping of all the information obtained from the previous step. It also involves in scrutinizing the data for any discrepancy observed while data gathering related to the market. The data is collected with consideration to the heterogeneity of sources. Robust scientific techniques are in place for synthesizing disparate data sets and provide the essential contextual information that can orient market strategies. The Brainy Insights has extensive experience in data synthesis where the data passes through various stages:


Market Deduction & Formulation: The final stage comprises of assigning data points at appropriate market spaces so as to deduce feasible conclusions. Analyst perspective & subject matter expert based holistic form of market sizing coupled with industry analysis also plays a crucial role in this stage.
This stage involves in finalization of the market size and numbers that we have collected from data integration step. With data interpolation, it is made sure that there is no gap in the market data. Successful trend analysis is done by our analysts using extrapolation techniques, which provide the best possible forecasts for the market.
Data Validation & Market Feedback: Validation is the most important step in the process. Validation & re-validation via an intricately designed process helps us finalize data-points to be used for final calculations.

The Brainy Insights interacts with leading companies and experts of the concerned domain to develop the analyst team’s market understanding and expertise. It improves and substantiates every single data presented in the market reports. The data validation interview and discussion panels are typically composed of the most experienced industry members. The participants include, however, are not limited to:
Moreover, we always validate our data and findings through primary respondents from all the major regions we are working on.


Free Customization
Fortune 500 Clients
Free Yearly Update On Purchase Of Multi/Corporate License
Companies Served Till Date