- +1-315-215-1633
- sales@thebrainyinsights.com

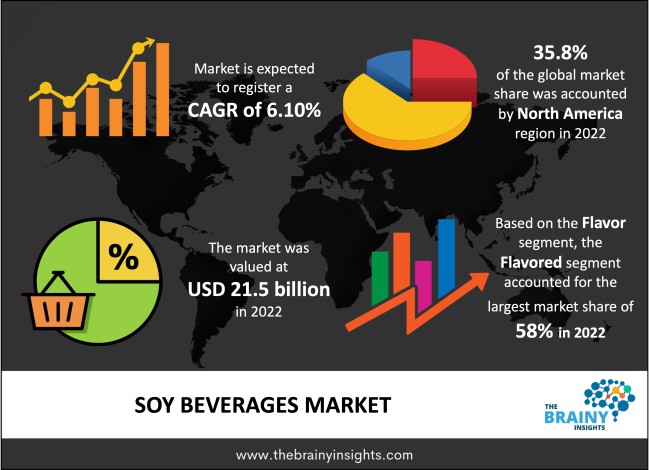
The global soy beverages market was valued at USD 21.5 billion in 2022 and growing at a CAGR of 6.10% from 2023 to 2032. The market is expected to reach USD 38.86 billion by 2032. The rising popularity of beverages and non-dairy foods is also expected to push the product need. Soy milk is a perfect replacement for cow milk as it includes the same amount of protein and is low in calories. The need for low-calorie products is in demand due to increasing obesity. Accordingly, soy milk is preferred by most customers for weight loss programs. Heart patients also choose the product as it reduces harmful cholesterol levels. Soy milk is famous for being lactose-intolerant as it is naturally lactose-free and rich in iron. Its high isoflavone element is known to control cancers related to the hormone.
Soy milk is made from soybeans using a water extraction method. It may be sweetened or unsweetened and usually contains a thickener or stabilizer. People can buy unsweetened, sweetened, and even chocolate-flavored versions. Soy milk is a plant-based nondairy beverage that’s a popular choice among youths. It’s created from soybeans, and multiple brands, like Silk, fortify their soy milk with vitamins and minerals like calcium and vitamin D. Soy milk provides a creamy texture and a healthy nutritional value, including essential omega-3 fatty acids, that have anti-inflammatory, antioxidant, and cardioprotective properties. Soy milk is a renowned plant-based option for cow’s milk. It’s usually enjoyed by those intolerant to lactose, the kind of sugar present in milk or have a milk protein allergy. Other people drink it as they follow a plant-based diet, making it healthier than cow’s milk. The unsweetened types usually include only purified water and soybeans, though some brands add salt, minerals, and vitamins. The sweetened types include a sweetener, usually cane sugar. They typically have salt, oil, and vanilla to deliver a flavour closer to cow’s milk. Some versions also contain cocoa to make a chocolate flavour. Unsweetened and sweetened soy milk also includes a stabilizer or thickener. These additions help the elements in the milk stay in an emulsion, or uniform mixture, and control attributes like thicker texture and mouthfeel. Also, many well-known brands of soy milk are backed with minerals and vitamins like vitamins A, B12, and D, riboflavin, and calcium. Unfortified, unsweetened soy milk tends to be in a good state of folate, magnesium, vitamin B6, and zinc. Some of them also contain iron and vitamin K.
Get an overview of this study by requesting a free sample
In May 2019, Hain Celestial Group, Inc. distributed strategically from West Soy beverage attendant to Natural Holdings, which helps companies’ lower complexity and push the sustainable growth of their existing portfolios.
Boost Weight Loss- Soy beverages are naturally lesser in sugar than standard beverages. For instance, cow's milk has approximately 11.5 grams of sugar per cup instead of only 7.5 grams of soy milk. That is why a cup of whole soy milk has only 85 calories, comparable to skim milk. In expansion, the monounsaturated fatty acid in soy milk can hamper the intestinal absorption of fat, which is a tremendous additional benefit for weight loss. Drinking soy milk also gives an extra dose of fibre, keeping the person fuller for a more prolonged time.
Soy Allergy- Most don't have any soymilk side effects, and it's ultimately safe to drink. But having a soy allergy, then people should avoid soy milk. As per Food Allergy Research and Education (FARE), Soy is among the top nine food allergies. It can be challenging to bypass as Soy is typically used in multiple processed foods, like soy lecithin or soybean oil. Some people may experience minor side effects of soy milk, including stomach pain, itching or skin rash, stuffy nose, and wheezing. More severe side effects include vomiting, diarrhoea, and, in rare cases, anaphylactic shock.
Best Plant-Based Protein Source- Compared with plant-based proteins, soy protein produces total nutrients in amino acids corresponding to animal sources. Soy has nearly every amino acid, paired with an essential amino acid and a limiting amino acid. In other plant-based proteins, all important amino acids are not included. But one can easily get all vital amino acids in a meal by combining plant-based proteins or putting soy-based proteins with grains.
The regions analyzed for the market include North America, Europe, South America, Asia Pacific, the Middle East, and Africa. North America emerged as the largest market for the global soy beverages market, with a 35.8% share of the market revenue in 2022.
North America is predicted to dominate the market owing to the rising use of non-dairy choices. Similarly, the product encounters competition from almond milk in the region as customers find nuts and nuts-based beverages healthy. Regardless, with multiple analyses proving the advantages of soy milk, customers choose the product over other substitutes like rice, almonds, and coconut milk.
North America Region Soy Beverages Market Share in 2022 - 35.8%
www.thebrainyinsights.com
Check the geographical analysis of this market by requesting a free sample
The product type segment is divided into soy-based drinkable yogurt, and soy milk. The soy milk segment dominated the market, with a market share of around 56% in 2022. Soy milk also beats almond milk in terms of protein, as traditional almond milk may have fewer calories, just 47 per cup but offers just 1.6 g of protein, per the USDA. Some added protein versions of almond milk use pea protein to bump up the protein range, but people will need to check product labels to confirm.
The flavor segment is divided into plain/unflavored, and flavored. The flavored segment dominated the market, with a market share of around 58% in 2022. Flavored or sweetened soymilk masks the nutty taste of the authentic product and hence is preferred by adults. The most famous flavors are vanilla and chocolate. Manufacturers improve the variety of flavors and distribute them in attractive packages to boost consumption, pushing the overall product demand.
The distribution channel segment is divided into pharmacy, supermarkets/hypermarkets, convenience stores, retail stores, online and others. The online segment dominated the market, with a market share of around 25% in 2022. The player is now targeting social media platforms and online distribution channels for their online marketing and branding of products to lure more consumers. Customers' changing tastes propel manufacturers to bring new flavors, driving the growth of flavored soy milk and improving overall consumption.
| Attribute | Description |
|---|---|
| Market Size | Revenue (USD Billion), Volume (Units) |
| Market size value in 2022 | USD 21.5 Billion |
| Market size value in 2032 | USD 38.86 Billion |
| CAGR (2023 to 2032) | 6.10% |
| Historical data | 2019-2021 |
| Base Year | 2022 |
| Forecast | 2023-2032 |
| Regional Segments | The regions analyzed for the market are Asia Pacific, Europe, South America, North America, and Middle East & Africa. Furthermore, the regions are further analyzed at the country level. |
| Segments | Product Type, Flavor, Distribution Channel |
As per The Brainy Insights, the size of the soy beverages market was valued at USD 21.5 billion in 2022to USD 38.86 billion by 2032.
Global soy beverages market is growing at a CAGR of 6.10% during the forecast period 2023-2032.
North America region emerged as the largest market for the soy beverages market.
Boosts weight loss which propels market growth.
1. Introduction
1.1. Objectives of the Study
1.2. Market Definition
1.3. Research Scope
1.4. Currency
1.5. Key Target Audience
2. Research Methodology and Assumptions
3. Executive Summary
4. Premium Insights
4.1. Porter’s Five Forces Analysis
4.2. Value Chain Analysis
4.3. Top Investment Pockets
4.3.1. Market Attractiveness Analysis by Product Type
4.3.2. Market Attractiveness Analysis by Flavor
4.3.3. Market Attractiveness Analysis by Distribution Channel
4.3.4. Market Attractiveness Analysis by Region
4.4. Industry Trends
5. Market Dynamics
5.1. Market Evaluation
5.2. Drivers
5.2.1. Boosts Weight Loss
5.3. Restraints
5.3.1. Soy Allergy
5.4. Opportunities
5.4.1. Best Plant-Based Protein Source are Pushing Market Growth
6. Global Soy Beverages Market Analysis and Forecast, By Product Type:
6.1. Segment Overview
6.2. Soy-Based Drinkable Yogurt
6.3. Soy Milk
7. Global Soy Beverages Market Analysis and Forecast, By Flavor
7.1. Segment Overview
7.2. Plain/Unflavored
7.3. Flavored
8. Global Soy Beverages Market Analysis and Forecast, By Distribution Channel
8.1. Segment Overview
8.2. Pharmacy
8.3. Supermarkets/Hypermarkets
8.4. Convenience Stores
8.5. Retail Stores
8.6. Online
8.7. Others
9. Global Soy Beverages Market Analysis and Forecast, By Regional Analysis
9.1. Segment Overview
9.2. North America
9.2.1. U.S.
9.2.2. Canada
9.2.3. Mexico
9.3. Europe
9.3.1. Germany
9.3.2. France
9.3.3. U.K.
9.3.4. Italy
9.3.5. Spain
9.4. Asia-Pacific
9.4.1. Japan
9.4.2. China
9.4.3. India
9.5. South America
9.5.1. Brazil
9.6. Middle East and Africa
9.6.1. UAE
9.6.2. South Africa
10. Global Soy Beverages Market-Competitive Landscape
10.1. Overview
10.2. Market Share of Key Players in the Soy Beverages Market
10.2.1. Global Company Market Share
10.2.2. North America Company Market Share
10.2.3. Europe Company Market Share
10.2.4. APAC Company Market Share
10.3. Competitive Situations and Trends
10.3.1. Product Launches and Developments
10.3.2. Partnerships, Collaborations, and Agreements
10.3.3. Mergers & Acquisitions
10.3.4. Expansions
11. Company Profiles
11.1. The Hain Celestial Group Inc.
11.1.1. Business Overview
11.1.2. Company Snapshot
11.1.3. Company Market Share Analysis
11.1.4. Company Product Portfolio
11.1.5. Recent Developments
11.1.6. SWOT Analysis
11.2. Takeda Pharmaceutical Co. Ltd.
11.2.1. Business Overview
11.2.2. Company Snapshot
11.2.3. Company Market Share Analysis
11.2.4. Company Product Portfolio
11.2.5. Recent Developments
11.2.6. SWOT Analysis
11.3. SolhFagito
11.3.1. Business Overview
11.3.2. Company Snapshot
11.3.3. Company Market Share Analysis
11.3.4. Company Product Portfolio
11.3.5. Recent Developments
11.3.6. SWOT Analysis
11.4. Sofina SA.
11.4.1. Business Overview
11.4.2. Company Snapshot
11.4.3. Company Market Share Analysis
11.4.4. Company Product Portfolio
11.4.5. Recent Developments
11.4.6. SWOT Analysis
11.5. Sanitarium Health Food Co.
11.5.1. Business Overview
11.5.2. Company Snapshot
11.5.3. Company Market Share Analysis
11.5.4. Company Product Portfolio
11.5.5. Recent Developments
11.5.6. SWOT Analysis
11.6. PureHarvest
11.6.1. Business Overview
11.6.2. Company Snapshot
11.6.3. Company Market Share Analysis
11.6.4. Company Product Portfolio
11.6.5. Recent Developments
11.6.6. SWOT Analysis
11.7. Pacific Foods of Oregon Llc.
11.7.1. Business Overview
11.7.2. Company Snapshot
11.7.3. Company Market Share Analysis
11.7.4. Company Product Portfolio
11.7.5. Recent Developments
11.7.6. SWOT Analysis
11.8. Nestle SA
11.8.1. Business Overview
11.8.2. Company Snapshot
11.8.3. Company Market Share Analysis
11.8.4. Company Product Portfolio
11.8.5. Recent Developments
11.8.6. SWOT Analysis
11.9. Life Health Foods
11.9.1. Business Overview
11.9.2. Company Snapshot
11.9.3. Company Market Share Analysis
11.9.4. Company Product Portfolio
11.9.5. Recent Developments
11.9.6. SWOT Analysis
11.10. Kikkoman Sales USA Inc.
11.10.1. Business Overview
11.10.2. Company Snapshot
11.10.3. Company Market Share Analysis
11.10.4. Company Product Portfolio
11.10.5. Recent Developments
11.10.6. SWOT Analysis
11.11. Jaffe Bros Inc.
11.11.1. Business Overview
11.11.2. Company Snapshot
11.11.3. Company Market Share Analysis
11.11.4. Company Product Portfolio
11.11.5. Recent Developments
11.11.6. SWOT Analysis
11.12. Eden Foods Inc.
11.12.1. Business Overview
11.12.2. Company Snapshot
11.12.3. Company Market Share Analysis
11.12.4. Company Product Portfolio
11.12.5. Recent Developments
11.12.6. SWOT Analysis
11.13. Devansoy Inc
11.13.1. Business Overview
11.13.2. Company Snapshot
11.13.3. Company Market Share Analysis
11.13.4. Company Product Portfolio
11.13.5. Recent Developments
11.13.6. SWOT Analysis
11.14. American Soy Products Inc
11.14.1. Business Overview
11.14.2. Company Snapshot
11.14.3. Company Market Share Analysis
11.14.4. Company Product Portfolio
11.14.5. Recent Developments
11.14.6. SWOT Analysis
List of Table
1. Global Soy Beverages Market, By Product Type, 2019-2032 (USD Billion)
2. Global Soy-Based Drinkable Yogurt Soy Beverages Market, By Region, 2019-2032 (USD Billion)
3. Global Soy Milk Soy Beverages Market, By Region, 2019-2032 (USD Billion)
4. Global Soy Beverages Market, By Flavor, 2019-2032 (USD Billion)
5. Global Plain/Unflavored Soy Beverages Market, By Region, 2019-2032 (USD Billion)
6. Global Flavored Soy Beverages Market, By Region, 2019-2032 (USD Billion)
7. Global Soy Beverages Market, By Distribution Channel, 2019-2032 (USD Billion)
8. Global Pharmacy Soy Beverages Market, By Region, 2019-2032 (USD Billion)
9. Global Supermarkets/Hypermarkets Soy Beverages Market, By Region, 2019-2032 (USD Billion)
10. Global Convenience Stores Soy Beverages Market, By Region, 2019-2032 (USD Billion)
11. Global Retail Stores Soy Beverages Market, By Region, 2019-2032 (USD Billion)
12. Global Online Soy Beverages Market, By Region, 2019-2032 (USD Billion)
13. Global Others Soy Beverages Market, By Region, 2019-2032 (USD Billion)
14. North America Soy Beverages Market, By Product Type, 2019-2032 (USD Billion)
15. North America Soy Beverages Market, By Flavor, 2019-2032 (USD Billion)
16. North America Soy Beverages Market, By Distribution Channel, 2019-2032 (USD Billion)
17. U.S. Soy Beverages Market, By Product Type, 2019-2032 (USD Billion)
18. U.S. Soy Beverages Market, By Flavor, 2019-2032 (USD Billion)
19. U.S. Soy Beverages Market, By Distribution Channel, 2019-2032 (USD Billion)
20. Canada Soy Beverages Market, By Product Type, 2019-2032 (USD Billion)
21. Canada Soy Beverages Market, By Flavor, 2019-2032 (USD Billion)
22. Canada Soy Beverages Market, By Distribution Channel, 2019-2032 (USD Billion)
23. Mexico Soy Beverages Market, By Product Type, 2019-2032 (USD Billion)
24. Mexico Soy Beverages Market, By Flavor, 2019-2032 (USD Billion)
25. Mexico Soy Beverages Market, By Distribution Channel, 2019-2032 (USD Billion)
26. Europe Soy Beverages Market, By Product Type, 2019-2032 (USD Billion)
27. Europe Soy Beverages Market, By Flavor, 2019-2032 (USD Billion)
28. Europe Soy Beverages Market, By Distribution Channel, 2019-2032 (USD Billion)
29. Germany Soy Beverages Market, By Product Type, 2019-2032 (USD Billion)
30. Germany Soy Beverages Market, By Flavor, 2019-2032 (USD Billion)
31. Germany Soy Beverages Market, By Distribution Channel, 2019-2032 (USD Billion)
32. France Soy Beverages Market, By Product Type 2019-2032 (USD Billion)
33. France Soy Beverages Market, By Flavor, 2019-2032 (USD Billion)
34. France Soy Beverages Market, By Distribution Channel, 2019-2032 (USD Billion)
35. U.K. Soy Beverages Market, By Product Type, 2019-2032 (USD Billion)
36. U.K. Soy Beverages Market, By Flavor, 2019-2032 (USD Billion)
37. U.K. Soy Beverages Market, By Distribution Channel, 2019-2032 (USD Billion)
38. Italy Soy Beverages Market, By Product Type, 2019-2032 (USD Billion)
39. Italy Soy Beverages Market, By Flavor, 2019-2032 (USD Billion)
40. Italy Soy Beverages Market, By Distribution Channel, 2019-2032 (USD Billion)
41. Spain Soy Beverages Market, By Product Type, 2019-2032 (USD Billion)
42. Spain Soy Beverages Market, By Flavor, 2019-2032 (USD Billion)
43. Spain Soy Beverages Market, By Distribution Channel, 2019-2032 (USD Billion)
44. Asia Pacific Soy Beverages Market, By Product Type, 2019-2032 (USD Billion)
45. Asia Pacific Soy Beverages Market, By Flavor, 2019-2032 (USD Billion)
46. Asia Pacific Soy Beverages Market, By Distribution Channel, 2019-2032 (USD Billion)
47. Japan Soy Beverages Market, By Product Type, 2019-2032 (USD Billion)
48. Japan Soy Beverages Market, By Flavor, 2019-2032 (USD Billion)
49. Japan Soy Beverages Market, By Distribution Channel, 2019-2032 (USD Billion)
50. China Soy Beverages Market, By Product Type 2019-2032 (USD Billion)
51. China Soy Beverages Market, By Flavor, 2019-2032 (USD Billion)
52. China Soy Beverages Market, By Distribution Channel, 2019-2032 (USD Billion)
53. India Soy Beverages Market, By Product Type 2019-2032 (USD Billion)
54. India Soy Beverages Market, By Flavor, 2019-2032 (USD Billion)
55. India Soy Beverages Market, By Distribution Channel, 2019-2032 (USD Billion)
56. South America Soy Beverages Market, By Product Type, 2019-2032 (USD Billion)
57. South America Soy Beverages Market, By Flavor, 2019-2032 (USD Billion)
58. South America Soy Beverages Market, By Distribution Channel, 2019-2032 (USD Billion)
59. Brazil Soy Beverages Market, By Product Type 2019-2032 (USD Billion)
60. Brazil Soy Beverages Market, By Flavor, 2019-2032 (USD Billion)
61. Brazil Soy Beverages Market, By Distribution Channel, 2019-2032 (USD Billion)
62. Middle East and Africa Soy Beverages Market, By Product Type, 2019-2032 (USD Billion)
63. Middle East and Africa Soy Beverages Market, By Flavor, 2019-2032 (USD Billion)
64. Middle East and Africa Soy Beverages Market, By Distribution Channel, 2019-2032 (USD Billion)
65. UAE Soy Beverages Market, By Product Type, 2019-2032 (USD Billion)
66. UAE Soy Beverages Market, By Flavor, 2019-2032 (USD Billion)
67. UAE Soy Beverages Market, By Distribution Channel, 2019-2032 (USD Billion)
68. South Africa Soy Beverages Market, By Product Type 2019-2032 (USD Billion)
69. South Africa Soy Beverages Market, By Flavor, 2019-2032 (USD Billion)
70. South Africa Soy Beverages Market, By Distribution Channel, 2019-2032 (USD Billion)
List of Figures
1. Global Soy Beverages Market Segmentation
2. Soy Beverages Market: Research Methodology
3. Market Size Estimation Methodology: Bottom-Up Approach
4. Market Size Estimation Methodology: Top-Down Approach
5. Data Triangulation
6. Porter’s Five Forces Analysis
7. Value Chain Analysis
8. Global Soy Beverages Market Attractiveness Analysis by Product Type
9. Global Soy Beverages Market Attractiveness Analysis by Flavor
10. Global Soy Beverages Market Attractiveness Analysis by Distribution Channel
11. Global Soy Beverages Market Attractiveness Analysis by Region
12. Global Soy Beverages Market: Dynamics
13. Global Soy Beverages Market Share by Product Type (2022 & 2032)
14. Global Soy Beverages Market Share by Flavor (2022 & 2032)
15. Global Soy Beverages Market Share by Distribution Channel (2022 & 2032)
16. Global Soy Beverages Market Share by Regions (2022 & 2032)
17. Global Soy Beverages Market Share by Company (2022)
This study forecasts revenue at global, regional, and country levels from 2019 to 2032. The Brainy Insights has segmented the global soy beverages market based on below mentioned segments:
Global Soy Beverages Market Product Type:
Global Soy Beverages Market Flavor:
Global Soy Beverages Market Distribution Channel:
Global Soy Beverages Market by Region:
Research has its special purpose to undertake marketing efficiently. In this competitive scenario, businesses need information across all industry verticals; the information about customer wants, market demand, competition, industry trends, distribution channels etc. This information needs to be updated regularly because businesses operate in a dynamic environment. Our organization, The Brainy Insights incorporates scientific and systematic research procedures in order to get proper market insights and industry analysis for overall business success. The analysis consists of studying the market from a miniscule level wherein we implement statistical tools which helps us in examining the data with accuracy and precision.
Our research reports feature both; quantitative and qualitative aspects for any market. Qualitative information for any market research process are fundamental because they reveal the customer needs and wants, usage and consumption for any product/service related to a specific industry. This in turn aids the marketers/investors in knowing certain perceptions of the customers. Qualitative research can enlighten about the different product concepts and designs along with unique service offering that in turn, helps define marketing problems and generate opportunities. On the other hand, quantitative research engages with the data collection process through interviews, e-mail interactions, surveys and pilot studies. Quantitative aspects for the market research are useful to validate the hypotheses generated during qualitative research method, explore empirical patterns in the data with the help of statistical tools, and finally make the market estimations.
The Brainy Insights offers comprehensive research and analysis, based on a wide assortment of factual insights gained through interviews with CXOs and global experts and secondary data from reliable sources. Our analysts and industry specialist assume vital roles in building up statistical tools and analysis models, which are used to analyse the data and arrive at accurate insights with exceedingly informative research discoveries. The data provided by our organization have proven precious to a diverse range of companies, facilitating them to address issues such as determining which products/services are the most appealing, whether or not customers use the product in the manner anticipated, the purchasing intentions of the market and many others.
Our research methodology encompasses an idyllic combination of primary and secondary initiatives. Key phases involved in this process are listed below:

The phase involves the gathering and collecting of market data and its related information with the help of different sources & research procedures.

The data procurement stage involves in data gathering and collecting through various data sources.
This stage involves in extensive research. These data sources includes:
Purchased Database: Purchased databases play a crucial role in estimating the market sizes irrespective of the domain. Our purchased database includes:
Primary Research: The Brainy Insights interacts with leading companies and experts of the concerned domain to develop the analyst team’s market understanding and expertise. It improves and substantiates every single data presented in the market reports. Primary research mainly involves in telephonic interviews, E-mail interactions and face-to-face interviews with the raw material providers, manufacturers/producers, distributors, & independent consultants. The interviews that we conduct provides valuable data on market size and industry growth trends prevailing in the market. Our organization also conducts surveys with the various industry experts in order to gain overall insights of the industry/market. For instance, in healthcare industry we conduct surveys with the pharmacists, doctors, surgeons and nurses in order to gain insights and key information of a medical product/device/equipment which the customers are going to usage. Surveys are conducted in the form of questionnaire designed by our own analyst team. Surveys plays an important role in primary research because surveys helps us to identify the key target audiences of the market. Additionally, surveys helps to identify the key target audience engaged with the market. Our survey team conducts the survey by targeting the key audience, thus gaining insights from them. Based on the perspectives of the customers, this information is utilized to formulate market strategies. Moreover, market surveys helps us to understand the current competitive situation of the industry. To be precise, our survey process typically involve with the 360 analysis of the market. This analytical process begins by identifying the prospective customers for a product or service related to the market/industry to obtain data on how a product/service could fit into customers’ lives.

Secondary Research: The secondary data sources includes information published by the on-profit organizations such as World bank, WHO, company fillings, investor presentations, annual reports, national government documents, statistical databases, blogs, articles, white papers and others. From the annual report, we analyse a company’s revenue to understand the key segment and market share of that organization in a particular region. We analyse the company websites and adopt the product mapping technique which is important for deriving the segment revenue. In the product mapping method, we select and categorize the products offered by the companies catering to domain specific market, deduce the product revenue for each of the companies so as to get overall estimation of the market size. We also source data and analyses trends based on information received from supply side and demand side intermediaries in the value chain. The supply side denotes the data gathered from supplier, distributor, wholesaler and the demand side illustrates the data gathered from the end customers for respective market domain.

The supply side for a domain specific market is analysed by:
The demand side for the market is estimated through:
In-house Library: Apart from these third-party sources, we have our in-house library of qualitative and quantitative information. Our in-house database includes market data for various industry and domains. These data are updated on regular basis as per the changing market scenario. Our library includes, historic databases, internal audit reports and archives.
Sometimes there are instances where there is no metadata or raw data available for any domain specific market. For those cases, we use our expertise to forecast and estimate the market size in order to generate comprehensive data sets. Our analyst team adopt a robust research technique in order to produce the estimates:
Data Synthesis: This stage involves the analysis & mapping of all the information obtained from the previous step. It also involves in scrutinizing the data for any discrepancy observed while data gathering related to the market. The data is collected with consideration to the heterogeneity of sources. Robust scientific techniques are in place for synthesizing disparate data sets and provide the essential contextual information that can orient market strategies. The Brainy Insights has extensive experience in data synthesis where the data passes through various stages:


Market Deduction & Formulation: The final stage comprises of assigning data points at appropriate market spaces so as to deduce feasible conclusions. Analyst perspective & subject matter expert based holistic form of market sizing coupled with industry analysis also plays a crucial role in this stage.
This stage involves in finalization of the market size and numbers that we have collected from data integration step. With data interpolation, it is made sure that there is no gap in the market data. Successful trend analysis is done by our analysts using extrapolation techniques, which provide the best possible forecasts for the market.
Data Validation & Market Feedback: Validation is the most important step in the process. Validation & re-validation via an intricately designed process helps us finalize data-points to be used for final calculations.

The Brainy Insights interacts with leading companies and experts of the concerned domain to develop the analyst team’s market understanding and expertise. It improves and substantiates every single data presented in the market reports. The data validation interview and discussion panels are typically composed of the most experienced industry members. The participants include, however, are not limited to:
Moreover, we always validate our data and findings through primary respondents from all the major regions we are working on.


Free Customization
Fortune 500 Clients
Free Yearly Update On Purchase Of Multi/Corporate License
Companies Served Till Date