- +1-315-215-1633
- sales@thebrainyinsights.com

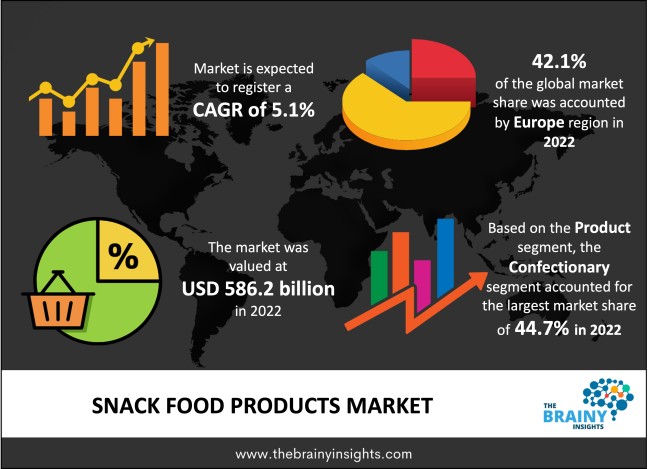
The global snack food products market was valued at USD 586.2 billion in 2022 and grew at a CAGR of 5.1% from 2023 to 2032. The market is expected to reach USD 963.9 billion by 2032. The market share of snack food products is expanding globally due to increased customer desire for luxurious indulgence and rising new product development by the major players. Additionally, the increased popularity of snacks among millennials and the expansion of convenience stores are expected to boost demand. As a result, manufacturers are adding new and unique tastes to their line of snack foods. One of the forces influencing the sector is this need for diversity. Due to rising health concerns among consumers, such as obesity, high blood pressure, and diabetes, the trend of eating healthy foods has been rapidly expanding globally over the past ten years. Consequently, there is a rise in the demand for low-fat, low-calorie, and sugar-free snack foods.
A significant component of the global food business, the snack food market has shown consistent expansion throughout time. The popularity of snack meals is influenced by a number of variables, including shifting consumer lifestyles, an increase in snacking occasions, growing disposable incomes, and a demand for quick and luxuriant eating alternatives. Products available in the snack food sector include chips, pretzels, almonds, popcorn, biscuits, cookies, candy bars, granola bars, and a lot more.
Get an overview of this study by requesting a free sample
Snack foods offer a quick and simple solution for consumption while on the go, addressing the needs of time-constrained people looking for portable and handy dietary alternatives. Additionally, snacking is becoming a common practice in terms of eating. These days, consumers use snacks in their daily routines not just as a refill between meals but also as a meal alternative or a strategy for satisfying desires. The need for a range of snack food products is fueled by the increase in snacking events.
Increased concerns about the nutrients and components used in snack foods are a result of an increased understanding of health and nutrition. Consumers are paying more attention to ingredients like too much sugar, bad fats, high salt levels, and artificial additives. As a result, there is now a desire for healthier snack options, and businesses may find it difficult to match these changing customer demands while preserving flavor and cost.
Opportunities for plant-based snack products are being created by the expanding flexible population and the popularity of plant-based diets. Businesses may create snacks using items including legumes, fruits, vegetables, and alternative protein sources. Consumers who are vegan, vegetarian, or ecologically aware can all enjoy plant-based snacks.
Europe led the market in 2022 with the largest market share of 42.1%. One of the major manufacturers and a large user of snack food items are in this region. In Europe, eating on the go or at social gatherings is customary, but more customers are choosing to eat healthier snacks. It is typically ingested in between meals and is seen as helpful and advantageous to a balanced diet. The biggest market for snack food products is in Europe.
Europe Region Snack Food Products Market Share in 2022 - 42.1%
www.thebrainyinsights.com
Check the geographical analysis of this market by requesting a free sample
The confectionary segment dominated the global market in 2022 with a market share of 44.7%. Due to the higher variety and novelty of items available on the market, the confectionery snacking category has the highest share. To accommodate shifting customer demand, producers are also expanding their product lineup to include tastes that are functional, natural, and nut-based in the confectionary snacks area. Functional candy snacks are becoming increasingly important on a global level. As customers seek for functional confectionary snacks to increase their intake of key nutrients, they are increasingly becoming more conscious of the connection between nutrition and well-being.
The supermarkets/hypermarkets segment dominated the global market in 2022 with a market share of 63.2%. The market for snack food goods is highly dependent on the supermarket and hypermarket segment. Large-scale retail businesses like supermarkets and hypermarkets provide customers with a wide range of goods, including snacks. Snack food items often occupy a lot of shelf space in supermarkets and hypermarkets. They provide a wide selection of foods to choose from, including cookies, chips, crackers, almonds, and chocolates. With such a large selection, customers may experiment with numerous brands, tastes, and types of snacks, satisfying a variety of preferences.
| Attribute | Description |
|---|---|
| Market Size | Revenue (USD Billion) |
| Market size value in 2022 | USD 586.2 Billion |
| Market size value in 2032 | USD 963.9 Billion |
| CAGR (2023 to 2032) | 5.1% |
| Historical data | 2019-2021 |
| Base Year | 2022 |
| Forecast | 2023-2032 |
| Segments | Product, Distribution channel |
As per The Brainy Insights, the size of the snack food products market was valued at USD 586.2 billion in 2022 to USD 963.9 billion by 2032.
The global snack food products market is growing at a CAGR of 5.1% during the forecast period 2023-2030.
The Europe region emerged as the largest market for the snack food products.
Changing Lifestyle will influence the market's growth.
1. Introduction
1.1. Objectives of the Study
1.2. Market Definition
1.3. Research Scope
1.4. Currency
1.5. Key Target Audience
2. Research Methodology and Assumptions
3. Executive Summary
4. Premium Insights
4.1. Porter’s Five Forces Analysis
4.2. Value Chain Analysis
4.3. Top Investment Pockets
4.3.1. Market Attractiveness Analysis by Product
4.3.2. Market Attractiveness Analysis by Distribution Channel
4.3.3. Market Attractiveness Analysis by Region
4.4. Industry Trends
5. Market Dynamics
5.1. Market Evaluation
5.2. Drivers
5.2.1. Changing Lifestyle
5.3. Restraints
5.3.1. Negative impact on health
5.4. Opportunities
5.4.1. Adoption of plant-based snack products
6. Global Snack Food Products Market Analysis and Forecast, By Product
6.1. Segment Overview
6.2. Savory Snacks
6.3. Confectionary
6.4. Bakery
6.5. Others
7. Global Snack Food Products Market Analysis and Forecast, By Distribution Channel
7.1. Segment Overview
7.2. Supermarkets/Hypermarkets
7.3. Online
7.4. Convenience Stores
7.5. Others
8. Global Snack Food Products Market Analysis and Forecast, By Regional Analysis
8.1. Segment Overview
8.2. North America
8.2.1. U.S.
8.2.2. Canada
8.2.3. Mexico
8.3. Europe
8.3.1. Germany
8.3.2. France
8.3.3. U.K.
8.3.4. Italy
8.3.5. Spain
8.4. Asia-Pacific
8.4.1. Japan
8.4.2. China
8.4.3. India
8.5. South America
8.5.1. Brazil
8.6. Middle East and Africa
8.6.1. UAE
8.6.2. South Africa
9. Global Snack Food Products Market-Competitive Landscape
9.1. Overview
9.2. Market Share of Key Players in the Snack Food Products Market
9.2.1. Global Company Market Share
9.2.2. North America Company Market Share
9.2.3. Europe Company Market Share
9.2.4. APAC Company Market Share
9.3. Competitive Situations and Trends
9.3.1. Product Launches and Developments
9.3.2. Partnerships, Collaborations, and Agreements
9.3.3. Mergers & Acquisitions
9.3.4. Expansions
10. Company Profiles
10.1. Kellogg Company
10.1.1. Business Overview
10.1.2. Company Snapshot
10.1.3. Company Market Share Analysis
10.1.4. Company Product Portfolio
10.1.5. Recent Developments
10.1.6. SWOT Analysis
10.2. General Mills
10.2.1. Business Overview
10.2.2. Company Snapshot
10.2.3. Company Market Share Analysis
10.2.4. Company Product Portfolio
10.2.5. Recent Developments
10.2.6. SWOT Analysis
10.3. Tyson Foods
10.3.1. Business Overview
10.3.2. Company Snapshot
10.3.3. Company Market Share Analysis
10.3.4. Company Product Portfolio
10.3.5. Recent Developments
10.3.6. SWOT Analysis
10.4. Kraft Heinz Company
10.4.1. Business Overview
10.4.2. Company Snapshot
10.4.3. Company Market Share Analysis
10.4.4. Company Product Portfolio
10.4.5. Recent Developments
10.4.6. SWOT Analysis
10.5. ConAgra Brands.
10.5.1. Business Overview
10.5.2. Company Snapshot
10.5.3. Company Market Share Analysis
10.5.4. Company Product Portfolio
10.5.5. Recent Developments
10.5.6. SWOT Analysis
10.6. Unilever Group
10.6.1. Business Overview
10.6.2. Company Snapshot
10.6.3. Company Market Share Analysis
10.6.4. Company Product Portfolio
10.6.5. Recent Developments
10.6.6. SWOT Analysis
10.7. Nestle S.A.
10.7.1. Business Overview
10.7.2. Company Snapshot
10.7.3. Company Market Share Analysis
10.7.4. Company Product Portfolio
10.7.5. Recent Developments
10.7.6. SWOT Analysis
10.8. J.M. Smucker Co
10.8.1. Business Overview
10.8.2. Company Snapshot
10.8.3. Company Market Share Analysis
10.8.4. Company Product Portfolio
10.8.5. Recent Developments
10.8.6. SWOT Analysis
10.9. PepsiCo
10.9.1. Business Overview
10.9.2. Company Snapshot
10.9.3. Company Market Share Analysis
10.9.4. Company Product Portfolio
10.9.5. Recent Developments
10.9.6. SWOT Analysis
10.10. Mars, Inc.
10.10.1. Business Overview
10.10.2. Company Snapshot
10.10.3. Company Market Share Analysis
10.10.4. Company Product Portfolio
10.10.5. Recent Developments
10.10.6. SWOT Analysis
List of Table
1. Global Snack Food Products Market, By Product, 2019-2032 (USD Billion)
2. Global Savory Snacks, Snack Food Products Market, By Region, 2019-2032 (USD Billion)
3. Global Confectionary, Snack Food Products Market, By Region, 2019-2032 (USD Billion)
4. Global Bakery, Snack Food Products Market, By Region, 2019-2032 (USD Billion)
5. Global Others Snack Food Products Market, By Region, 2019-2032 (USD Billion)
6. Global Snack Food Products Market, By Distribution Channel, 2019-2032 (USD Billion)
7. Global Supermarkets/Hypermarkets, Snack Food Products Market, By Region, 2019-2032 (USD Billion)
8. Global Online, Snack Food Products Market, By Region, 2019-2032 (USD Billion)
9. Global Convenience Stores, Snack Food Products Market, By Region, 2019-2032 (USD Billion)
10. Global Others, Snack Food Products Market, By Region, 2019-2032 (USD Billion)
11. Global Snack Food Products Market, By Region, 2019-2032 (USD Billion)
12. North America Snack Food Products Market, By Product, 2019-2032 (USD Billion)
13. North America Snack Food Products Market, By Distribution Channel, 2019-2032 (USD Billion)
14. U.S. Snack Food Products Market, By Product, 2019-2032 (USD Billion)
15. U.S. Snack Food Products Market, By Distribution Channel, 2019-2032 (USD Billion)
16. Canada Snack Food Products Market, By Product, 2019-2032 (USD Billion)
17. Canada Snack Food Products Market, By Distribution Channel, 2019-2032 (USD Billion)
18. Mexico Snack Food Products Market, By Product, 2019-2032 (USD Billion)
19. Mexico Snack Food Products Market, By Distribution Channel, 2019-2032 (USD Billion)
20. Europe Snack Food Products Market, By Product, 2019-2032 (USD Billion)
21. Europe Snack Food Products Market, By Distribution Channel, 2019-2032 (USD Billion)
22. Germany Snack Food Products Market, By Product, 2019-2032 (USD Billion)
23. Germany Snack Food Products Market, By Distribution Channel, 2019-2032 (USD Billion)
24. France Snack Food Products Market, By Product, 2019-2032 (USD Billion)
25. France Snack Food Products Market, By Distribution Channel, 2019-2032 (USD Billion)
26. U.K. Snack Food Products Market, By Product, 2019-2032 (USD Billion)
27. U.K. Snack Food Products Market, By Distribution Channel, 2019-2032 (USD Billion)
28. Italy Snack Food Products Market, By Product, 2019-2032 (USD Billion)
29. Italy Snack Food Products Market, By Distribution Channel, 2019-2032 (USD Billion)
30. Spain Snack Food Products Market, By Product, 2019-2032 (USD Billion)
31. Spain Snack Food Products Market, By Distribution Channel, 2019-2032 (USD Billion)
32. Asia Pacific Snack Food Products Market, By Product, 2019-2032 (USD Billion)
33. Asia Pacific Snack Food Products Market, By Distribution Channel, 2019-2032 (USD Billion)
34. Japan Snack Food Products Market, By Product, 2019-2032 (USD Billion)
35. Japan Snack Food Products Market, By Distribution Channel, 2019-2032 (USD Billion)
36. China Snack Food Products Market, By Product, 2019-2032 (USD Billion)
37. China Snack Food Products Market, By Distribution Channel, 2019-2032 (USD Billion)
38. India Snack Food Products Market, By Product, 2019-2032 (USD Billion)
39. India Snack Food Products Market, By Distribution Channel, 2019-2032 (USD Billion)
40. South America Snack Food Products Market, By Product, 2019-2032 (USD Billion)
41. South America Snack Food Products Market, By Distribution Channel, 2019-2032 (USD Billion)
42. Brazil Snack Food Products Market, By Product, 2019-2032 (USD Billion)
43. Brazil Snack Food Products Market, By Distribution Channel, 2019-2032 (USD Billion)
44. Middle East and Africa Snack Food Products Market, By Product, 2019-2032 (USD Billion)
45. Middle East and Africa Snack Food Products Market, By Distribution Channel, 2019-2032 (USD Billion)
46. UAE Snack Food Products Market, By Product, 2019-2032 (USD Billion)
47. UAE Snack Food Products Market, By Distribution Channel, 2019-2032 (USD Billion)
48. South Africa Snack Food Products Market, By Product, 2019-2032 (USD Billion)
49. South Africa Snack Food Products Market, By Distribution Channel, 2019-2032 (USD Billion)
List of Figures
1. Global Snack Food Products Market Segmentation
2. Snack Food Products Market: Research Methodology
3. Market Size Estimation Methodology: Bottom-Up Approach
4. Market Size Estimation Methodology: Top-Down Approach
5. Data Triangulation
6. Porter’s Five Forces Analysis
7. Value Chain Analysis
8. Global Snack Food Products Market Attractiveness Analysis by Product
9. Global Snack Food Products Market Attractiveness Analysis by Distribution Channel
10. Global Snack Food Products Market Attractiveness Analysis by Region
11. Global Snack Food Products Market: Dynamics
12. Global Snack Food Products Market Share by Product (2022 & 2032)
13. Global Snack Food Products Market Share by Distribution Channel (2022 & 2032)
14. Global Snack Food Products Market Share by Regions (2022 & 2032)
15. Global Snack Food Products Market Share by Company (2022)
This study forecasts revenue at global, regional, and country levels from 2019 to 2032. The Brainy Insights has segmented the global snack food products market based on below-mentioned segments:
Global Snack Food Products Market by Product:
Global Snack Food Products Market by Distribution Channel:
Global Snack Food Products Market by Region:
Research has its special purpose to undertake marketing efficiently. In this competitive scenario, businesses need information across all industry verticals; the information about customer wants, market demand, competition, industry trends, distribution channels etc. This information needs to be updated regularly because businesses operate in a dynamic environment. Our organization, The Brainy Insights incorporates scientific and systematic research procedures in order to get proper market insights and industry analysis for overall business success. The analysis consists of studying the market from a miniscule level wherein we implement statistical tools which helps us in examining the data with accuracy and precision.
Our research reports feature both; quantitative and qualitative aspects for any market. Qualitative information for any market research process are fundamental because they reveal the customer needs and wants, usage and consumption for any product/service related to a specific industry. This in turn aids the marketers/investors in knowing certain perceptions of the customers. Qualitative research can enlighten about the different product concepts and designs along with unique service offering that in turn, helps define marketing problems and generate opportunities. On the other hand, quantitative research engages with the data collection process through interviews, e-mail interactions, surveys and pilot studies. Quantitative aspects for the market research are useful to validate the hypotheses generated during qualitative research method, explore empirical patterns in the data with the help of statistical tools, and finally make the market estimations.
The Brainy Insights offers comprehensive research and analysis, based on a wide assortment of factual insights gained through interviews with CXOs and global experts and secondary data from reliable sources. Our analysts and industry specialist assume vital roles in building up statistical tools and analysis models, which are used to analyse the data and arrive at accurate insights with exceedingly informative research discoveries. The data provided by our organization have proven precious to a diverse range of companies, facilitating them to address issues such as determining which products/services are the most appealing, whether or not customers use the product in the manner anticipated, the purchasing intentions of the market and many others.
Our research methodology encompasses an idyllic combination of primary and secondary initiatives. Key phases involved in this process are listed below:

The phase involves the gathering and collecting of market data and its related information with the help of different sources & research procedures.

The data procurement stage involves in data gathering and collecting through various data sources.
This stage involves in extensive research. These data sources includes:
Purchased Database: Purchased databases play a crucial role in estimating the market sizes irrespective of the domain. Our purchased database includes:
Primary Research: The Brainy Insights interacts with leading companies and experts of the concerned domain to develop the analyst team’s market understanding and expertise. It improves and substantiates every single data presented in the market reports. Primary research mainly involves in telephonic interviews, E-mail interactions and face-to-face interviews with the raw material providers, manufacturers/producers, distributors, & independent consultants. The interviews that we conduct provides valuable data on market size and industry growth trends prevailing in the market. Our organization also conducts surveys with the various industry experts in order to gain overall insights of the industry/market. For instance, in healthcare industry we conduct surveys with the pharmacists, doctors, surgeons and nurses in order to gain insights and key information of a medical product/device/equipment which the customers are going to usage. Surveys are conducted in the form of questionnaire designed by our own analyst team. Surveys plays an important role in primary research because surveys helps us to identify the key target audiences of the market. Additionally, surveys helps to identify the key target audience engaged with the market. Our survey team conducts the survey by targeting the key audience, thus gaining insights from them. Based on the perspectives of the customers, this information is utilized to formulate market strategies. Moreover, market surveys helps us to understand the current competitive situation of the industry. To be precise, our survey process typically involve with the 360 analysis of the market. This analytical process begins by identifying the prospective customers for a product or service related to the market/industry to obtain data on how a product/service could fit into customers’ lives.

Secondary Research: The secondary data sources includes information published by the on-profit organizations such as World bank, WHO, company fillings, investor presentations, annual reports, national government documents, statistical databases, blogs, articles, white papers and others. From the annual report, we analyse a company’s revenue to understand the key segment and market share of that organization in a particular region. We analyse the company websites and adopt the product mapping technique which is important for deriving the segment revenue. In the product mapping method, we select and categorize the products offered by the companies catering to domain specific market, deduce the product revenue for each of the companies so as to get overall estimation of the market size. We also source data and analyses trends based on information received from supply side and demand side intermediaries in the value chain. The supply side denotes the data gathered from supplier, distributor, wholesaler and the demand side illustrates the data gathered from the end customers for respective market domain.

The supply side for a domain specific market is analysed by:
The demand side for the market is estimated through:
In-house Library: Apart from these third-party sources, we have our in-house library of qualitative and quantitative information. Our in-house database includes market data for various industry and domains. These data are updated on regular basis as per the changing market scenario. Our library includes, historic databases, internal audit reports and archives.
Sometimes there are instances where there is no metadata or raw data available for any domain specific market. For those cases, we use our expertise to forecast and estimate the market size in order to generate comprehensive data sets. Our analyst team adopt a robust research technique in order to produce the estimates:
Data Synthesis: This stage involves the analysis & mapping of all the information obtained from the previous step. It also involves in scrutinizing the data for any discrepancy observed while data gathering related to the market. The data is collected with consideration to the heterogeneity of sources. Robust scientific techniques are in place for synthesizing disparate data sets and provide the essential contextual information that can orient market strategies. The Brainy Insights has extensive experience in data synthesis where the data passes through various stages:


Market Deduction & Formulation: The final stage comprises of assigning data points at appropriate market spaces so as to deduce feasible conclusions. Analyst perspective & subject matter expert based holistic form of market sizing coupled with industry analysis also plays a crucial role in this stage.
This stage involves in finalization of the market size and numbers that we have collected from data integration step. With data interpolation, it is made sure that there is no gap in the market data. Successful trend analysis is done by our analysts using extrapolation techniques, which provide the best possible forecasts for the market.
Data Validation & Market Feedback: Validation is the most important step in the process. Validation & re-validation via an intricately designed process helps us finalize data-points to be used for final calculations.

The Brainy Insights interacts with leading companies and experts of the concerned domain to develop the analyst team’s market understanding and expertise. It improves and substantiates every single data presented in the market reports. The data validation interview and discussion panels are typically composed of the most experienced industry members. The participants include, however, are not limited to:
Moreover, we always validate our data and findings through primary respondents from all the major regions we are working on.


Free Customization
Fortune 500 Clients
Free Yearly Update On Purchase Of Multi/Corporate License
Companies Served Till Date