- +1-315-215-1633
- sales@thebrainyinsights.com

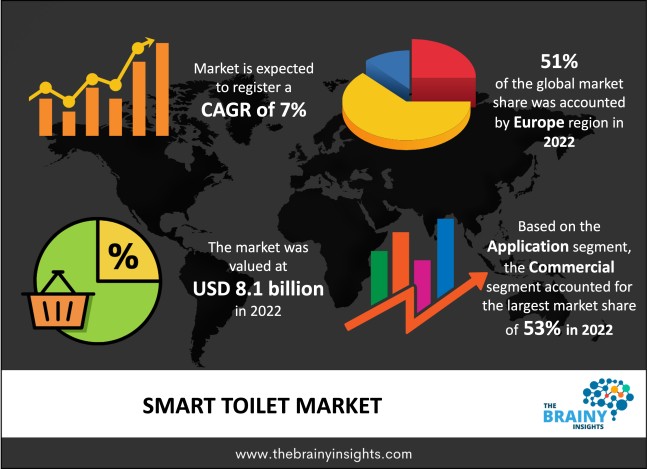
The global smart toilet market was valued at USD 8.1 billion in 2022, growing at a CAGR of 7% from 2023 to 2032. The market is expected to reach USD 15.9 billion by 2032. The growing need for hygienic-sanitary goods, consumer lifestyle changes, and increased global awareness of water conservation propel the global smart toilet market. These incentives motivate market participants to develop technologically sophisticated smart toilets, fueling market expansion. Furthermore, smart toilets have become a crucial component of smart homes, especially in Western nations like Europe and North America. Globally, this reason is also increasing the demand for smart toilets.
The smart toilets market is anticipated to grow as consumer awareness of cleanliness and maintaining optimum hygiene rises. Smart toilets make toilet cleaning and maintenance more effective by lowering the danger of disease transmission. A wide range of technologies is included in smart toilets, including a UV bactericidal light nozzle, fake flush sounds to cover up noises, automatic flushing mechanisms, anti-bacterial seats, and urine and stool analysis for medical monitoring. Such cutting-edge features are anticipated to promote the use of smart toilets, consequently fueling the expansion of the smart toilets market. Additionally, individuals are buying these goods due to a shift in attitude towards bathroom decoration as a component of lavish house décor. A further factor driving the installation of new smart toilets in the residential and commercial sectors is the preference for smart houses in large cities due to the growing significance of appropriate sanitation and convenience. Smart toilets are made to use electricity and water more wisely. This implies that putting these fixtures in homeowners' bathrooms will result in financial savings. Additionally, they have an ergonomic shape that makes them perfect for all home members. The small amount of room that smart toilets occupy in the bathroom adds to their efficiency. The bathroom fixtures are straightforward to clean, thanks to their design. These qualities are anticipated to drive the smart toilets market to expand.
Get an overview of this study by requesting a free sample
In June 2022, Daniel Arsham and Kohler, a prominent American plumbing and bathroom furniture manufacturer, joined together to produce a 3D-printed washbasin. Kohler presented brand-new digital bathroom options and an immersive Daniel Arsham sculpture at Milan Design Week 2022.
In January 2021, the world's largest Japanese toilet manufacturer, Toto Ltd., introduced an "AI-based Wellness Toilet". The wellness toilet uses cutting-edge sensing technology to monitor and analyze its users' emotional and physical health. Using this information, the user's smartphone app can offer ways to improve their wellness.
Consumer Consciousness- Due to the current climate circumstances and unequal distribution of limited resources, people are becoming more worried about energy conservation. Since they have automated flushes that use measuring techniques to estimate how much water is needed to flush, smart toilets provide better long-term water-saving options. For instance, smart toilets consume as little as 1.6 gallons of water to flush, compared to the 5 to 7 gallons used by conventional toilets. According to research, 2 to 3 billion gallons of water are flushed daily in the United States, which may seem little for a one-time occurrence. People are switching to clever toilets to save water and lower their water bills.
Lack of Knowledge- Regular toilets are famous in some nations, such as China, India, and other developing nations. The market's expansion is anticipated to be hampered by low penetration in developing nations, a lack of knowledge about the performance of smart toilets, and cost restrictions. Country-to-country differences exist in hygiene cultures. For instance, in India, only some rural communities have restrooms. The Swatch Bharat Mission, an initiative of the Indian government, aims to improve cleanliness in rural areas of the country.
Technological Advancements- Voice-activated equipment and IoT technology are becoming more common in the sector. To improve the user experience in restrooms, market companies frequently incorporate various cutting-edge hygiene technology, including Bluetooth connectivity, UV lighting, auto-open seat covers, auto-flush, and much more. For instance, Toto's Neorest 750H bidet includes numerous wash modes (such as oscillating and pulsing comfort washing), an adjustable heated seat, automatic lid operation, automatic flushing, and automatic deodorizing. When the smart toilet performs the unpleasant work of cleaning itself after use, Neorest's true beauty becomes apparent. The motion-activated lid on Kohler's technologically advanced smart toilet Numi automatically raises as soon as the user approaches.
The regions analyzed for the market include North America, Europe, South America, Asia Pacific, the Middle East, and Africa. Europe emerged as the largest market for the global smart toilet market, with a 51% market revenue share in 2022.
The smart toilet market's expansion is driven by rising consumer spending on maintaining bathroom hygiene. According to a recent survey, many people in Germany and the United Kingdom prefer to install intelligent toilet seats rather than pull the lever by hand, which is unclean. In the future, rising consumer expenditure on health and hygiene products in the U.K., Germany, and France is anticipated to continue favouring industry expansion.
Europe Region Smart Toilet Market Share in 2022 - 51%
www.thebrainyinsights.com
Check the geographical analysis of this market by requesting a free sample
The application segment is divided into residential and commercial. The commercial segment dominated the market, with a market share of around 53% in 2022. The increased adoption of smart toilets in commercial real estate, bars, upscale restaurants, shopping malls, and hotels is a key driver fostering the commercial segment's expansion. Smart toilets are becoming increasingly common in the hospitality and healthcare sectors.
The distribution channel segment is divided into offline and online. The offline segment dominated the market, with a market share of around 58% in 2022. Many customers buy these smart items from stores since they give them the option of physical verification before making any purchases.
| Attribute | Description |
|---|---|
| Market Size | Revenue (USD Billion) |
| Market size value in 2022 | USD 8.1 Billion |
| Market size value in 2032 | USD 15.9 Billion |
| CAGR (2023 to 2032) | 7% |
| Historical data | 2019-2021 |
| Base Year | 2022 |
| Forecast | 2023-2032 |
| Region | The regions analyzed for the market are Asia Pacific, Europe, South America, North America, and Middle East & Africa. Furthermore, the regions are further analyzed at the country level. |
| Segments | Application, Distribution Channel |
As per The Brainy Insights, the size of the smart toilet market was valued at USD 8.1 billion in 2022 to USD 15.9 billion by 2032.
The global smart toilet market is growing at a CAGR of 7% during the forecast period 2023-2032.
Europe emerged as the largest smart toilet market.
Key players in the smart toilet market are LIXIL, Panasonic, Kohler, Coway, Jomoo, Haier, Midea, Arrow, Huida, Shunjie, Dongpeng, HEGII, and Brondell.
1. Introduction
1.1. Objectives of the Study
1.2. Market Definition
1.3. Research Scope
1.4. Currency
1.5. Key Target Audience
2. Research Methodology and Assumptions
3. Executive Summary
4. Premium Insights
4.1. Porter’s Five Forces Analysis
4.2. Value Chain Analysis
4.3. Top Investment Pockets
4.3.1. Market Attractiveness Analysis by Application
4.3.2. Market Attractiveness Analysis by Distribution Channel
4.3.3. Market Attractiveness Analysis by Region
4.4. Industry Trends
5. Market Dynamics
5.1. Market Evaluation
5.2. Drivers
5.2.1. Consumer Consciousness
5.3. Restraints
5.3.1. Lack of Knowledge
5.4. Opportunities
5.4.1. Technological Advancements
5.5. Challenges
5.5.1. High Cost
6. Global Smart Toilet Market Analysis and Forecast, By Application
6.1. Segment Overview
6.2. Residential
6.3. Commercial
7. Global Smart Toilet Market Analysis and Forecast, By Distribution Channel
7.1. Segment Overview
7.2. Offline
7.3. Online
8. Global Smart Toilet Market Analysis and Forecast, By Regional Analysis
8.1. Segment Overview
8.2. North America
8.2.1. U.S.
8.2.2. Canada
8.2.3. Mexico
8.3. Europe
8.3.1. Germany
8.3.2. France
8.3.3. U.K.
8.3.4. Italy
8.3.5. Spain
8.4. Asia-Pacific
8.4.1. Japan
8.4.2. China
8.4.3. India
8.5. South America
8.5.1. Brazil
8.6. Middle East and Africa
8.6.1. UAE
8.6.2. South Africa
9. Global Smart Toilet Market-Competitive Landscape
9.1. Overview
9.2. Market Share of Key Players in Global Smart Toilet Market
9.2.1. Global Company Market Share
9.2.2. North America Company Market Share
9.2.3. Europe Company Market Share
9.2.4. APAC Company Market Share
9.3. Competitive Situations and Trends
9.3.1. Product Launches and Developments
9.3.2. Partnerships, Collaborations, and Agreements
9.3.3. Mergers & Acquisitions
9.3.4. Expansions
10. Company Profiles
10.1. LIXIL
10.1.1. Business Overview
10.1.2. Company Snapshot
10.1.3. Company Market Share Analysis
10.1.4. Company Product Portfolio
10.1.5. Recent Developments
10.1.6. SWOT Analysis
10.2. Panasonic
10.2.1. Business Overview
10.2.2. Company Snapshot
10.2.3. Company Market Share Analysis
10.2.4. Company Product Portfolio
10.2.5. Recent Developments
10.2.6. SWOT Analysis
10.3. Kohler
10.3.1. Business Overview
10.3.2. Company Snapshot
10.3.3. Company Market Share Analysis
10.3.4. Company Product Portfolio
10.3.5. Recent Developments
10.3.6. SWOT Analysis
10.4. Coway
10.4.1. Business Overview
10.4.2. Company Snapshot
10.4.3. Company Market Share Analysis
10.4.4. Company Product Portfolio
10.4.5. Recent Developments
10.4.6. SWOT Analysis
10.5. Jomoo
10.5.1. Business Overview
10.5.2. Company Snapshot
10.5.3. Company Market Share Analysis
10.5.4. Company Product Portfolio
10.5.5. Recent Developments
10.5.6. SWOT Analysis
10.6. Haier
10.6.1. Business Overview
10.6.2. Company Snapshot
10.6.3. Company Market Share Analysis
10.6.4. Company Product Portfolio
10.6.5. Recent Developments
10.6.6. SWOT Analysis
10.7. Midea
10.7.1. Business Overview
10.7.2. Company Snapshot
10.7.3. Company Market Share Analysis
10.7.4. Company Product Portfolio
10.7.5. Recent Developments
10.7.6. SWOT Analysis
10.8. Arrow
10.8.1. Business Overview
10.8.2. Company Snapshot
10.8.3. Company Market Share Analysis
10.8.4. Company Product Portfolio
10.8.5. Recent Developments
10.8.6. SWOT Analysis
10.9. Huida
10.9.1. Business Overview
10.9.2. Company Snapshot
10.9.3. Company Market Share Analysis
10.9.4. Company Product Portfolio
10.9.5. Recent Developments
10.9.6. SWOT Analysis
10.10. Shunjie
10.10.1. Business Overview
10.10.2. Company Snapshot
10.10.3. Company Market Share Analysis
10.10.4. Company Product Portfolio
10.10.5. Recent Developments
10.10.6. SWOT Analysis
10.11. Dongpeng
10.11.1. Business Overview
10.11.2. Company Snapshot
10.11.3. Company Market Share Analysis
10.11.4. Company Product Portfolio
10.11.5. Recent Developments
10.11.6. SWOT Analysis
10.12. HEGII
10.12.1. Business Overview
10.12.2. Company Snapshot
10.12.3. Company Market Share Analysis
10.12.4. Company Product Portfolio
10.12.5. Recent Developments
10.12.6. SWOT Analysis
10.13. Brondell
10.13.1. Business Overview
10.13.2. Company Snapshot
10.13.3. Company Market Share Analysis
10.13.4. Company Product Portfolio
10.13.5. Recent Developments
10.13.6. SWOT Analysis
List of Table
1. Global Smart Toilet Market, By Application, 2019-2032 (USD Billion)
2. Global Residential, Smart Toilet Market, By Region, 2019-2032 (USD Billion)
3. Global Commercial, Smart Toilet Market, By Region, 2019-2032 (USD Billion)
4. Global Smart Toilet Market, By Distribution Channel, 2019-2032 (USD Billion)
5. Global Offline, Smart Toilet Market, By Region, 2019-2032 (USD Billion)
6. Global Online, Smart Toilet Market, By Region, 2019-2032 (USD Billion)
7. North America Smart Toilet Market, By Application, 2019-2032 (USD Billion)
8. North America Smart Toilet Market, By Distribution Channel, 2019-2032 (USD Billion)
9. U.S. Smart Toilet Market, By Application, 2019-2032 (USD Billion)
10. U.S. Smart Toilet Market, By Distribution Channel, 2019-2032 (USD Billion)
11. Canada Smart Toilet Market, By Application, 2019-2032 (USD Billion)
12. Canada Smart Toilet Market, By Distribution Channel, 2019-2032 (USD Billion)
13. Mexico Smart Toilet Market, By Application, 2019-2032 (USD Billion)
14. Mexico Smart Toilet Market, By Distribution Channel, 2019-2032 (USD Billion)
15. Europe Smart Toilet Market, By Application, 2019-2032 (USD Billion)
16. Europe Smart Toilet Market, By Distribution Channel, 2019-2032 (USD Billion)
17. Germany Smart Toilet Market, By Application, 2019-2032 (USD Billion)
18. Germany Smart Toilet Market, By Distribution Channel, 2019-2032 (USD Billion)
19. France Smart Toilet Market, By Application, 2019-2032 (USD Billion)
20. France Smart Toilet Market, By Distribution Channel, 2019-2032 (USD Billion)
21. U.K. Smart Toilet Market, By Application, 2019-2032 (USD Billion)
22. U.K. Smart Toilet Market, By Distribution Channel, 2019-2032 (USD Billion)
23. Italy Smart Toilet Market, By Application, 2019-2032 (USD Billion)
24. Italy Smart Toilet Market, By Distribution Channel, 2019-2032 (USD Billion)
25. Spain Smart Toilet Market, By Application, 2019-2032 (USD Billion)
26. Spain Smart Toilet Market, By Distribution Channel, 2019-2032 (USD Billion)
27. Asia Pacific Smart Toilet Market, By Application, 2019-2032 (USD Billion)
28. Asia Pacific Smart Toilet Market, By Distribution Channel, 2019-2032 (USD Billion)
29. Japan Smart Toilet Market, By Application, 2019-2032 (USD Billion)
30. Japan Smart Toilet Market, By Distribution Channel, 2019-2032 (USD Billion)
31. China Smart Toilet Market, By Application, 2019-2032 (USD Billion)
32. China Smart Toilet Market, By Distribution Channel, 2019-2032 (USD Billion)
33. India Smart Toilet Market, By Application, 2019-2032 (USD Billion)
34. India Smart Toilet Market, By Distribution Channel, 2019-2032 (USD Billion)
35. South America Smart Toilet Market, By Application, 2019-2032 (USD Billion)
36. South America Smart Toilet Market, By Distribution Channel, 2019-2032 (USD Billion)
37. Brazil Smart Toilet Market, By Application, 2019-2032 (USD Billion)
38. Brazil Smart Toilet Market, By Distribution Channel, 2019-2032 (USD Billion)
39. Middle East and Africa Smart Toilet Market, By Application, 2019-2032 (USD Billion)
40. Middle East and Africa Smart Toilet Market, By Distribution Channel, 2019-2032 (USD Billion)
41. UAE Smart Toilet Market, By Application, 2019-2032 (USD Billion)
42. UAE Smart Toilet Market, By Distribution Channel, 2019-2032 (USD Billion)
43. South Africa Smart Toilet Market, By Application, 2019-2032 (USD Billion)
44. South Africa Smart Toilet Market, By Distribution Channel, 2019-2032 (USD Billion)
List of Figures
1. Global Smart Toilet Market Segmentation
2. Global Smart Toilet Market: Research Methodology
3. Market Size Estimation Methodology: Bottom-Up Approach
4. Market Size Estimation Methodology: Top-Down Approach
5. Data Triangulation
6. Porter’s Five Forces Analysis
7. Value Chain Analysis
8. Global Smart Toilet Market Attractiveness Analysis by Application
9. Global Smart Toilet Market Attractiveness Analysis by Distribution Channel
10. Global Smart Toilet Market Attractiveness Analysis by Region
11. Global Smart Toilet Market: Dynamics
12. Global Smart Toilet Market Share by Application (2023 & 2032)
13. Global Smart Toilet Market Share by Distribution Channel (2023 & 2032)
14. Global Smart Toilet Market Share by Regions (2023 & 2032)
15. Global Smart Toilet Market Share by Company (2022)
This study forecasts global, regional, and country revenue from 2019 to 2032. The Brainy Insights has segmented the global smart toilet market based on the below-mentioned segments:
Global Smart Toilet Market By Application:
Global Smart Toilet Market By Distribution Channel:
Global Smart Toilet Market By Region:
Research has its special purpose to undertake marketing efficiently. In this competitive scenario, businesses need information across all industry verticals; the information about customer wants, market demand, competition, industry trends, distribution channels etc. This information needs to be updated regularly because businesses operate in a dynamic environment. Our organization, The Brainy Insights incorporates scientific and systematic research procedures in order to get proper market insights and industry analysis for overall business success. The analysis consists of studying the market from a miniscule level wherein we implement statistical tools which helps us in examining the data with accuracy and precision.
Our research reports feature both; quantitative and qualitative aspects for any market. Qualitative information for any market research process are fundamental because they reveal the customer needs and wants, usage and consumption for any product/service related to a specific industry. This in turn aids the marketers/investors in knowing certain perceptions of the customers. Qualitative research can enlighten about the different product concepts and designs along with unique service offering that in turn, helps define marketing problems and generate opportunities. On the other hand, quantitative research engages with the data collection process through interviews, e-mail interactions, surveys and pilot studies. Quantitative aspects for the market research are useful to validate the hypotheses generated during qualitative research method, explore empirical patterns in the data with the help of statistical tools, and finally make the market estimations.
The Brainy Insights offers comprehensive research and analysis, based on a wide assortment of factual insights gained through interviews with CXOs and global experts and secondary data from reliable sources. Our analysts and industry specialist assume vital roles in building up statistical tools and analysis models, which are used to analyse the data and arrive at accurate insights with exceedingly informative research discoveries. The data provided by our organization have proven precious to a diverse range of companies, facilitating them to address issues such as determining which products/services are the most appealing, whether or not customers use the product in the manner anticipated, the purchasing intentions of the market and many others.
Our research methodology encompasses an idyllic combination of primary and secondary initiatives. Key phases involved in this process are listed below:

The phase involves the gathering and collecting of market data and its related information with the help of different sources & research procedures.

The data procurement stage involves in data gathering and collecting through various data sources.
This stage involves in extensive research. These data sources includes:
Purchased Database: Purchased databases play a crucial role in estimating the market sizes irrespective of the domain. Our purchased database includes:
Primary Research: The Brainy Insights interacts with leading companies and experts of the concerned domain to develop the analyst team’s market understanding and expertise. It improves and substantiates every single data presented in the market reports. Primary research mainly involves in telephonic interviews, E-mail interactions and face-to-face interviews with the raw material providers, manufacturers/producers, distributors, & independent consultants. The interviews that we conduct provides valuable data on market size and industry growth trends prevailing in the market. Our organization also conducts surveys with the various industry experts in order to gain overall insights of the industry/market. For instance, in healthcare industry we conduct surveys with the pharmacists, doctors, surgeons and nurses in order to gain insights and key information of a medical product/device/equipment which the customers are going to usage. Surveys are conducted in the form of questionnaire designed by our own analyst team. Surveys plays an important role in primary research because surveys helps us to identify the key target audiences of the market. Additionally, surveys helps to identify the key target audience engaged with the market. Our survey team conducts the survey by targeting the key audience, thus gaining insights from them. Based on the perspectives of the customers, this information is utilized to formulate market strategies. Moreover, market surveys helps us to understand the current competitive situation of the industry. To be precise, our survey process typically involve with the 360 analysis of the market. This analytical process begins by identifying the prospective customers for a product or service related to the market/industry to obtain data on how a product/service could fit into customers’ lives.

Secondary Research: The secondary data sources includes information published by the on-profit organizations such as World bank, WHO, company fillings, investor presentations, annual reports, national government documents, statistical databases, blogs, articles, white papers and others. From the annual report, we analyse a company’s revenue to understand the key segment and market share of that organization in a particular region. We analyse the company websites and adopt the product mapping technique which is important for deriving the segment revenue. In the product mapping method, we select and categorize the products offered by the companies catering to domain specific market, deduce the product revenue for each of the companies so as to get overall estimation of the market size. We also source data and analyses trends based on information received from supply side and demand side intermediaries in the value chain. The supply side denotes the data gathered from supplier, distributor, wholesaler and the demand side illustrates the data gathered from the end customers for respective market domain.

The supply side for a domain specific market is analysed by:
The demand side for the market is estimated through:
In-house Library: Apart from these third-party sources, we have our in-house library of qualitative and quantitative information. Our in-house database includes market data for various industry and domains. These data are updated on regular basis as per the changing market scenario. Our library includes, historic databases, internal audit reports and archives.
Sometimes there are instances where there is no metadata or raw data available for any domain specific market. For those cases, we use our expertise to forecast and estimate the market size in order to generate comprehensive data sets. Our analyst team adopt a robust research technique in order to produce the estimates:
Data Synthesis: This stage involves the analysis & mapping of all the information obtained from the previous step. It also involves in scrutinizing the data for any discrepancy observed while data gathering related to the market. The data is collected with consideration to the heterogeneity of sources. Robust scientific techniques are in place for synthesizing disparate data sets and provide the essential contextual information that can orient market strategies. The Brainy Insights has extensive experience in data synthesis where the data passes through various stages:


Market Deduction & Formulation: The final stage comprises of assigning data points at appropriate market spaces so as to deduce feasible conclusions. Analyst perspective & subject matter expert based holistic form of market sizing coupled with industry analysis also plays a crucial role in this stage.
This stage involves in finalization of the market size and numbers that we have collected from data integration step. With data interpolation, it is made sure that there is no gap in the market data. Successful trend analysis is done by our analysts using extrapolation techniques, which provide the best possible forecasts for the market.
Data Validation & Market Feedback: Validation is the most important step in the process. Validation & re-validation via an intricately designed process helps us finalize data-points to be used for final calculations.

The Brainy Insights interacts with leading companies and experts of the concerned domain to develop the analyst team’s market understanding and expertise. It improves and substantiates every single data presented in the market reports. The data validation interview and discussion panels are typically composed of the most experienced industry members. The participants include, however, are not limited to:
Moreover, we always validate our data and findings through primary respondents from all the major regions we are working on.


Free Customization
Fortune 500 Clients
Free Yearly Update On Purchase Of Multi/Corporate License
Companies Served Till Date