- +1-315-215-1633
- sales@thebrainyinsights.com

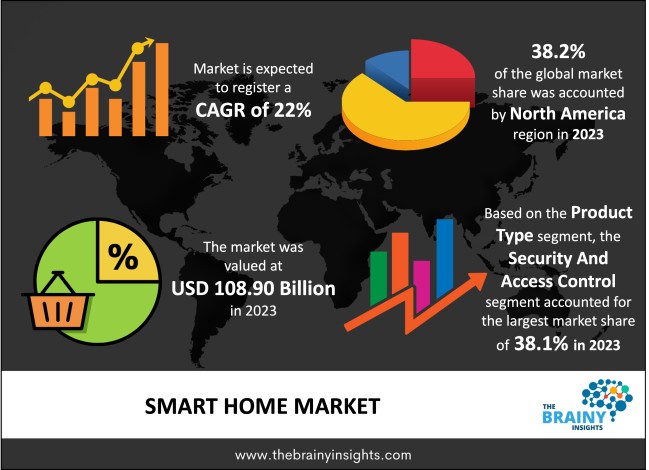
The global smart home market was valued at USD 108.90 billion in 2023 and grew at a CAGR of 22% from 2024 to 2033. The market is expected to reach USD 802.05 billion by 2033. Increasing disposable income of consumers will drive the growth of the global smart home market. The expected rise in using artificial intelligence (AI) technology to enhance smart home devices is predicted to boost product consumption. The growing widespread adoption of smartphones and internet usage globally further necessitates greater connectivity for these systems. Smart homes with AI-powered computerized assistance offer seamless device distribution using touchless voice commands, a preferred trend among consumers. Digital assistants integrated into smart home appliances, such as Bluetooth speakers, provide hands-free controls like channel changing, significantly expanding their appeal to prospective buyers. Google's virtual assistant features have been designed to enable users to type messages or commands efficiently through vocal prompts.
A home which is automated with smart heating, lighting, and other devices and systems and can be managed and controlled remotely from one place/device is called a smart home. A smart home will have smart alarm systems, bulbs, refrigerators, lighting controls, thermostats, etc. The goal is to optimize energy efficiency, improve safety and security while enhancing users' quality of life and convenience. Smart technologies can assess energy use and optimize the data to reduce energy usage. Additionally, all smart home appliances can be interconnected and made accessible from a single hub, like a smartphone, tablet, or laptop. It can also be accessed, monitored, and controlled remotely. Technological innovations have enabled the integration of IoT in smart homes, which employs sensors that gathers data about the appliances and their daily use and optimizes energy usage accordingly with its data analyzing systems. The systems can also be voice-activated or protected with fingerprints, iris scans etc., depending on the level of security the user desires. The ease of use, convenience, flexibility and reliability offered in smart homes drive their demand in the modern world.
Get an overview of this study by requesting a free sample
The increasing disposable income of consumers – the increasing disposable income of the population has increased the demand for smart technologies in their homes, offices, and commercial utility spaces, among others. The increasing disposable income has increased the willingness and desirability of consumers for high-end products such as smart home appliances, security systems etc. these products offer convenience, ease of use, save time and require less effort, which is ideal for the modern world with busy schedules. The environmental consciousness of the consumers is also driving the demand for smart homes as they are more energy-efficient. The presence of significant market players is catering to the rising consumer demand. Therefore, the increasing disposable income of consumers will drive the global smart home market’s growth.
The lack of interoperability between different brands – smart homes integrate several smart commodities like thermostats, bulbs, doorbells, cameras, refrigerators, HVAC systems etc. Consumers do not generally buy all these products from the same brand. They choose the best products according to their needs and requirements, which are from different brands. The operating systems, technology, software etc., used by brands differ from one to another. They might not necessarily integrate. Integrating different devices with each other is difficult, given the lack of interoperability between different brands, hampering the market's growth. It is usually more restrictive when users retrofit their homes than when these appliances are installed in new homes.
The development and integration of new technologies – the concept of smart homes is still new in the market. Most smart home technology is still manually operated by users through their phones. They manually set up the temperature, lighting, and alarm systems according to their routines. However, the technological advancements made in Artificial intelligence and the adoption of IoT can fully automate the smart home experience for users. For instance, AI can collect data from all connected devices, streamline it, and process and develop a routine in and around the user's daily activities. This would enable Ai integrated smart home systems to operate automatically without cue according to the user's usual activities. IoT uses sensors to detect changes and act accordingly without manual intervention. Automatic lighting controls in the presence of living beings are an example. Therefore, developing and integrating new technologies can offer lucrative opportunities in the global smart home market.
The regions analyzed for the market include North America, Europe, South America, Asia Pacific, the Middle East, and Africa. North America emerged as the largest global smart home market, with a 38.2% market revenue share in 2023.
The high per capita income of the region is driving smart home demand. The rising dependency on technology and smart devices also contributes to the regional market's growth. The well-established internet infrastructure is facilitating the market's growth. Significant market players offering a wide range of products through an expansive distribution network augment the regional market's development. The growth of the real estate market and increasing homeownership will also bode well for the market.
North America Region Smart Home Market Share in 2023 – 38.2%
www.thebrainyinsights.com
Check the geographical analysis of this market by requesting a free sample
The product type segment is divided into lighting controls, security and access controls, HVAC controls, entertainment controls, smart home appliances, smart furniture, and others. The security and access control segment dominated the market, with a market share of 38.1% in 2023. Smart security systems consist of alarms, cameras, locks and fingerprinted access controls, among other things. These devices protect homes from intruders, theft, and other threats. The access controls offer flexibility and choice to consumers. The real time-monitoring improves the safety and security of homes. Remote accessibility enables accessibility from anywhere. They are easy to use and are highly reliable. They offer real-time security alerts and video surveillance solutions. The increasing pet ownership is also driving the adoption of real-time video surveillance and monitoring. The willingness of consumers to pay for home security, given the sense of peace and safety it brings to the family, belongings, and property, will drive the segment's growth.
The protocols segment is divided into wired, hybrid and wireless. The wireless segment dominated the market, with a market share of 46.1% in 2023. The increasing internet penetration with the rising smart connected devices ownership has paved the way for the growing adoption of wireless protocols. They are hassle-free to install, use and operate. They offer remote access controls and monitoring. They do not require substantive hardware. They improve speed, efficiency and offer flexibility. They are cost-effective and easy to upgrade. Therefore, the wireless segment dominates the market.
The sales channel segment is divided into direct sales, supermarkets/hypermarkets, speciality stores, department stores, online and others. The speciality stores segment dominated the market, with a market share of 43.1% in 2023. Speciality stores offer a narrow range of products; however, they specialize in those products, which means consumers can get a wide variety of choices in one place. They have qualified personnel to help consumers choose the right products according to their needs and requirements. The demonstrations at the stores are also a driving point for the segment's dominance. The after-sales service is highly regarded, which contributes to their growing popularity. Furthermore, smart home products are high-end commodities which require a pre-requisite set-up for their display, operation and functioning, which speciality stores offer.
| Attribute | Description |
|---|---|
| Market Size | Revenue (USD Billion) |
| Market size value in 2023 | USD 108.90 Billion |
| Market size value in 2033 | USD 802.05 Billion |
| CAGR (2024 to 2033) | 22% |
| Historical data | 2020-2022 |
| Base Year | 2023 |
| Forecast | 2024-2033 |
| Region | The regions analyzed for the market are Asia Pacific, Europe, South America, North America, and Middle East & Africa. Furthermore, the regions are further analyzed at the country level. |
| Segments | Product Type, Protocols and Sales Channel |
As per The Brainy Insights, the size of the global smart home market was valued at USD 108.90 billion in 2023 to USD 802.05 billion by 2033.
Global smart home market is growing at a CAGR of 22% during the forecast period 2024-2033.
The market's growth will be influenced by the increasing disposable income of consumers.
The lack of interoperability between different brands could hamper the market growth.
1. Introduction
1.1. Objectives of the Study
1.2. Market Definition
1.3. Research Scope
1.4. Currency
1.5. Key Target Audience
2. Research Methodology and Assumptions
3. Executive Summary
4. Premium Insights
4.1. Porter’s Five Forces Analysis
4.2. Value Chain Analysis
4.3. Top Investment Pockets
4.3.1. Market Attractiveness Analysis by Product Type
4.3.2. Market Attractiveness Analysis by Protocols
4.3.3. Market Attractiveness Analysis by Sales Channel
4.3.4. Market Attractiveness Analysis by Region
4.4. Industry Trends
5. Market Dynamics
5.1. Market Evaluation
5.2. Drivers
5.2.1. The increasing disposable income of consumers
5.3. Restraints
5.3.1. The lack of interoperability between different brands
5.4. Opportunities
5.4.1. The development and integration of new technologies
5.5. Challenges
5.5.1. The rising threat of cyberattacks
6. Global Smart Home Market Analysis and Forecast, By Product Type
6.1. Segment Overview
6.2. Lighting Controls
6.3. Security and Access Controls
6.4. HVAC Controls
6.5. Entertainment Controls
6.6. Smart Home Appliances
6.7. Smart Furniture
6.8. Others
7. Global Smart Home Market Analysis and Forecast, By Protocols
7.1. Segment Overview
7.2. Wired
7.3. Hybrid
7.4. Wireless
8. Global Smart Home Market Analysis and Forecast, By Sales Channel
8.1. Segment Overview
8.2. Direct Sales
8.3. Supermarkets/Hypermarkets
8.4. Specialty Stores
8.5. Department Stores
8.6. Online
8.7. Others
9. Global Smart Home Market Analysis and Forecast, By Regional Analysis
9.1. Segment Overview
9.2. North America
9.2.1. U.S.
9.2.2. Canada
9.2.3. Mexico
9.3. Europe
9.3.1. Germany
9.3.2. France
9.3.3. U.K.
9.3.4. Italy
9.3.5. Spain
9.4. Asia-Pacific
9.4.1. Japan
9.4.2. China
9.4.3. India
9.5. South America
9.5.1. Brazil
9.6. Middle East and Africa
9.6.1. UAE
9.6.2. South Africa
10. Global Smart Home Market-Competitive Landscape
10.1. Overview
10.2. Market Share of Key Players in the Smart Home Market
10.2.1. Global Company Market Share
10.2.2. North America Company Market Share
10.2.3. Europe Company Market Share
10.2.4. APAC Company Market Share
10.3. Competitive Situations and Trends
10.3.1. Product Launches and Developments
10.3.2. Partnerships, Collaborations, and Agreements
10.3.3. Mergers & Acquisitions
10.3.4. Expansions
11. Company Profiles
11.1. ABB Ltd.
11.1.1. Business Overview
11.1.2. Company Snapshot
11.1.3. Company Market Share Analysis
11.1.4. Company Product Portfolio
11.1.5. Recent Developments
11.1.6. SWOT Analysis
11.2. Amazon
11.2.1. Business Overview
11.2.2. Company Snapshot
11.2.3. Company Market Share Analysis
11.2.4. Company Product Portfolio
11.2.5. Recent Developments
11.2.6. SWOT Analysis
11.3. Centrica Connected Home Ltd.
11.3.1. Business Overview
11.3.2. Company Snapshot
11.3.3. Company Market Share Analysis
11.3.4. Company Product Portfolio
11.3.5. Recent Developments
11.3.6. SWOT Analysis
11.4. Crestron Electronics
11.4.1. Business Overview
11.4.2. Company Snapshot
11.4.3. Company Market Share Analysis
11.4.4. Company Product Portfolio
11.4.5. Recent Developments
11.4.6. SWOT Analysis
11.5. Honeywell International
11.5.1. Business Overview
11.5.2. Company Snapshot
11.5.3. Company Market Share Analysis
11.5.4. Company Product Portfolio
11.5.5. Recent Developments
11.5.6. SWOT Analysis
11.6. Johnson Controls Inc.
11.6.1. Business Overview
11.6.2. Company Snapshot
11.6.3. Company Market Share Analysis
11.6.4. Company Product Portfolio
11.6.5. Recent Developments
11.6.6. SWOT Analysis
11.7. Samsung Group
11.7.1. Business Overview
11.7.2. Company Snapshot
11.7.3. Company Market Share Analysis
11.7.4. Company Product Portfolio
11.7.5. Recent Developments
11.7.6. SWOT Analysis
11.8. Schneider Electric SE
11.8.1. Business Overview
11.8.2. Company Snapshot
11.8.3. Company Market Share Analysis
11.8.4. Company Product Portfolio
11.8.5. Recent Developments
11.8.6. SWOT Analysis
11.9. Siemens
11.9.1. Business Overview
11.9.2. Company Snapshot
11.9.3. Company Market Share Analysis
11.9.4. Company Product Portfolio
11.9.5. Recent Developments
11.9.6. SWOT Analysis
11.10. Sony Corporation
11.10.1. Business Overview
11.10.2. Company Snapshot
11.10.3. Company Market Share Analysis
11.10.4. Company Product Portfolio
11.10.5. Recent Developments
11.10.6. SWOT Analysis
List of Table
1. Global Smart Home Market, By Product Type, 2020-2033 (USD Billion)
2. Global Lighting Controls Smart Home Market, By Region, 2020-2033 (USD Billion)
3. Global Security and Access Controls Smart Home Market, By Region, 2020-2033 (USD Billion)
4. Global HVAC Controls Smart Home Market, By Region, 2020-2033 (USD Billion)
5. Global Entertainment Controls Smart Home Market, By Region, 2020-2033 (USD Billion)
6. Global Smart Home Appliances Smart Home Market, By Region, 2020-2033 (USD Billion)
7. Global Smart Furniture Smart Home Market, By Region, 2020-2033 (USD Billion)
8. Global Others Smart Home Market, By Region, 2020-2033 (USD Billion)
9. Global Smart Home Market, By Protocols, 2020-2033 (USD Billion)
10. Global Wired Smart Home Market, By Region, 2020-2033 (USD Billion)
11. Global Hybrid Smart Home Market, By Region, 2020-2033 (USD Billion)
12. Global Wireless Smart Home Market, By Region, 2020-2033 (USD Billion)
13. Global Smart Home Market, By Sales Channel, 2020-2033 (USD Billion)
14. Global Direct Sales Smart Home Market, By Region, 2020-2033 (USD Billion)
15. Global Supermarkets/Hypermarkets Smart Home Market, By Region, 2020-2033 (USD Billion)
16. Global Specialty Stores Smart Home Market, By Region, 2020-2033 (USD Billion)
17. Global Department Stores Smart Home Market, By Region, 2020-2033 (USD Billion)
18. Global Online Smart Home Market, By Region, 2020-2033 (USD Billion)
19. Global Others Smart Home Market, By Region, 2020-2033 (USD Billion)
20. Global Smart Home Market, By Region, 2020-2033 (USD Billion)
21. North America Smart Home Market, By Product Type, 2020-2033 (USD Billion)
22. North America Smart Home Market, By Protocols, 2020-2033 (USD Billion)
23. North America Smart Home Market, By Sales Channel, 2020-2033 (USD Billion)
24. U.S. Smart Home Market, By Product Type, 2020-2033 (USD Billion)
25. U.S. Smart Home Market, By Protocols, 2020-2033 (USD Billion)
26. U.S. Smart Home Market, By Sales Channel, 2020-2033 (USD Billion)
27. Canada Smart Home Market, By Product Type, 2020-2033 (USD Billion)
28. Canada Smart Home Market, By Protocols, 2020-2033 (USD Billion)
29. Canada Smart Home Market, By Sales Channel, 2020-2033 (USD Billion)
30. Mexico Smart Home Market, By Product Type, 2020-2033 (USD Billion)
31. Mexico Smart Home Market, By Protocols, 2020-2033 (USD Billion)
32. Mexico Smart Home Market, By Sales Channel, 2020-2033 (USD Billion)
33. Europe Smart Home Market, By Product Type, 2020-2033 (USD Billion)
34. Europe Smart Home Market, By Protocols, 2020-2033 (USD Billion)
35. Europe Smart Home Market, By Sales Channel, 2020-2033 (USD Billion)
36. Germany Smart Home Market, By Product Type, 2020-2033 (USD Billion)
37. Germany Smart Home Market, By Protocols, 2020-2033 (USD Billion)
38. Germany Smart Home Market, By Sales Channel, 2020-2033 (USD Billion)
39. France Smart Home Market, By Product Type, 2020-2033 (USD Billion)
40. France Smart Home Market, By Protocols, 2020-2033 (USD Billion)
41. France Smart Home Market, By Sales Channel, 2020-2033 (USD Billion)
42. U.K. Smart Home Market, By Product Type, 2020-2033 (USD Billion)
43. U.K. Smart Home Market, By Protocols, 2020-2033 (USD Billion)
44. U.K. Smart Home Market, By Sales Channel, 2020-2033 (USD Billion)
45. Italy Smart Home Market, By Product Type, 2020-2033 (USD Billion)
46. Italy Smart Home Market, By Protocols, 2020-2033 (USD Billion)
47. Italy Smart Home Market, By Sales Channel, 2020-2033 (USD Billion)
48. Spain Smart Home Market, By Product Type, 2020-2033 (USD Billion)
49. Spain Smart Home Market, By Protocols, 2020-2033 (USD Billion)
50. Spain Smart Home Market, By Sales Channel, 2020-2033 (USD Billion)
51. Asia Pacific Smart Home Market, By Product Type, 2020-2033 (USD Billion)
52. Asia Pacific Smart Home Market, By Protocols, 2020-2033 (USD Billion)
53. Asia Pacific Smart Home Market, By Sales Channel, 2020-2033 (USD Billion)
54. Japan Smart Home Market, By Product Type, 2020-2033 (USD Billion)
55. Japan Smart Home Market, By Protocols, 2020-2033 (USD Billion)
56. Japan Smart Home Market, By Sales Channel, 2020-2033 (USD Billion)
57. China Smart Home Market, By Product Type, 2020-2033 (USD Billion)
58. China Smart Home Market, By Protocols, 2020-2033 (USD Billion)
59. China Smart Home Market, By Sales Channel, 2020-2033 (USD Billion)
60. India Smart Home Market, By Product Type, 2020-2033 (USD Billion)
61. India Smart Home Market, By Protocols, 2020-2033 (USD Billion)
62. India Smart Home Market, By Sales Channel, 2020-2033 (USD Billion)
63. South America Smart Home Market, By Product Type, 2020-2033 (USD Billion)
64. South America Smart Home Market, By Protocols, 2020-2033 (USD Billion)
65. South America Smart Home Market, By Sales Channel, 2020-2033 (USD Billion)
66. Brazil Smart Home Market, By Product Type, 2020-2033 (USD Billion)
67. Brazil Smart Home Market, By Protocols, 2020-2033 (USD Billion)
68. Brazil Smart Home Market, By Sales Channel, 2020-2033 (USD Billion)
69. Middle East and Africa Smart Home Market, By Product Type, 2020-2033 (USD Billion)
70. Middle East and Africa Smart Home Market, By Protocols, 2020-2033 (USD Billion)
71. Middle East and Africa Smart Home Market, By Sales Channel, 2020-2033 (USD Billion)
72. UAE Smart Home Market, By Product Type, 2020-2033 (USD Billion)
73. UAE Smart Home Market, By Protocols, 2020-2033 (USD Billion)
74. UAE Smart Home Market, By Sales Channel, 2020-2033 (USD Billion)
75. South Africa Smart Home Market, By Product Type, 2020-2033 (USD Billion)
76. South Africa Smart Home Market, By Protocols, 2020-2033 (USD Billion)
77. South Africa Smart Home Market, By Sales Channel, 2020-2033 (USD Billion)
List of Figures
1. Global Smart Home Market Segmentation
2. Smart Home Market: Research Methodology
3. Market Size Estimation Methodology: Bottom-Up Approach
4. Market Size Estimation Methodology: Top-Down Approach
5. Data Triangulation
6. Porter’s Five Forces Analysis
7. Value Chain Analysis
8. Global Smart Home Market Attractiveness Analysis by Product Type
9. Global Smart Home Market Attractiveness Analysis by Protocols
10. Global Smart Home Market Attractiveness Analysis by Sales Channel
11. Global Smart Home Market Attractiveness Analysis by Region
12. Global Smart Home Market: Dynamics
13. Global Smart Home Market Share by Product Type (2023 & 2033)
14. Global Smart Home Market Share by Protocols (2023 & 2033)
15. Global Smart Home Market Share by Sales Channel (2023 & 2033)
16. Global Smart Home Market Share by Regions (2023 & 2033)
17. Global Smart Home Market Share by Company (2023)
This study forecasts revenue at global, regional, and country levels from 2020 to 2033. The Brainy Insights has segmented the global smart home market based on below mentioned segments:
Global Smart Home Market by Product Type:
Global Smart Home Market by Protocols:
Global Smart Home Market by Sales Channel:
Global Smart Home Market by Region:
Research has its special purpose to undertake marketing efficiently. In this competitive scenario, businesses need information across all industry verticals; the information about customer wants, market demand, competition, industry trends, distribution channels etc. This information needs to be updated regularly because businesses operate in a dynamic environment. Our organization, The Brainy Insights incorporates scientific and systematic research procedures in order to get proper market insights and industry analysis for overall business success. The analysis consists of studying the market from a miniscule level wherein we implement statistical tools which helps us in examining the data with accuracy and precision.
Our research reports feature both; quantitative and qualitative aspects for any market. Qualitative information for any market research process are fundamental because they reveal the customer needs and wants, usage and consumption for any product/service related to a specific industry. This in turn aids the marketers/investors in knowing certain perceptions of the customers. Qualitative research can enlighten about the different product concepts and designs along with unique service offering that in turn, helps define marketing problems and generate opportunities. On the other hand, quantitative research engages with the data collection process through interviews, e-mail interactions, surveys and pilot studies. Quantitative aspects for the market research are useful to validate the hypotheses generated during qualitative research method, explore empirical patterns in the data with the help of statistical tools, and finally make the market estimations.
The Brainy Insights offers comprehensive research and analysis, based on a wide assortment of factual insights gained through interviews with CXOs and global experts and secondary data from reliable sources. Our analysts and industry specialist assume vital roles in building up statistical tools and analysis models, which are used to analyse the data and arrive at accurate insights with exceedingly informative research discoveries. The data provided by our organization have proven precious to a diverse range of companies, facilitating them to address issues such as determining which products/services are the most appealing, whether or not customers use the product in the manner anticipated, the purchasing intentions of the market and many others.
Our research methodology encompasses an idyllic combination of primary and secondary initiatives. Key phases involved in this process are listed below:

The phase involves the gathering and collecting of market data and its related information with the help of different sources & research procedures.

The data procurement stage involves in data gathering and collecting through various data sources.
This stage involves in extensive research. These data sources includes:
Purchased Database: Purchased databases play a crucial role in estimating the market sizes irrespective of the domain. Our purchased database includes:
Primary Research: The Brainy Insights interacts with leading companies and experts of the concerned domain to develop the analyst team’s market understanding and expertise. It improves and substantiates every single data presented in the market reports. Primary research mainly involves in telephonic interviews, E-mail interactions and face-to-face interviews with the raw material providers, manufacturers/producers, distributors, & independent consultants. The interviews that we conduct provides valuable data on market size and industry growth trends prevailing in the market. Our organization also conducts surveys with the various industry experts in order to gain overall insights of the industry/market. For instance, in healthcare industry we conduct surveys with the pharmacists, doctors, surgeons and nurses in order to gain insights and key information of a medical product/device/equipment which the customers are going to usage. Surveys are conducted in the form of questionnaire designed by our own analyst team. Surveys plays an important role in primary research because surveys helps us to identify the key target audiences of the market. Additionally, surveys helps to identify the key target audience engaged with the market. Our survey team conducts the survey by targeting the key audience, thus gaining insights from them. Based on the perspectives of the customers, this information is utilized to formulate market strategies. Moreover, market surveys helps us to understand the current competitive situation of the industry. To be precise, our survey process typically involve with the 360 analysis of the market. This analytical process begins by identifying the prospective customers for a product or service related to the market/industry to obtain data on how a product/service could fit into customers’ lives.

Secondary Research: The secondary data sources includes information published by the on-profit organizations such as World bank, WHO, company fillings, investor presentations, annual reports, national government documents, statistical databases, blogs, articles, white papers and others. From the annual report, we analyse a company’s revenue to understand the key segment and market share of that organization in a particular region. We analyse the company websites and adopt the product mapping technique which is important for deriving the segment revenue. In the product mapping method, we select and categorize the products offered by the companies catering to domain specific market, deduce the product revenue for each of the companies so as to get overall estimation of the market size. We also source data and analyses trends based on information received from supply side and demand side intermediaries in the value chain. The supply side denotes the data gathered from supplier, distributor, wholesaler and the demand side illustrates the data gathered from the end customers for respective market domain.

The supply side for a domain specific market is analysed by:
The demand side for the market is estimated through:
In-house Library: Apart from these third-party sources, we have our in-house library of qualitative and quantitative information. Our in-house database includes market data for various industry and domains. These data are updated on regular basis as per the changing market scenario. Our library includes, historic databases, internal audit reports and archives.
Sometimes there are instances where there is no metadata or raw data available for any domain specific market. For those cases, we use our expertise to forecast and estimate the market size in order to generate comprehensive data sets. Our analyst team adopt a robust research technique in order to produce the estimates:
Data Synthesis: This stage involves the analysis & mapping of all the information obtained from the previous step. It also involves in scrutinizing the data for any discrepancy observed while data gathering related to the market. The data is collected with consideration to the heterogeneity of sources. Robust scientific techniques are in place for synthesizing disparate data sets and provide the essential contextual information that can orient market strategies. The Brainy Insights has extensive experience in data synthesis where the data passes through various stages:


Market Deduction & Formulation: The final stage comprises of assigning data points at appropriate market spaces so as to deduce feasible conclusions. Analyst perspective & subject matter expert based holistic form of market sizing coupled with industry analysis also plays a crucial role in this stage.
This stage involves in finalization of the market size and numbers that we have collected from data integration step. With data interpolation, it is made sure that there is no gap in the market data. Successful trend analysis is done by our analysts using extrapolation techniques, which provide the best possible forecasts for the market.
Data Validation & Market Feedback: Validation is the most important step in the process. Validation & re-validation via an intricately designed process helps us finalize data-points to be used for final calculations.

The Brainy Insights interacts with leading companies and experts of the concerned domain to develop the analyst team’s market understanding and expertise. It improves and substantiates every single data presented in the market reports. The data validation interview and discussion panels are typically composed of the most experienced industry members. The participants include, however, are not limited to:
Moreover, we always validate our data and findings through primary respondents from all the major regions we are working on.


Free Customization
Fortune 500 Clients
Free Yearly Update On Purchase Of Multi/Corporate License
Companies Served Till Date