- +1-315-215-1633
- sales@thebrainyinsights.com

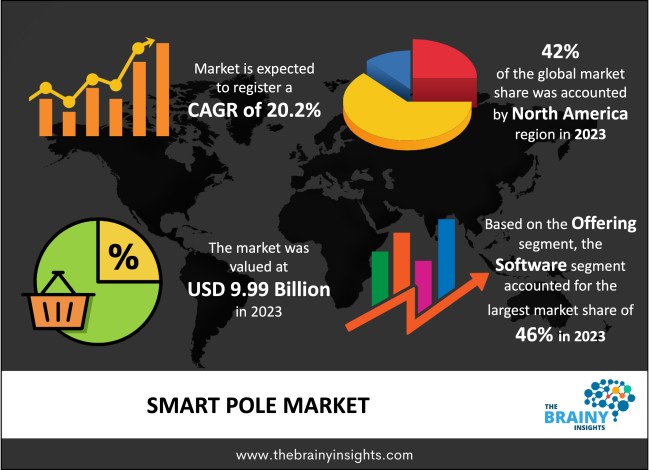
The global smart pole market is expected to reach USD 62.93 billion by 2033, at a CAGR of 20.2% during the forecast period 2024 to 2033. The increasing initiatives by the government to build smart cities and the rising need for energy-efficient pole lighting systems drive the market's growth. Smart poles are made using advanced technology. For this reason, they are used for public safety and also for obtaining weather information. Emergency call buttons and security cameras are installed on these poles for public safety, making it easy to keep the public safe. By installing environmental sensors, the weather department will have access to real-time information about the weather in every city area. This can be used to predict the coming disaster, and the coming disaster can be avoided, which can prevent the damage caused.
The smart pole is an entirely unified street lighting technology that uses wireless connectivity, smart LED streetlights, sensors, and other functions to connect multiple parties' information and communication technology. These can also be remotely controlled. This system has various attributes like Wi-Fi connectivity, electric vehicle charging, pollution sensors, and an intelligent traffic management system. The adoption of this smart system is assisting in increasing the security network, which will decrease accident rates and provide a quick response to any such emergencies. The designers of the smart pole technology have integrated the pole with 5G wireless technology and the 4G LTE technology.
Along with smart sensors and vehicle parking crime, this technology monitors accidents and weather conditions. The installation of this system furnishes a better landscape view for the smart city. In the last few years, installing this smart pole system has proven to serve as a multifunctional tool other than just providing lights in the street. This system seems to be enhancing the lives of the citizens and the status of the governments by meeting the needs of the smart city. These smart poles also help reduce operational costs. Their use is limited only to street lights and surveillance cameras installed on them. These poles can also improve connectivity and increase range. With this, many facilities can be provided on a single pole, so there will be no need to install a separate pole.
Get an overview of this study by requesting a free sample
The growing consciousness about global warming and ozone layer depletion has prompted the government to generate specific policies to reduce carbon dioxide emissions. Smart poles can also reduce energy consumption costs. The reducing cost of LED lights and the high return on investment (ROI) from smart lighting seems to be the major driving force behind this system. The various facilities like electric vehicle charging, wi-fi connectivity, and pollution sensors are also enhancing the growth of this system. Some functions like daylight saving and real-time monitoring are increasing the demand. Smart poles can also reduce the cost of energy consumption. All these factors together are the driving forces of the systems.
The cost of implementation of this system is very high. This system's higher infrastructure and equipment cost than the traditional poles is a major restrain as street light is a vital requirement for the public that the government cannot compromise with. Also, installing the smart poles requires many hardware and software like dimmers, communication devices, control systems, and sensors which are very expensive for the government to afford. This is a significant factor restricting the large-scale adoption of this method. Various other factors like location, source, and wattage type also hamper the growth of this system.
The progress in communication technology, for decades, has led to widespread economic growth both in big and small cities. The planning to launch the 5G technology and create a smart city is a significant opportunity for the smart pole market to grow. Various government initiatives are being taken in counties like China, India, Japan, and Australia to compensate for replacing traditional pole systems with this new technology to reduce energy consumption by 40%. The traffic management attributes of the design like traffic monitoring, vehicle monitoring, traffic guidance, and parking guidance can help reduce traffic jams and prevent accidents which is a significant growth opportunity for the system.
The limited budget is posing challenges for the installation of this smart system. After the Covid-19 outbreak, the various governments of the developed and developing countries are lagging in the infrastructure and construction of the projects due to a shortage of laborers and workers, affecting the growth of the smart pole market. Another drawback is that the smart pole system cannot withstand harsh weather conditions. The accumulation of dust, mist, and snow can interrupt the smooth running of the system. Several factors, along with the high cost linked with the technology integration, pose challenges to this system.
The global smart pole market has been segmented based on offering, installation type, application, and regions.
The regions analyzed for the smart pole market include North America, Europe, South America, Asia Pacific, the Middle East, and Africa. North America emerged as the largest market for the global smart pole market, with a 42% share of the market revenue in 2023.
North America dominated the smart pole market with a 42% share of the market revenue in 2023. The early installation of smart poles in the cities of North America drives the growth of the market in the region. Many projects are being undertaken in North America, be it the retrofitting ones or the new smart pole installation, which adds impetus to the market's growth.
North America Region Smart Pole Market Share in 2023 - 42%
www.thebrainyinsights.com
Check the geographical analysis of this market by requesting a free sample
The key players are now concentrating on implementing strategies such as adopting new applications, product innovations, mergers & acquisitions, joint ventures, alliances, and partnerships to improve their market position in the global smart pole market industry.
As per The Brainy Insights, the size of the smart pole market was valued at USD 9.99 billion in 2023 to USD 62.93 billion by 2033.
The global smart pole market is growing at a CAGR of 20.2% during the forecast period 2024-2033.
The North American region emerged as the largest market for smart pole.
The market's growth will be influenced by reducing energy consumption and growing awareness of pollution.
The high cost of implementation of the system could hamper the market growth.
The launch of 5G technology and other government initiatives will provide huge opportunities to the market.
Key players are Philips Lighting Holding B.V, Hubbell Incorporated, General Electric, Cree, Inc., Eaton Corporation, Acuity Brands, SYSKA LED, Zumtobel Group, Maven Systems Pvt., and Neptun Light Inc.
1. Introduction
1.1. Objectives of the Study
1.2. Market Definition
1.3. Research Scope
1.4. Currency
1.5. Key Target Audience
2. Research Methodology and Assumptions
3. Executive Summary
4. Premium Insights
4.1. Porter’s Five Forces Analysis
4.2. Value Chain Analysis
4.3. Top Investment Pockets
4.3.1. Market Attractiveness Analysis By Offering
4.3.2. Market Attractiveness Analysis By Installation Type
4.3.3. Market Attractiveness Analysis By Application
4.3.4. Market Attractiveness Analysis By Region
4.4. Industry Trends
5. Market Dynamics
5.1. Market Evaluation
5.2. Drivers
5.2.1. Reducing energy consumption and growing awareness of pollution
5.3. Restraints
5.3.1. The high cost of implementation of the system
5.4. Opportunities
5.4.1. Launch of 5G technology and other government initiatives
5.5. Challenges
5.5.1. Limited budget for the installation of the system
6. Global Smart Pole Market Analysis and Forecast, By Offering
6.1. Segment Overview
6.2. Software
6.3. Component
6.4. Services
7. Global Smart Pole Market Analysis and Forecast, By Installation Type
7.1. Segment Overview
7.2. New Installation
7.3. Retrofit
8. Global Smart Pole Market Analysis and Forecast, By Application
8.1. Segment Overview
8.2. Public Places
8.3. Highways & Roadways
8.4. Railways & Harbors
9. Global Smart Pole Market Analysis and Forecast, By Regional Analysis
9.1. Segment Overview
9.2. North America
9.2.1. U.S.
9.2.2. Canada
9.2.3. Mexico
9.3. Europe
9.3.1. Germany
9.3.2. France
9.3.3. U.K.
9.3.4. Italy
9.3.5. Spain
9.4. Asia-Pacific
9.4.1. Japan
9.4.2. China
9.4.3. India
9.5. South America
9.5.1. Brazil
9.6. Middle East and Africa
9.6.1. UAE
9.6.2. South Africa
10. Global Smart Pole Market-Competitive Landscape
10.1. Overview
10.1.1. Market Share of Key Players in the Smart Pole Market
10.1.2. Global Company Market Share
10.1.3. North America Company Market Share
10.1.4. Europe Company Market Share
10.1.5. APAC Company Market Share
10.2. Competitive Situations and Trends
10.2.1. Product Launches and Developments
10.2.2. Partnerships, Collaborations, and Agreements
10.2.3. Mergers & Acquisitions
10.2.4. Expansions
11. Company Profiles
11.1. Philips Lighting Holding B.V
11.1.1. Business Overview
11.1.2. Company Snapshot
11.1.3. Company Market Share Analysis
11.1.4. Company Component Portfolio
11.1.5. Recent Developments
11.1.6. SWOT Analysis
11.2. Hubbell Incorporated
11.2.1. Business Overview
11.2.2. Company Snapshot
11.2.3. Company Market Share Analysis
11.2.4. Company Component Portfolio
11.2.5. Recent Developments
11.2.6. SWOT Analysis
11.3. General Electric
11.3.1. Business Overview
11.3.2. Company Snapshot
11.3.3. Company Market Share Analysis
11.3.4. Company Component Portfolio
11.3.5. Recent Developments
11.3.6. SWOT Analysis
11.4. Cree, Inc.
11.4.1. Business Overview
11.4.2. Company Snapshot
11.4.3. Company Market Share Analysis
11.4.4. Company Component Portfolio
11.4.5. Recent Developments
11.4.6. SWOT Analysis
11.5. Eaton Corporation
11.5.1. Business Overview
11.5.2. Company Snapshot
11.5.3. Company Market Share Analysis
11.5.4. Company Component Portfolio
11.5.5. Recent Developments
11.5.6. SWOT Analysis
11.6. Acuity Brands
11.6.1. Business Overview
11.6.2. Company Snapshot
11.6.3. Company Market Share Analysis
11.6.4. Company Component Portfolio
11.6.5. Recent Developments
11.6.6. SWOT Analysis
11.7. SYSKA LED
11.7.1. Business Overview
11.7.2. Company Snapshot
11.7.3. Company Market Share Analysis
11.7.4. Company Component Portfolio
11.7.5. Recent Developments
11.7.6. SWOT Analysis
11.8. Zumtobel Group
11.8.1. Business Overview
11.8.2. Company Snapshot
11.8.3. Company Market Share Analysis
11.8.4. Company Component Portfolio
11.8.5. Recent Developments
11.8.6. SWOT Analysis
11.9. Maven Systems Pvt.
11.9.1. Business Overview
11.9.2. Company Snapshot
11.9.3. Company Market Share Analysis
11.9.4. Company Component Portfolio
11.9.5. Recent Developments
11.9.6. SWOT Analysis
11.10. Neptun Light Inc.
11.10.1. Business Overview
11.10.2. Company Snapshot
11.10.3. Company Market Share Analysis
11.10.4. Company Component Portfolio
11.10.5. Recent Developments
11.10.6. SWOT Analysis
List of Table
1. Global Smart Pole Market, By Offering, 2020-2033 (USD Billion)
2. Global Software Smart Pole Market, By Region, 2020-2033 (USD Billion)
3. Global Component Smart Pole Market, By Region, 2020-2033 (USD Billion)
4. Global Services Smart Pole Market, By Region, 2020-2033 (USD Billion)
5. Global Smart Pole Market, By Installation Type, 2020-2033 (USD Billion)
6. Global New Installation Smart Pole Market, By Region, 2020-2033 (USD Billion)
7. Global Retrofit Smart Pole Market, By Region, 2020-2033 (USD Billion)
8. Global Smart Pole Market, By Application, 2020-2033 (USD Billion)
9. Global Public Places Smart Pole Market, By Region, 2020-2033 (USD Billion)
10. Global Highways & Roadways Smart Pole Market, By Region, 2020-2033 (USD Billion)
11. Global Railways & Harbors Smart Pole Market, By Region, 2020-2033 (USD Billion)
12. North America Smart Pole Market, By Offering, 2020-2033 (USD Billion)
13. North America Smart Pole Market, By Installation Type, 2020-2033 (USD Billion)
14. North America Smart Pole Market, By Application, 2020-2033 (USD Billion)
15. U.S. Smart Pole Market, By Offering, 2020-2033 (USD Billion)
16. U.S. Smart Pole Market, By Installation Type, 2020-2033 (USD Billion)
17. U.S. Smart Pole Market, By Application, 2020-2033 (USD Billion)
18. Canada Smart Pole Market, By Offering, 2020-2033 (USD Billion)
19. Canada Smart Pole Market, By Installation Type, 2020-2033 (USD Billion)
20. Canada Smart Pole Market, By Application, 2020-2033 (USD Billion)
21. Mexico Smart Pole Market, By Offering, 2020-2033 (USD Billion)
22. Mexico Smart Pole Market, By Installation Type, 2020-2033 (USD Billion)
23. Mexico Smart Pole Market, By Application, 2020-2033 (USD Billion)
24. Europe Smart Pole Market, By Offering, 2020-2033 (USD Billion)
25. Europe Smart Pole Market, By Installation Type, 2020-2033 (USD Billion)
26. Europe Smart Pole Market, By Application, 2020-2033 (USD Billion)
27. Germany Smart Pole Market, By Offering, 2020-2033 (USD Billion)
28. Germany Smart Pole Market, By Installation Type, 2020-2033 (USD Billion)
29. Germany Smart Pole Market, By Application, 2020-2033 (USD Billion)
30. France Smart Pole Market, By Offering, 2020-2033 (USD Billion)
31. France Smart Pole Market, By Installation Type, 2020-2033 (USD Billion)
32. France Smart Pole Market, By Application, 2020-2033 (USD Billion)
33. U.K. Smart Pole Market, By Offering, 2020-2033 (USD Billion)
34. U.K. Smart Pole Market, By Installation Type, 2020-2033 (USD Billion)
35. U.K. Smart Pole Market, By Application, 2020-2033 (USD Billion)
36. Italy Smart Pole Market, By Offering, 2020-2033 (USD Billion)
37. Italy Smart Pole Market, By Installation Type, 2020-2033 (USD Billion)
38. Italy Smart Pole Market, By Application, 2020-2033 (USD Billion)
39. Spain Smart Pole Market, By Offering, 2020-2033 (USD Billion)
40. Spain Smart Pole Market, By Installation Type, 2020-2033 (USD Billion)
41. Spain Smart Pole Market, By Application, 2020-2033 (USD Billion)
42. Asia Pacific Smart Pole Market, By Offering, 2020-2033 (USD Billion)
43. Asia Pacific Smart Pole Market, By Installation Type, 2020-2033 (USD Billion)
44. Asia Pacific Smart Pole Market, By Application, 2020-2033 (USD Billion)
45. Japan Smart Pole Market, By Offering, 2020-2033 (USD Billion)
46. Japan Smart Pole Market, By Installation Type, 2020-2033 (USD Billion)
47. Japan Smart Pole Market, By Application, 2020-2033 (USD Billion)
48. China Smart Pole Market, By Offering, 2020-2033 (USD Billion)
49. China Smart Pole Market, By Installation Type, 2020-2033 (USD Billion)
50. China Smart Pole Market, By Application, 2020-2033 (USD Billion)
51. India Smart Pole Market, By Offering, 2020-2033 (USD Billion)
52. India Smart Pole Market, By Installation Type, 2020-2033 (USD Billion)
53. India Smart Pole Market, By Application, 2020-2033 (USD Billion)
54. South America Smart Pole Market, By Offering, 2020-2033 (USD Billion)
55. South America Smart Pole Market, By Installation Type, 2020-2033 (USD Billion)
56. South America Smart Pole Market, By Application, 2020-2033 (USD Billion)
57. Brazil Smart Pole Market, By Offering, 2020-2033 (USD Billion)
58. Brazil Smart Pole Market, By Installation Type, 2020-2033 (USD Billion)
59. Brazil Smart Pole Market, By Application, 2020-2033 (USD Billion)
60. The Middle East and Africa Smart Pole Market, By Offering, 2020-2033 (USD Billion)
61. The Middle East and Africa Smart Pole Market, By Installation Type, 2020-2033 (USD Billion)
62. The Middle East and Africa Smart Pole Market, By Application, 2020-2033 (USD Billion)
63. UAE Smart Pole Market, By Offering, 2020-2033 (USD Billion)
64. UAE Smart Pole Market, By Installation Type, 2020-2033 (USD Billion)
65. UAE Smart Pole Market, By Application, 2020-2033 (USD Billion)
66. South Africa Smart Pole Market, By Offering, 2020-2033 (USD Billion)
67. South Africa Smart Pole Market, By Installation Type, 2020-2033 (USD Billion)
68. South Africa Smart Pole Market, By Application, 2020-2033 (USD Billion)
List of Figures
1. Global Smart Pole Market Segmentation
2. Smart Pole Market: Research Methodology
3. Market Size Estimation Methodology: Bottom-Up Approach
4. Market Size Estimation Methodology: Top-Down Approach
5. Data Triangulation
6. Porter’s Five Forces Analysis
7. Value Chain Analysis
8. Global Smart Pole Market Attractiveness Analysis By Offering
9. Global Smart Pole Market Attractiveness Analysis By Installation Type
10. Global Smart Pole Market Attractiveness Analysis By Application
11. Global Smart Pole Market Attractiveness Analysis By Region
12. Global Smart Pole Market: Dynamics
13. Global Smart Pole Market Share by Offering (2023 & 2033)
14. Global Smart Pole Market Share by Installation Type (2023 & 2033)
15. Global Smart Pole Market Share by Application (2023 & 2033)
16. Global Smart Pole Market Share by Regions (2023 & 2033)
17. Global Smart Pole Market Share by Company (2023)
This study forecasts revenue at global, regional, and country levels from 2020 to 2033. Brainy Insights has segmented the global smart pole market based on the below-mentioned segments:
Global Smart Pole Market by Offering:
Global Smart Pole Market by Installation Type:
Global Smart Pole Market by Application:
Global Smart Pole Market by Region:
Research has its special purpose to undertake marketing efficiently. In this competitive scenario, businesses need information across all industry verticals; the information about customer wants, market demand, competition, industry trends, distribution channels etc. This information needs to be updated regularly because businesses operate in a dynamic environment. Our organization, The Brainy Insights incorporates scientific and systematic research procedures in order to get proper market insights and industry analysis for overall business success. The analysis consists of studying the market from a miniscule level wherein we implement statistical tools which helps us in examining the data with accuracy and precision.
Our research reports feature both; quantitative and qualitative aspects for any market. Qualitative information for any market research process are fundamental because they reveal the customer needs and wants, usage and consumption for any product/service related to a specific industry. This in turn aids the marketers/investors in knowing certain perceptions of the customers. Qualitative research can enlighten about the different product concepts and designs along with unique service offering that in turn, helps define marketing problems and generate opportunities. On the other hand, quantitative research engages with the data collection process through interviews, e-mail interactions, surveys and pilot studies. Quantitative aspects for the market research are useful to validate the hypotheses generated during qualitative research method, explore empirical patterns in the data with the help of statistical tools, and finally make the market estimations.
The Brainy Insights offers comprehensive research and analysis, based on a wide assortment of factual insights gained through interviews with CXOs and global experts and secondary data from reliable sources. Our analysts and industry specialist assume vital roles in building up statistical tools and analysis models, which are used to analyse the data and arrive at accurate insights with exceedingly informative research discoveries. The data provided by our organization have proven precious to a diverse range of companies, facilitating them to address issues such as determining which products/services are the most appealing, whether or not customers use the product in the manner anticipated, the purchasing intentions of the market and many others.
Our research methodology encompasses an idyllic combination of primary and secondary initiatives. Key phases involved in this process are listed below:

The phase involves the gathering and collecting of market data and its related information with the help of different sources & research procedures.

The data procurement stage involves in data gathering and collecting through various data sources.
This stage involves in extensive research. These data sources includes:
Purchased Database: Purchased databases play a crucial role in estimating the market sizes irrespective of the domain. Our purchased database includes:
Primary Research: The Brainy Insights interacts with leading companies and experts of the concerned domain to develop the analyst team’s market understanding and expertise. It improves and substantiates every single data presented in the market reports. Primary research mainly involves in telephonic interviews, E-mail interactions and face-to-face interviews with the raw material providers, manufacturers/producers, distributors, & independent consultants. The interviews that we conduct provides valuable data on market size and industry growth trends prevailing in the market. Our organization also conducts surveys with the various industry experts in order to gain overall insights of the industry/market. For instance, in healthcare industry we conduct surveys with the pharmacists, doctors, surgeons and nurses in order to gain insights and key information of a medical product/device/equipment which the customers are going to usage. Surveys are conducted in the form of questionnaire designed by our own analyst team. Surveys plays an important role in primary research because surveys helps us to identify the key target audiences of the market. Additionally, surveys helps to identify the key target audience engaged with the market. Our survey team conducts the survey by targeting the key audience, thus gaining insights from them. Based on the perspectives of the customers, this information is utilized to formulate market strategies. Moreover, market surveys helps us to understand the current competitive situation of the industry. To be precise, our survey process typically involve with the 360 analysis of the market. This analytical process begins by identifying the prospective customers for a product or service related to the market/industry to obtain data on how a product/service could fit into customers’ lives.

Secondary Research: The secondary data sources includes information published by the on-profit organizations such as World bank, WHO, company fillings, investor presentations, annual reports, national government documents, statistical databases, blogs, articles, white papers and others. From the annual report, we analyse a company’s revenue to understand the key segment and market share of that organization in a particular region. We analyse the company websites and adopt the product mapping technique which is important for deriving the segment revenue. In the product mapping method, we select and categorize the products offered by the companies catering to domain specific market, deduce the product revenue for each of the companies so as to get overall estimation of the market size. We also source data and analyses trends based on information received from supply side and demand side intermediaries in the value chain. The supply side denotes the data gathered from supplier, distributor, wholesaler and the demand side illustrates the data gathered from the end customers for respective market domain.

The supply side for a domain specific market is analysed by:
The demand side for the market is estimated through:
In-house Library: Apart from these third-party sources, we have our in-house library of qualitative and quantitative information. Our in-house database includes market data for various industry and domains. These data are updated on regular basis as per the changing market scenario. Our library includes, historic databases, internal audit reports and archives.
Sometimes there are instances where there is no metadata or raw data available for any domain specific market. For those cases, we use our expertise to forecast and estimate the market size in order to generate comprehensive data sets. Our analyst team adopt a robust research technique in order to produce the estimates:
Data Synthesis: This stage involves the analysis & mapping of all the information obtained from the previous step. It also involves in scrutinizing the data for any discrepancy observed while data gathering related to the market. The data is collected with consideration to the heterogeneity of sources. Robust scientific techniques are in place for synthesizing disparate data sets and provide the essential contextual information that can orient market strategies. The Brainy Insights has extensive experience in data synthesis where the data passes through various stages:


Market Deduction & Formulation: The final stage comprises of assigning data points at appropriate market spaces so as to deduce feasible conclusions. Analyst perspective & subject matter expert based holistic form of market sizing coupled with industry analysis also plays a crucial role in this stage.
This stage involves in finalization of the market size and numbers that we have collected from data integration step. With data interpolation, it is made sure that there is no gap in the market data. Successful trend analysis is done by our analysts using extrapolation techniques, which provide the best possible forecasts for the market.
Data Validation & Market Feedback: Validation is the most important step in the process. Validation & re-validation via an intricately designed process helps us finalize data-points to be used for final calculations.

The Brainy Insights interacts with leading companies and experts of the concerned domain to develop the analyst team’s market understanding and expertise. It improves and substantiates every single data presented in the market reports. The data validation interview and discussion panels are typically composed of the most experienced industry members. The participants include, however, are not limited to:
Moreover, we always validate our data and findings through primary respondents from all the major regions we are working on.


Free Customization
Fortune 500 Clients
Free Yearly Update On Purchase Of Multi/Corporate License
Companies Served Till Date