- +1-315-215-1633
- sales@thebrainyinsights.com

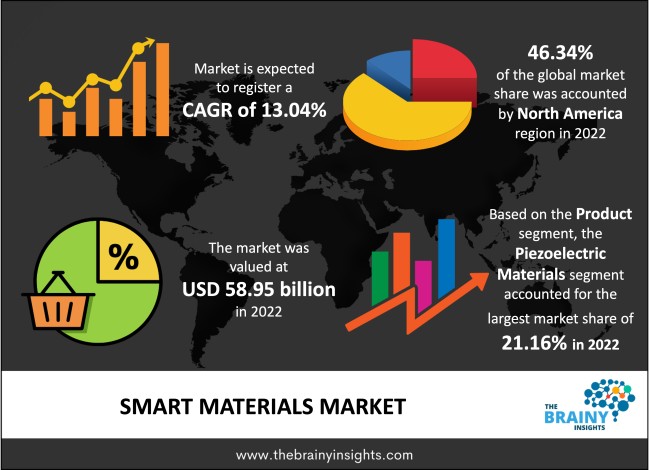
The global smart materials market was valued at USD 58.95 billion in 2022, increasing at a CAGR of 13.04% from 2023 to 2032 and anticipated to reach USD 200.82 billion by 2032. Asia Pacific is expected to grow the fastest during the forecast period. Also, the rising demand from key verticals like aerospace and consumer electronics will drive market growth during the forecast period. Moreover, the technological advancements and innovative product launches by manufacturers, along with increasing demand for smart packaging in consumer goods, are also helping to boost the market growth during the forecast period.
Smart materials are also called intelligent or responsive materials. Smart materials constitute a class of advanced materials capable of sensing and responding to various stimuli, including magnetic and electric fields, temperature, mechanical stress, pressure, nuclear radiation, hydrostatic pressure, and pH change. Smart materials are the basis of many applications, including sensors, actuators, or artificial muscles, particularly electroactive polymers (EAPs). These materials can be classified based on properties into structural, bio-compatible, electrical, intelligent biological, and dynamically tunable. Piezoelectric materials are materials that produce a voltage when stress is applied. Since this effect also applies reversely, a voltage across the sample will create stress within the sample. Shape-memory polymers are polymeric smart materials that can return from a deformed state to their original shape induced by an external stimulus (trigger) like temperature change. The most effective & widely used alloys contain CuZnAl, CuAlNi, and NiTi. PH-sensitive polymers are materials which collapse/well when the pH of the surrounding media changes.
Get an overview of this study by requesting a free sample
The ever-increasing investments in medical instruments: The increasing investments in medical tools in the healthcare sector propel market growth. Further, the growing surge in the applications across consumer electronics in various devices, including smartphones, wearables, and laptops, is helping to drive the market growth. Further, the increasing number of aircraft deliverables, the rising penetration of the healthcare industry, and the rising investment in medical R&D are also helping boost the market growth during the forecast period. Moreover, smart materials are constantly gaining attention in the healthcare sector due to their properties and benefits. These smart materials are used in biomedical instruments specifically for their biodegradability and biocompatibility. The rising consumption of smart materials such as actuators and sensors to develop smart medical tools & supply a greater understanding of piezoelectricity within the medical sector is helping to propel the market growth over the forecast period.
The high cost of smart materials: The high costs of smart materials and limited applications are restraining market growth. Further, the high manufacturing costs and increasing investment costs for research and development are anticipated to hinder market growth over the forecast period.
The rising investments in research and development (R&D) activities: The increasing investments in R&D activities to develop smart materials utilizing biopolymers like gelatin, bacterial cellulose, chitosan, polyglycolic acid, polylactic acid, and starch are the opportunity factor for market growth. Moreover, the increase in demand for enhanced smart materials & products from different industries, such as automotive, manufacturing, and construction, propels the market growth over the forecast period. Additionally, innovative ideas for product applications and the growing demand for nanotechnology in smart materials are anticipated to drive market growth during the forecast period. However, the growing innovative progressions & an increasing selection of created materials such as metal, polymers, and glass across various businesses, for instance, purchaser gadgets, auto, and medical services, are expected to drive market growth over the forecast period.
The regions analyzed for the market include Europe, South America, Asia Pacific, North America, the Middle East, and Africa. North America emerged as the largest global smart materials market, with a 46.34% market revenue share in 2022. North America dominates the smart materials market due to various factors, such as multiple attractive opportunities created due to increased defense spending. Also, favourable government policies that boost innovation and strengthen infrastructure capabilities are expected to drive market growth in this region. Moreover, the presence of many companies and well-developed healthcare infrastructure is also helping to propel the market growth in this region. However, the rise in the adoption in aerospace & defense, building & construction sectors, healthcare, and automotive are anticipated to drive the market growth over the forecast period. Asia Pacific is expected to grow the fastest during the projection period due to the increasing automobile and electronics industries and the energy sector. Moreover, the growing demand from countries such as Japan and China is helping to boost the market growth in this region over the forecast period. Additionally, the massive interest in smart actuators and engines in key businesses is also helping to boost market growth.
North America Region Smart Materials Market Share in 2022 - 46.34%
www.thebrainyinsights.com
Check the geographical analysis of this market by requesting a free sample
The application segment is divided into sensors, actuators & motors, structural materials, transducers, and others. The actuators & motors segment dominated, with a market share of around 29.21% in 2022. This growth is attributed to increased demand for smart actuators and motors in the automotive, customer goods, aerospace, and defense sectors.
The product segment is divided into phase change materials, electrostrictive materials, piezoelectric materials, electrochromic materials, shape memory materials, magnetostrictive materials, and others. In 2022, the piezoelectric materials segment dominated the market with 21.16% and a revenue of USD 12.47 billion. This growth is attributed to the rising demand for electric actuators as a tool of high power efficiency & excellent rotational speed. Further, by 2032, the shape memory materials segment will likely dominate the market due to the excessive number of applications in different end-user industries.
The end-user segment is divided into aerospace and defense, automotive, industrial, healthcare, consumer electronics, and others. In 2022, the aerospace and defense segment dominated the market with 25.17% and a revenue of USD 14.83 billion. This growth is attributed to the rising defense expenditure and the growing aircraft fleet. Further, by 2032, the consumer electronics segment will likely dominate the market due to the expansion of the consumer electronics industry.
| Attribute | Description |
|---|---|
| Market Size | Revenue (USD Billion) |
| Market size value in 2022 | USD 58.95 Billion |
| Market size value in 2032 | USD 200.82 Billion |
| CAGR (2023 to 2032) | 13.04% |
| Historical data | 2019-2021 |
| Base Year | 2022 |
| Forecast | 2023-2032 |
| Regional Segments | The key regions are North America, South America, Europe, Asia Pacific, and Middle East & Africa. |
| Segments | Key Segments are application, product, end-user, and regions |
As per The Brainy Insights, the size of the smart materials market was valued at USD 58.95 billion in 2022 to USD 200.82 billion by 2032.
The global smart materials market is growing at a CAGR of 13.04% during the forecast period 2023-2032.
North America region emerged as the largest market for smart materials.
The global smart materials market has been segmented based on application, product, end-user, and region. The actuators & motors segment led the application segment in 2022. The piezoelectric materials segment led the product segment in 2022.
1. Introduction
1.1. Objectives of the Study
1.2. Market Definition
1.3. Research Scope
1.4. Currency
1.5. Key Target Audience
2. Research Methodology and Assumptions
3. Executive Summary
4. Premium Insights
4.1. Porter’s Five Forces Analysis
4.2. Value Chain Analysis
4.3. Top Investment Pockets
4.3.1. Market Attractiveness Analysis By Application
4.3.2. Market Attractiveness Analysis By Product
4.3.3. Market Attractiveness Analysis By End-User
4.3.4. Market Attractiveness Analysis By Region
4.4. Industry Trends
5. Market Dynamics
5.1. Market Evaluation
5.2. Drivers
5.2.1. The growing use of smart actuators in various industries
5.2.2. The increased investment in the defense & aerospace sector among different countries worldwide
5.2.3. The growing ageing population
5.2.4. The ever-increasing investments in medical instruments
5.3. Restraints
5.3.1. The lack of awareness
5.3.2. The high cost of smart materials
5.4. Opportunities
5.4.1. The rising investments in research and development (R&D) activities
5.4.2. The expanding various end-user industries
6. Global Smart Materials Market Analysis and Forecast, By Application
6.1. Segment Overview
6.2. Sensors
6.3. Actuators & Motors
6.4. Structural Materials
6.5. Transducers
6.6. Others
7. Global Smart Materials Market Analysis and Forecast, By Product
7.1. Segment Overview
7.2. Phase Change Materials
7.3. Electrostrictive Materials
7.4. Piezoelectric Materials
7.5. Electrochromic Materials
7.6. Shape Memory Materials
7.7. Magnetostrictive Materials
7.8. Others
8. Global Smart Materials Market Analysis and Forecast, By End-User
8.1. Segment Overview
8.2. Aerospace and Defense
8.3. Automotive
8.4. Industrial
8.5. Healthcare
8.6. Consumer Electronics
8.7. Others
9. Global Smart Materials Market Analysis and Forecast, By Regional Analysis
9.1. Segment Overview
9.2. North America
9.2.1. U.S.
9.2.2. Canada
9.2.3. Mexico
9.3. Europe
9.3.1. Germany
9.3.2. France
9.3.3. U.K.
9.3.4. Italy
9.3.5. Spain
9.4. Asia-Pacific
9.4.1. Japan
9.4.2. China
9.4.3. India
9.5. South America
9.5.1. Brazil
9.6. Middle East and Africa
9.6.1. UAE
9.6.2. South Africa
10. Global Smart Materials Market-Competitive Landscape
10.1. Overview
10.2. Market Share of Key Players in Global Smart Materials Market
10.2.1. Global Company Market Share
10.2.2. North America Company Market Share
10.2.3. Europe Company Market Share
10.2.4. APAC Company Market Share
10.3. Competitive Situations and Trends
10.3.1. Product Launches and Developments
10.3.2. Partnerships, Collaborations, and Agreements
10.3.3. Mergers & Acquisitions
10.3.4. Expansions
11. Company Profiles
11.1. Arkema S.A
11.1.1. Business Overview
11.1.2. Company Snapshot
11.1.3. Company Market Share Analysis
11.1.4. Company Product Portfolio
11.1.5. Recent Developments
11.1.6. SWOT Analysis
11.2. APC International Ltd
11.2.1. Business Overview
11.2.2. Company Snapshot
11.2.3. Company Market Share Analysis
11.2.4. Company Product Portfolio
11.2.5. Recent Developments
11.2.6. SWOT Analysis
11.3. CTS Corporation
11.3.1. Business Overview
11.3.2. Company Snapshot
11.3.3. Company Market Share Analysis
11.3.4. Company Product Portfolio
11.3.5. Recent Developments
11.3.6. SWOT Analysis
11.4. Confluent Medical Technologies
11.4.1. Business Overview
11.4.2. Company Snapshot
11.4.3. Company Market Share Analysis
11.4.4. Company Product Portfolio
11.4.5. Recent Developments
11.4.6. SWOT Analysis
11.5. Kyocera Corporation
11.5.1. Business Overview
11.5.2. Company Snapshot
11.5.3. Company Market Share Analysis
11.5.4. Company Product Portfolio
11.5.5. Recent Developments
11.5.6. SWOT Analysis
11.6. Murata Manufacturing Co. Ltd
11.6.1. Business Overview
11.6.2. Company Snapshot
11.6.3. Company Market Share Analysis
11.6.4. Company Product Portfolio
11.6.5. Recent Developments
11.6.6. SWOT Analysis
11.7. Meggitt PLC
11.7.1. Business Overview
11.7.2. Company Snapshot
11.7.3. Company Market Share Analysis
11.7.4. Company Product Portfolio
11.7.5. Recent Developments
11.7.6. SWOT Analysis
11.8. Gentex Corporation
11.8.1. Business Overview
11.8.2. Company Snapshot
11.8.3. Company Market Share Analysis
11.8.4. Company Product Portfolio
11.8.5. Recent Developments
11.8.6. SWOT Analysis
11.9. Piezo Kinetics Inc. (The Crest Group Incorporated)
11.9.1. Business Overview
11.9.2. Company Snapshot
11.9.3. Company Market Share Analysis
11.9.4. Company Product Portfolio
11.9.5. Recent Developments
11.9.6. SWOT Analysis
11.10. Solvay S.A., Johnson Matthey
11.10.1. Business Overview
11.10.2. Company Snapshot
11.10.3. Company Market Share Analysis
11.10.4. Company Product Portfolio
11.10.5. Recent Developments
11.10.6. SWOT Analysis
11.11. SAGE Electrochromics Inc. (Saint-Gobain S.A.)
11.11.1. Business Overview
11.11.2. Company Snapshot
11.11.3. Company Market Share Analysis
11.11.4. Company Product Portfolio
11.11.5. Recent Developments
11.11.6. SWOT Analysis
List of Table
1. Global Smart Materials Market, By Application, 2019-2032 (USD Billion)
2. Global Sensors, Smart Materials Market, By Region, 2019-2032 (USD Billion)
3. Global Actuators & Motors, Smart Materials Market, By Region, 2019-2032 (USD Billion)
4. Global Structural Materials, Smart Materials Market, By Region, 2019-2032 (USD Billion)
5. Global Transducers, Smart Materials Market, By Region, 2019-2032 (USD Billion)
6. Global Others, Smart Materials Market, By Region, 2019-2032 (USD Billion)
7. Global Smart Materials Market, By Product, 2019-2032 (USD Billion)
8. Global Phase Change Materials, Smart Materials Market, By Region, 2019-2032 (USD Billion)
9. Global Electrostrictive Materials, Smart Materials Market, By Region, 2019-2032 (USD Billion)
10. Global Piezoelectric Materials, Smart Materials Market, By Region, 2019-2032 (USD Billion)
11. Global Electrochromic Materials, Smart Materials Market, By Region, 2019-2032 (USD Billion)
12. Global Shape Memory Materials, Smart Materials Market, By Region, 2019-2032 (USD Billion)
13. Global Magnetostrictive Materials, Smart Materials Market, By Region, 2019-2032 (USD Billion)
14. Global Others, Smart Materials Market, By Region, 2019-2032 (USD Billion)
15. Global Smart Materials Market, By End-User, 2019-2032 (USD Billion)
16. Global Aerospace and Defense, Smart Materials Market, By Region, 2019-2032 (USD Billion)
17. Global Automotive, Smart Materials Market, By Region, 2019-2032 (USD Billion)
18. Global Industrial, Smart Materials Market, By Region, 2019-2032 (USD Billion)
19. Global Healthcare, Smart Materials Market, By Region, 2019-2032 (USD Billion)
20. Global Consumer Electronics, Smart Materials Market, By Region, 2019-2032 (USD Billion)
21. Global Others, Smart Materials Market, By Region, 2019-2032 (USD Billion)
22. North America Smart Materials Market, By Application, 2019-2032 (USD Billion)
23. North America Smart Materials Market, By Product, 2019-2032 (USD Billion)
24. North America Smart Materials Market, By End-User, 2019-2032 (USD Billion)
25. U.S. Smart Materials Market, By Application, 2019-2032 (USD Billion)
26. U.S. Smart Materials Market, By Product, 2019-2032 (USD Billion)
27. U.S. Smart Materials Market, By End-User, 2019-2032 (USD Billion)
28. Canada Smart Materials Market, By Application, 2019-2032 (USD Billion)
29. Canada Smart Materials Market, By Product, 2019-2032 (USD Billion)
30. Canada Smart Materials Market, By End-User, 2019-2032 (USD Billion)
31. Mexico Smart Materials Market, By Application, 2019-2032 (USD Billion)
32. Mexico Smart Materials Market, By Product, 2019-2032 (USD Billion)
33. Mexico Smart Materials Market, By End-User, 2019-2032 (USD Billion)
34. Europe Smart Materials Market, By Application, 2019-2032 (USD Billion)
35. Europe Smart Materials Market, By Product, 2019-2032 (USD Billion)
36. Europe Smart Materials Market, By End-User, 2019-2032 (USD Billion)
37. Germany Smart Materials Market, By Application, 2019-2032 (USD Billion)
38. Germany Smart Materials Market, By Product, 2019-2032 (USD Billion)
39. Germany Smart Materials Market, By End-User, 2019-2032 (USD Billion)
40. France Smart Materials Market, By Application, 2019-2032 (USD Billion)
41. France Smart Materials Market, By Product, 2019-2032 (USD Billion)
42. France Smart Materials Market, By End-User, 2019-2032 (USD Billion)
43. U.K. Smart Materials Market, By Application, 2019-2032 (USD Billion)
44. U.K. Smart Materials Market, By Product, 2019-2032 (USD Billion)
45. U.K. Smart Materials Market, By End-User, 2019-2032 (USD Billion)
46. Italy Smart Materials Market, By Application, 2019-2032 (USD Billion)
47. Italy Smart Materials Market, By Product, 2019-2032 (USD Billion)
48. Italy Smart Materials Market, By End-User, 2019-2032 (USD Billion)
49. Spain Smart Materials Market, By Application, 2019-2032 (USD Billion)
50. Spain Smart Materials Market, By Product, 2019-2032 (USD Billion)
51. Spain Smart Materials Market, By End-User, 2019-2032 (USD Billion)
52. Asia Pacific Smart Materials Market, By Application, 2019-2032 (USD Billion)
53. Asia Pacific Smart Materials Market, By Product, 2019-2032 (USD Billion)
54. Asia Pacific Smart Materials Market, By End-User, 2019-2032 (USD Billion)
55. Japan Smart Materials Market, By Application, 2019-2032 (USD Billion)
56. Japan Smart Materials Market, By Product, 2019-2032 (USD Billion)
57. Japan Smart Materials Market, By End-User, 2019-2032 (USD Billion)
58. China Smart Materials Market, By Application, 2019-2032 (USD Billion)
59. China Smart Materials Market, By Product, 2019-2032 (USD Billion)
60. China Smart Materials Market, By End-User, 2019-2032 (USD Billion)
61. India Smart Materials Market, By Application, 2019-2032 (USD Billion)
62. India Smart Materials Market, By Product, 2019-2032 (USD Billion)
63. India Smart Materials Market, By End-User, 2019-2032 (USD Billion)
64. South America Smart Materials Market, By Application, 2019-2032 (USD Billion)
65. South America Smart Materials Market, By Product, 2019-2032 (USD Billion)
66. South America Smart Materials Market, By End-User, 2019-2032 (USD Billion)
67. Brazil Smart Materials Market, By Application, 2019-2032 (USD Billion)
68. Brazil Smart Materials Market, By Product, 2019-2032 (USD Billion)
69. Brazil Smart Materials Market, By End-User, 2019-2032 (USD Billion)
70. Middle East and Africa Smart Materials Market, By Application, 2019-2032 (USD Billion)
71. Middle East and Africa Smart Materials Market, By Product, 2019-2032 (USD Billion)
72. Middle East and Africa Smart Materials Market, By End-User, 2019-2032 (USD Billion)
73. UAE Smart Materials Market, By Application, 2019-2032 (USD Billion)
74. UAE Smart Materials Market, By Product, 2019-2032 (USD Billion)
75. UAE Smart Materials Market, By End-User, 2019-2032 (USD Billion)
76. South Africa Smart Materials Market, By Application, 2019-2032 (USD Billion)
77. South Africa Smart Materials Market, By Product, 2019-2032 (USD Billion)
78. South Africa Smart Materials Market, By End-User, 2019-2032 (USD Billion)
List of Figures
1. Global Smart Materials Market Segmentation
2. Global Smart Materials Market: Research Methodology
3. Market Size Estimation Methodology: Bottom-Up Approach
4. Market Size Estimation Methodology: Top- Approach
5. Data Triangulation
6. Porter’s Five Forces Analysis
7. Value Chain Analysis
8. Global Smart Materials Market Attractiveness Analysis By Application
9. Global Smart Materials Market Attractiveness Analysis By Product
10. Global Smart Materials Market Attractiveness Analysis By End-User
11. Global Smart Materials Market Attractiveness Analysis By Region
12. Global Smart Materials Market: Dynamics
13. Global Smart Materials Market Share By Application (2023 & 2032)
14. Global Smart Materials Market Share By Product (2023 & 2032)
15. Global Smart Materials Market Share By End-User (2023 & 2032)
16. Global Smart Materials Market Share By Regions (2023 & 2032)
17. Global Smart Materials Market Share By Company (2022)
This study forecasts revenue at global, regional, and country levels from 2019 to 2032. The Brainy Insights has segmented the global smart materials based on below mentioned segments:
Global Smart Materials Market by Application:
Global Smart Materials Market by Product:
Global Smart Materials Market by Distribution Channel:
Global Smart Materials by Region:
Research has its special purpose to undertake marketing efficiently. In this competitive scenario, businesses need information across all industry verticals; the information about customer wants, market demand, competition, industry trends, distribution channels etc. This information needs to be updated regularly because businesses operate in a dynamic environment. Our organization, The Brainy Insights incorporates scientific and systematic research procedures in order to get proper market insights and industry analysis for overall business success. The analysis consists of studying the market from a miniscule level wherein we implement statistical tools which helps us in examining the data with accuracy and precision.
Our research reports feature both; quantitative and qualitative aspects for any market. Qualitative information for any market research process are fundamental because they reveal the customer needs and wants, usage and consumption for any product/service related to a specific industry. This in turn aids the marketers/investors in knowing certain perceptions of the customers. Qualitative research can enlighten about the different product concepts and designs along with unique service offering that in turn, helps define marketing problems and generate opportunities. On the other hand, quantitative research engages with the data collection process through interviews, e-mail interactions, surveys and pilot studies. Quantitative aspects for the market research are useful to validate the hypotheses generated during qualitative research method, explore empirical patterns in the data with the help of statistical tools, and finally make the market estimations.
The Brainy Insights offers comprehensive research and analysis, based on a wide assortment of factual insights gained through interviews with CXOs and global experts and secondary data from reliable sources. Our analysts and industry specialist assume vital roles in building up statistical tools and analysis models, which are used to analyse the data and arrive at accurate insights with exceedingly informative research discoveries. The data provided by our organization have proven precious to a diverse range of companies, facilitating them to address issues such as determining which products/services are the most appealing, whether or not customers use the product in the manner anticipated, the purchasing intentions of the market and many others.
Our research methodology encompasses an idyllic combination of primary and secondary initiatives. Key phases involved in this process are listed below:

The phase involves the gathering and collecting of market data and its related information with the help of different sources & research procedures.

The data procurement stage involves in data gathering and collecting through various data sources.
This stage involves in extensive research. These data sources includes:
Purchased Database: Purchased databases play a crucial role in estimating the market sizes irrespective of the domain. Our purchased database includes:
Primary Research: The Brainy Insights interacts with leading companies and experts of the concerned domain to develop the analyst team’s market understanding and expertise. It improves and substantiates every single data presented in the market reports. Primary research mainly involves in telephonic interviews, E-mail interactions and face-to-face interviews with the raw material providers, manufacturers/producers, distributors, & independent consultants. The interviews that we conduct provides valuable data on market size and industry growth trends prevailing in the market. Our organization also conducts surveys with the various industry experts in order to gain overall insights of the industry/market. For instance, in healthcare industry we conduct surveys with the pharmacists, doctors, surgeons and nurses in order to gain insights and key information of a medical product/device/equipment which the customers are going to usage. Surveys are conducted in the form of questionnaire designed by our own analyst team. Surveys plays an important role in primary research because surveys helps us to identify the key target audiences of the market. Additionally, surveys helps to identify the key target audience engaged with the market. Our survey team conducts the survey by targeting the key audience, thus gaining insights from them. Based on the perspectives of the customers, this information is utilized to formulate market strategies. Moreover, market surveys helps us to understand the current competitive situation of the industry. To be precise, our survey process typically involve with the 360 analysis of the market. This analytical process begins by identifying the prospective customers for a product or service related to the market/industry to obtain data on how a product/service could fit into customers’ lives.

Secondary Research: The secondary data sources includes information published by the on-profit organizations such as World bank, WHO, company fillings, investor presentations, annual reports, national government documents, statistical databases, blogs, articles, white papers and others. From the annual report, we analyse a company’s revenue to understand the key segment and market share of that organization in a particular region. We analyse the company websites and adopt the product mapping technique which is important for deriving the segment revenue. In the product mapping method, we select and categorize the products offered by the companies catering to domain specific market, deduce the product revenue for each of the companies so as to get overall estimation of the market size. We also source data and analyses trends based on information received from supply side and demand side intermediaries in the value chain. The supply side denotes the data gathered from supplier, distributor, wholesaler and the demand side illustrates the data gathered from the end customers for respective market domain.

The supply side for a domain specific market is analysed by:
The demand side for the market is estimated through:
In-house Library: Apart from these third-party sources, we have our in-house library of qualitative and quantitative information. Our in-house database includes market data for various industry and domains. These data are updated on regular basis as per the changing market scenario. Our library includes, historic databases, internal audit reports and archives.
Sometimes there are instances where there is no metadata or raw data available for any domain specific market. For those cases, we use our expertise to forecast and estimate the market size in order to generate comprehensive data sets. Our analyst team adopt a robust research technique in order to produce the estimates:
Data Synthesis: This stage involves the analysis & mapping of all the information obtained from the previous step. It also involves in scrutinizing the data for any discrepancy observed while data gathering related to the market. The data is collected with consideration to the heterogeneity of sources. Robust scientific techniques are in place for synthesizing disparate data sets and provide the essential contextual information that can orient market strategies. The Brainy Insights has extensive experience in data synthesis where the data passes through various stages:


Market Deduction & Formulation: The final stage comprises of assigning data points at appropriate market spaces so as to deduce feasible conclusions. Analyst perspective & subject matter expert based holistic form of market sizing coupled with industry analysis also plays a crucial role in this stage.
This stage involves in finalization of the market size and numbers that we have collected from data integration step. With data interpolation, it is made sure that there is no gap in the market data. Successful trend analysis is done by our analysts using extrapolation techniques, which provide the best possible forecasts for the market.
Data Validation & Market Feedback: Validation is the most important step in the process. Validation & re-validation via an intricately designed process helps us finalize data-points to be used for final calculations.

The Brainy Insights interacts with leading companies and experts of the concerned domain to develop the analyst team’s market understanding and expertise. It improves and substantiates every single data presented in the market reports. The data validation interview and discussion panels are typically composed of the most experienced industry members. The participants include, however, are not limited to:
Moreover, we always validate our data and findings through primary respondents from all the major regions we are working on.


Free Customization
Fortune 500 Clients
Free Yearly Update On Purchase Of Multi/Corporate License
Companies Served Till Date