- +1-315-215-1633
- sales@thebrainyinsights.com

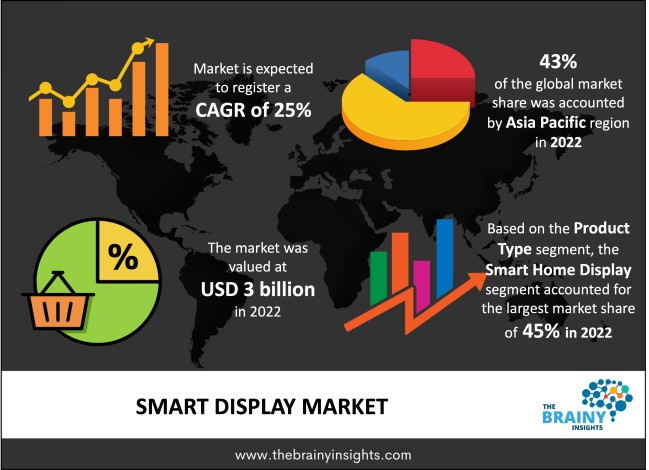
The global smart display market was valued at USD 3 billion in 2022 and grew at a CAGR of 25% from 2023 to 2032. The market is expected to reach USD 27.93 billion by 2032. Increasing demand for smart homes will drive the growth of the global smart display market.
A smart display is an electronic device that enables the user to access and control various appliances and functions around the house. It is just like a smart display which operates on voice commands and comes with an intelligent virtual assistant like Siri or Alexa, except it has a touchscreen which allows the user to interact with images, pictures and videos. The visual access expands functionality and offers greater control and flexibility. it can make calls and control heating and lighting through voice commands or manual inputs on its screen. It offers security, safety and remote monitoring. They are available in different sizes from different brands with different features like the kind of functions it offers network proximity works, and display qualities, among other things. A smart display is the centre of the brain of smartphones, with access to controls of all other home appliances. It can control the lightbulbs, HVAC systems, entertainment, speakers, cameras etc., around the house through voice commands from authorized users. They facilitate efficient energy usage. They are easy to use, integrated into smart homes, and are convenient. smart displays save time.
Get an overview of this study by requesting a free sample
The growth of the smart home real estate industry - real estate developers are striving towards automation and digitization of homes by offering the best features to their customers. They are utilizing smart home technologies to provide the rising young population with state-of-art homes. Smart displays are the frontrunners in smart home development. They are primarily used for the safety and security of residential areas and individual homes. They are being deployed for access controls to improve residential safety. Smart home displays are being offered in the new homes with controls for lighting, heating, ventilation, cameras, doors, entertainment units etc. The enhanced internet penetration and data connectivity are positively influencing the market. Given the growing automation of economies, the retrofitting of old homes will also drive the market's growth.
The expensive nature of smart displays – smart displays have exponential potential to grow in the coming years. However, the low per capita income in most countries restricts the market's growth to the affluent class of the world, given its expensive nature. Furthermore, the structural inefficiencies in the form of low data connectivity, low tech literacy, lax privacy laws and inadequate distribution network for products will hamper the market's growth.
The rising commercial use of smart displays – the growing automation and digitization of industries will drive the adoption of smart displays in the commercial sectors in the forecast period. The food and entertainment industries use smart displays to improve customer service by enabling customers to curate their menus and choose their payment method without interacting with employees. Similarly, metro stations and airports enable faster, more convenient, hassle-free operations with smart displays during check-ins. Smart displays are being used in research in the healthcare, automotive, aerospace and defence industries. Therefore, the commercial and industrial use of smart displays will offer lucrative opportunities for the market players during the forecast period.
The regions analyzed for the market include North America, Europe, South America, Asia Pacific, the Middle East, and Africa. Asia Pacific emerged as the most significant global smart display market, with a 42% market revenue share in 2022.
The increasing disposable income of the region's rising population will provide a lucrative consumer market for smart displays. Countries like Japan, China, South Korea and Japan drive innovation in the smart display industry, catering to the domestic Asia-Pacific market. The chip-making industry of Taiwan is a positive contributing factor to the regional smart display market's growth and development. The smart city initiatives will also bode well for the market.
Asia Pacific Region Smart Display Market Share in 2022 - 43%
www.thebrainyinsights.com
Check the geographical analysis of this market by requesting a free sample
The product type segment is divided into smart display mirrors, smart home displays, and smart signage. The smart home display segment dominated the market, with a market share of around 45% in 2022. Smart home displays are a tablet version of smart displays. They have an intelligent voice assistant and enable the user to control all the devices connected to it through voice commands from a single place. They improve energy efficiency around the house and enhance security and control. They save time as well. They enable the user to locate entertainment, play music, and control lighting, heating and ventilation in the house through voice commands or touchscreen features. They also have access to door controls, security cameras and other security measures around the house. The growing adoption of smart homes globally will drive the segment’s growth.
The end-user segment is divided into residential, retail, healthcare, automotive, sports, government, entertainment and others. The retail segment dominated, with a market share of around 32% in 2022. Shopping malls are vast in size, and it is difficult for consumers to navigate; therefore, smart displays at regular intervals offer the consumer a step-by-step guide to reach the shop they intend to shop from. Furthermore, smart displays are also used outside shops running ad campaigns and interacting with marketing strategies to attract consumers. They are increasingly being deployed in supermarkets/hypermarkets to enable automated faster checkouts.
The display technology segment is divided into LCD, OLED, LED, and others. The OLED segment dominated the market, with a market share of around 55% in 2022. Organic light-emitting diode display is referred to in the segment on displays. OLED displays use less energy than other types of displays. They offer a wider viewing angle, vibrant colour, and an intense display. OLED displays are small, flexible, and offer great motion picture quality for various industrial applications. Additionally, the government programme promoting the adoption of low-power technologies bodes well for expanding the OLED display market over the forecast period.
| Attribute | Description |
|---|---|
| Market Size | Revenue (USD Billion) |
| Market size value in 2022 | USD 3 Billion |
| Market size value in 2032 | USD 27.93 Billion |
| CAGR (2023 to 2032) | 25% |
| Historical data | 2019-2021 |
| Base Year | 2022 |
| Forecast | 2023-2032 |
| Region | The regions analyzed for the market are Asia Pacific, Europe, South America, North America, and Middle East & Africa. Furthermore, the regions are further analyzed at the country level. |
| Segments | Product Type, End User, and Display Technology |
As per The Brainy Insights, the size of the global smart display market was valued at USD 3 billion in 2022 to USD 27.93 billion by 2032.
Global smart display market is growing at a CAGR of 25% during the forecast period 2023-2032.
The market's growth will be influenced by the growth of smart home real estate industry.
The expensive nature of smart displays could hamper the market growth.
1. Introduction
1.1. Objectives of the Study
1.2. Market Definition
1.3. Research Scope
1.4. Currency
1.5. Key Target Audience
2. Research Methodology and Assumptions
3. Executive Summary
4. Premium Insights
4.1. Porter’s Five Forces Analysis
4.2. Value Chain Analysis
4.3. Top Investment Pockets
4.3.1. Market Attractiveness Analysis by Product Type
4.3.2. Market Attractiveness Analysis by End User
4.3.3. Market Attractiveness Analysis by Display Technology
4.3.4. Market Attractiveness Analysis by Region
4.4. Industry Trends
5. Market Dynamics
5.1. Market Evaluation
5.2. Drivers
5.2.1. The growth of the smart home real estate industry
5.3. Restraints
5.3.1. The expensive nature of smart displays
5.4. Opportunities
5.4.1. The rising commercial use of smart displays
5.5. Challenges
5.5.1. The increasing safety and privacy concerns
6. Global Smart Display Market Analysis and Forecast, By Product Type
6.1. Segment Overview
6.2. Smart Display Mirror
6.3. Smart Home Display
6.4. Smart Signage
7. Global Smart Display Market Analysis and Forecast, By End User
7.1. Segment Overview
7.2. Residential
7.3. Retail
7.4. Healthcare
7.5. Automotive
7.6. Sports
7.7. Government
7.8. Entertainment
7.9. Others
8. Global Smart Display Market Analysis and Forecast, By Display Technology
8.1. Segment Overview
8.2. LCD
8.3. OLED
8.4. LED
8.5. Others
9. Global Smart Display Market Analysis and Forecast, By Regional Analysis
9.1. Segment Overview
9.2. North America
9.2.1. U.S.
9.2.2. Canada
9.2.3. Mexico
9.3. Europe
9.3.1. Germany
9.3.2. France
9.3.3. U.K.
9.3.4. Italy
9.3.5. Spain
9.4. Asia-Pacific
9.4.1. Japan
9.4.2. China
9.4.3. India
9.5. South America
9.5.1. Brazil
9.6. Middle East and Africa
9.6.1. UAE
9.6.2. South Africa
10. Global Smart Display Market-Competitive Landscape
10.1. Overview
10.2. Market Share of Key Players in the Smart Display Market
10.2.1. Global Company Market Share
10.2.2. North America Company Market Share
10.2.3. Europe Company Market Share
10.2.4. APAC Company Market Share
10.3. Competitive Situations and Trends
10.3.1. Product Launches and Developments
10.3.2. Partnerships, Collaborations, and Agreements
10.3.3. Mergers & Acquisitions
10.3.4. Expansions
11. Company Profiles
11.1. Alphabet Inc.
11.1.1. Business Overview
11.1.2. Company Snapshot
11.1.3. Company Market Share Analysis
11.1.4. Company Product Portfolio
11.1.5. Recent Developments
11.1.6. SWOT Analysis
11.2. Alpine Electronics, Inc.
11.2.1. Business Overview
11.2.2. Company Snapshot
11.2.3. Company Market Share Analysis
11.2.4. Company Product Portfolio
11.2.5. Recent Developments
11.2.6. SWOT Analysis
11.3. Amazon.com Inc.
11.3.1. Business Overview
11.3.2. Company Snapshot
11.3.3. Company Market Share Analysis
11.3.4. Company Product Portfolio
11.3.5. Recent Developments
11.3.6. SWOT Analysis
11.4. Japan Display Inc.
11.4.1. Business Overview
11.4.2. Company Snapshot
11.4.3. Company Market Share Analysis
11.4.4. Company Product Portfolio
11.4.5. Recent Developments
11.4.6. SWOT Analysis
11.5. Lenovo Group Ltd.
11.5.1. Business Overview
11.5.2. Company Snapshot
11.5.3. Company Market Share Analysis
11.5.4. Company Product Portfolio
11.5.5. Recent Developments
11.5.6. SWOT Analysis
11.6. LG Electronics Inc.
11.6.1. Business Overview
11.6.2. Company Snapshot
11.6.3. Company Market Share Analysis
11.6.4. Company Product Portfolio
11.6.5. Recent Developments
11.6.6. SWOT Analysis
11.7. Magna International Inc.
11.7.1. Business Overview
11.7.2. Company Snapshot
11.7.3. Company Market Share Analysis
11.7.4. Company Product Portfolio
11.7.5. Recent Developments
11.7.6. SWOT Analysis
11.8. Panasonic Corporation
11.8.1. Business Overview
11.8.2. Company Snapshot
11.8.3. Company Market Share Analysis
11.8.4. Company Product Portfolio
11.8.5. Recent Developments
11.8.6. SWOT Analysis
11.9. Samsung
11.9.1. Business Overview
11.9.2. Company Snapshot
11.9.3. Company Market Share Analysis
11.9.4. Company Product Portfolio
11.9.5. Recent Developments
11.9.6. SWOT Analysis
11.10. Sony Corporation
11.10.1. Business Overview
11.10.2. Company Snapshot
11.10.3. Company Market Share Analysis
11.10.4. Company Product Portfolio
11.10.5. Recent Developments
11.10.6. SWOT Analysis
List of Table
1. Global Smart Display Market, By Product Type, 2019-2032 (USD Billion)
2. Global Smart Display Mirror Smart Display Market, By Region, 2019-2032 (USD Billion)
3. Global Smart Home Display Smart Display Market, By Region, 2019-2032 (USD Billion)
4. Global Smart Signage Smart Display Market, By Region, 2019-2032 (USD Billion)
5. Global Smart Display Market, By End User, 2019-2032 (USD Billion)
6. Global Residential Smart Display Market, By Region, 2019-2032 (USD Billion)
7. Global Retail Smart Display Market, By Region, 2019-2032 (USD Billion)
8. Global Healthcare Smart Display Market, By Region, 2019-2032 (USD Billion)
9. Global Automotive Smart Display Market, By Region, 2019-2032 (USD Billion)
10. Global Sports Smart Display Market, By Region, 2019-2032 (USD Billion)
11. Global Government Smart Display Market, By Region, 2019-2032 (USD Billion)
12. Global Entertainment Smart Display Market, By Region, 2019-2032 (USD Billion)
13. Global Others Smart Display Market, By Region, 2019-2032 (USD Billion)
14. Global Smart Display Market, By Display Technology, 2019-2032 (USD Billion)
15. Global LCD Smart Display Market, By Region, 2019-2032 (USD Billion)
16. Global OLED Smart Display Market, By Region, 2019-2032 (USD Billion)
17. Global LED Smart Display Market, By Region, 2019-2032 (USD Billion)
18. Global Others Smart Display Market, By Region, 2019-2032 (USD Billion)
19. Global Smart Display Market, By Region, 2019-2032 (USD Billion)
20. North America Smart Display Market, By Product Type, 2019-2032 (USD Billion)
21. North America Smart Display Market, By End User, 2019-2032 (USD Billion)
22. North America Smart Display Market, By Display Technology, 2019-2032 (USD Billion)
23. U.S. Smart Display Market, By Product Type, 2019-2032 (USD Billion)
24. U.S. Smart Display Market, By End User, 2019-2032 (USD Billion)
25. U.S. Smart Display Market, By Display Technology, 2019-2032 (USD Billion)
26. Canada Smart Display Market, By Product Type, 2019-2032 (USD Billion)
27. Canada Smart Display Market, By End User, 2019-2032 (USD Billion)
28. Canada Smart Display Market, By Display Technology, 2019-2032 (USD Billion)
29. Mexico Smart Display Market, By Product Type, 2019-2032 (USD Billion)
30. Mexico Smart Display Market, By End User, 2019-2032 (USD Billion)
31. Mexico Smart Display Market, By Display Technology, 2019-2032 (USD Billion)
32. Europe Smart Display Market, By Product Type, 2019-2032 (USD Billion)
33. Europe Smart Display Market, By End User, 2019-2032 (USD Billion)
34. Europe Smart Display Market, By Display Technology, 2019-2032 (USD Billion)
35. Germany Smart Display Market, By Product Type, 2019-2032 (USD Billion)
36. Germany Smart Display Market, By End User, 2019-2032 (USD Billion)
37. Germany Smart Display Market, By Display Technology, 2019-2032 (USD Billion)
38. France Smart Display Market, By Product Type, 2019-2032 (USD Billion)
39. France Smart Display Market, By End User, 2019-2032 (USD Billion)
40. France Smart Display Market, By Display Technology, 2019-2032 (USD Billion)
41. U.K. Smart Display Market, By Product Type, 2019-2032 (USD Billion)
42. U.K. Smart Display Market, By End User, 2019-2032 (USD Billion)
43. U.K. Smart Display Market, By Display Technology, 2019-2032 (USD Billion)
44. Italy Smart Display Market, By Product Type, 2019-2032 (USD Billion)
45. Italy Smart Display Market, By End User, 2019-2032 (USD Billion)
46. Italy Smart Display Market, By Display Technology, 2019-2032 (USD Billion)
47. Spain Smart Display Market, By Product Type, 2019-2032 (USD Billion)
48. Spain Smart Display Market, By End User, 2019-2032 (USD Billion)
49. Spain Smart Display Market, By Display Technology, 2019-2032 (USD Billion)
50. Asia Pacific Smart Display Market, By Product Type, 2019-2032 (USD Billion)
51. Asia Pacific Smart Display Market, By End User, 2019-2032 (USD Billion)
52. Asia Pacific Smart Display Market, By Display Technology, 2019-2032 (USD Billion)
53. Japan Smart Display Market, By Product Type, 2019-2032 (USD Billion)
54. Japan Smart Display Market, By End User, 2019-2032 (USD Billion)
55. Japan Smart Display Market, By Display Technology, 2019-2032 (USD Billion)
56. China Smart Display Market, By Product Type, 2019-2032 (USD Billion)
57. China Smart Display Market, By End User, 2019-2032 (USD Billion)
58. China Smart Display Market, By Display Technology, 2019-2032 (USD Billion)
59. India Smart Display Market, By Product Type, 2019-2032 (USD Billion)
60. India Smart Display Market, By End User, 2019-2032 (USD Billion)
61. India Smart Display Market, By Display Technology, 2019-2032 (USD Billion)
62. South America Smart Display Market, By Product Type, 2019-2032 (USD Billion)
63. South America Smart Display Market, By End User, 2019-2032 (USD Billion)
64. South America Smart Display Market, By Display Technology, 2019-2032 (USD Billion)
65. Brazil Smart Display Market, By Product Type, 2019-2032 (USD Billion)
66. Brazil Smart Display Market, By End User, 2019-2032 (USD Billion)
67. Brazil Smart Display Market, By Display Technology, 2019-2032 (USD Billion)
68. Middle East and Africa Smart Display Market, By Product Type, 2019-2032 (USD Billion)
69. Middle East and Africa Smart Display Market, By End User, 2019-2032 (USD Billion)
70. Middle East and Africa Smart Display Market, By Display Technology, 2019-2032 (USD Billion)
71. UAE Smart Display Market, By Product Type, 2019-2032 (USD Billion)
72. UAE Smart Display Market, By End User, 2019-2032 (USD Billion)
73. UAE Smart Display Market, By Display Technology, 2019-2032 (USD Billion)
74. South Africa Smart Display Market, By Product Type, 2019-2032 (USD Billion)
75. South Africa Smart Display Market, By End User, 2019-2032 (USD Billion)
76. South Africa Smart Display Market, By Display Technology, 2019-2032 (USD Billion)
List of Figures
1. Global Smart Display Market Segmentation
2. Smart Display Market: Research Methodology
3. Market Size Estimation Methodology: Bottom-Up Approach
4. Market Size Estimation Methodology: Top-Down Approach
5. Data Triangulation
6. Porter’s Five Forces Analysis
7. Value Chain Analysis
8. Global Smart Display Market Attractiveness Analysis by Product Type
9. Global Smart Display Market Attractiveness Analysis by End User
10. Global Smart Display Market Attractiveness Analysis by Display Technology
11. Global Smart Display Market Attractiveness Analysis by Region
12. Global Smart Display Market: Dynamics
13. Global Smart Display Market Share by Product Type (2022 & 2032)
14. Global Smart Display Market Share by End User (2022 & 2032)
15. Global Smart Display Market Share by Display Technology (2022 & 2032)
16. Global Smart Display Market Share by Regions (2022 & 2032)
17. Global Smart Display Market Share by Company (2022)
This study forecasts revenue at global, regional, and country levels from 2019 to 2032. The Brainy Insights has segmented the global smart display market based on below mentioned segments:
Global Smart Display Market by Product Type:
Global Smart Display Market by End User:
Global Smart Display Market by Display Technology:
Global Smart Display Market by Region:
Research has its special purpose to undertake marketing efficiently. In this competitive scenario, businesses need information across all industry verticals; the information about customer wants, market demand, competition, industry trends, distribution channels etc. This information needs to be updated regularly because businesses operate in a dynamic environment. Our organization, The Brainy Insights incorporates scientific and systematic research procedures in order to get proper market insights and industry analysis for overall business success. The analysis consists of studying the market from a miniscule level wherein we implement statistical tools which helps us in examining the data with accuracy and precision.
Our research reports feature both; quantitative and qualitative aspects for any market. Qualitative information for any market research process are fundamental because they reveal the customer needs and wants, usage and consumption for any product/service related to a specific industry. This in turn aids the marketers/investors in knowing certain perceptions of the customers. Qualitative research can enlighten about the different product concepts and designs along with unique service offering that in turn, helps define marketing problems and generate opportunities. On the other hand, quantitative research engages with the data collection process through interviews, e-mail interactions, surveys and pilot studies. Quantitative aspects for the market research are useful to validate the hypotheses generated during qualitative research method, explore empirical patterns in the data with the help of statistical tools, and finally make the market estimations.
The Brainy Insights offers comprehensive research and analysis, based on a wide assortment of factual insights gained through interviews with CXOs and global experts and secondary data from reliable sources. Our analysts and industry specialist assume vital roles in building up statistical tools and analysis models, which are used to analyse the data and arrive at accurate insights with exceedingly informative research discoveries. The data provided by our organization have proven precious to a diverse range of companies, facilitating them to address issues such as determining which products/services are the most appealing, whether or not customers use the product in the manner anticipated, the purchasing intentions of the market and many others.
Our research methodology encompasses an idyllic combination of primary and secondary initiatives. Key phases involved in this process are listed below:

The phase involves the gathering and collecting of market data and its related information with the help of different sources & research procedures.

The data procurement stage involves in data gathering and collecting through various data sources.
This stage involves in extensive research. These data sources includes:
Purchased Database: Purchased databases play a crucial role in estimating the market sizes irrespective of the domain. Our purchased database includes:
Primary Research: The Brainy Insights interacts with leading companies and experts of the concerned domain to develop the analyst team’s market understanding and expertise. It improves and substantiates every single data presented in the market reports. Primary research mainly involves in telephonic interviews, E-mail interactions and face-to-face interviews with the raw material providers, manufacturers/producers, distributors, & independent consultants. The interviews that we conduct provides valuable data on market size and industry growth trends prevailing in the market. Our organization also conducts surveys with the various industry experts in order to gain overall insights of the industry/market. For instance, in healthcare industry we conduct surveys with the pharmacists, doctors, surgeons and nurses in order to gain insights and key information of a medical product/device/equipment which the customers are going to usage. Surveys are conducted in the form of questionnaire designed by our own analyst team. Surveys plays an important role in primary research because surveys helps us to identify the key target audiences of the market. Additionally, surveys helps to identify the key target audience engaged with the market. Our survey team conducts the survey by targeting the key audience, thus gaining insights from them. Based on the perspectives of the customers, this information is utilized to formulate market strategies. Moreover, market surveys helps us to understand the current competitive situation of the industry. To be precise, our survey process typically involve with the 360 analysis of the market. This analytical process begins by identifying the prospective customers for a product or service related to the market/industry to obtain data on how a product/service could fit into customers’ lives.

Secondary Research: The secondary data sources includes information published by the on-profit organizations such as World bank, WHO, company fillings, investor presentations, annual reports, national government documents, statistical databases, blogs, articles, white papers and others. From the annual report, we analyse a company’s revenue to understand the key segment and market share of that organization in a particular region. We analyse the company websites and adopt the product mapping technique which is important for deriving the segment revenue. In the product mapping method, we select and categorize the products offered by the companies catering to domain specific market, deduce the product revenue for each of the companies so as to get overall estimation of the market size. We also source data and analyses trends based on information received from supply side and demand side intermediaries in the value chain. The supply side denotes the data gathered from supplier, distributor, wholesaler and the demand side illustrates the data gathered from the end customers for respective market domain.

The supply side for a domain specific market is analysed by:
The demand side for the market is estimated through:
In-house Library: Apart from these third-party sources, we have our in-house library of qualitative and quantitative information. Our in-house database includes market data for various industry and domains. These data are updated on regular basis as per the changing market scenario. Our library includes, historic databases, internal audit reports and archives.
Sometimes there are instances where there is no metadata or raw data available for any domain specific market. For those cases, we use our expertise to forecast and estimate the market size in order to generate comprehensive data sets. Our analyst team adopt a robust research technique in order to produce the estimates:
Data Synthesis: This stage involves the analysis & mapping of all the information obtained from the previous step. It also involves in scrutinizing the data for any discrepancy observed while data gathering related to the market. The data is collected with consideration to the heterogeneity of sources. Robust scientific techniques are in place for synthesizing disparate data sets and provide the essential contextual information that can orient market strategies. The Brainy Insights has extensive experience in data synthesis where the data passes through various stages:


Market Deduction & Formulation: The final stage comprises of assigning data points at appropriate market spaces so as to deduce feasible conclusions. Analyst perspective & subject matter expert based holistic form of market sizing coupled with industry analysis also plays a crucial role in this stage.
This stage involves in finalization of the market size and numbers that we have collected from data integration step. With data interpolation, it is made sure that there is no gap in the market data. Successful trend analysis is done by our analysts using extrapolation techniques, which provide the best possible forecasts for the market.
Data Validation & Market Feedback: Validation is the most important step in the process. Validation & re-validation via an intricately designed process helps us finalize data-points to be used for final calculations.

The Brainy Insights interacts with leading companies and experts of the concerned domain to develop the analyst team’s market understanding and expertise. It improves and substantiates every single data presented in the market reports. The data validation interview and discussion panels are typically composed of the most experienced industry members. The participants include, however, are not limited to:
Moreover, we always validate our data and findings through primary respondents from all the major regions we are working on.


Free Customization
Fortune 500 Clients
Free Yearly Update On Purchase Of Multi/Corporate License
Companies Served Till Date