- +1-315-215-1633
- sales@thebrainyinsights.com

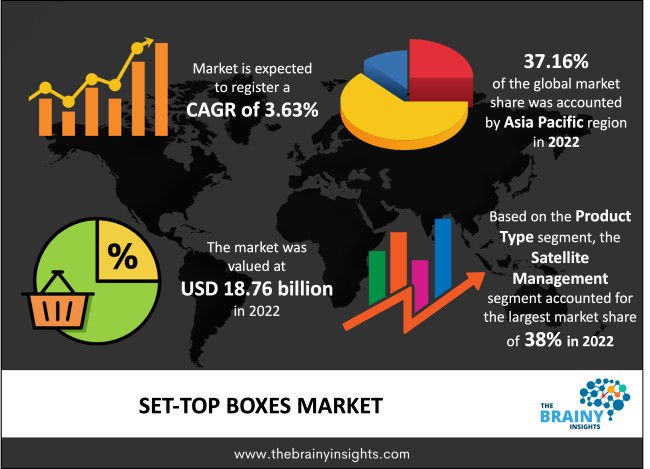
The global set-top boxes market is expected to reach USD 25.87 billion by 2030, at a CAGR of 3.63% from 2022 to 2030. Set-top boxes market growth would be driven by rising demand for television entertainment attributed to the rising disposable income of the population. The integration of advanced features like voice assistant, fire stick, internet connection, electronic program guide, parental controls, and live TV recording, among many others, will contribute to the growing demand for set-top boxes during the forecast period. The increasing adoption of new features, business strategies, sales, and marketing campaigns by market players to expand their market share in the highly segmented set-top boxes market will also drive the development of the global set-top boxes market.
The importance of television in the modern world has increased due to globalization. Television is the window for an individual to stay apprised of all the local, national and global happenings. It is also a means of education, making the learning experience a visual treat for everyone. Entertainment plays a vital role in human life, and it helps some reduce stress, elevate their mood, and bring happiness and people together. A set-top box is a piece of information conveying device. It is an electronic device designed to receive electronic signals from the broadcaster, decode and transmit them to the television for the final visual output. The satellite transmits signals which are received by the antenna or dish. The satellite then catches the signals transmitted and decodes them into visual images on the television. HDTV tuners, cable HDTV receivers, and all-in-one receivers are examples of set-top boxes widely used in the market. A set-top box performs the functions of a cable converter, digital television adapter, IPTV receiver, closed captioning box, and UHF converter, among other functions. With the advent of better electronic device technologies, set-top boxes in the contemporary world come with an electronic programming guide, timer, live TV recording, and universal remote control-like features. To improve the consumer experience, market players are devising innovative product packages and services. Set-top boxes are sold with the guaranteed viewership of all channels. Greater flexibility to customisation according to the needs of the consumer has allowed market players to expand their sales. Customisation lets consumers choose the channels they want to include in their package and the resolution they want. Smart set-top boxes allow access to OTT platforms on the TV screen, increasing its demand at par with the growing consumption of OTT content. The increasing disposable income of the consumers has led to an equal increase in the desire and willingness of the customers to pay for quality, varied content to fulfil their needs.
Get an overview of this study by requesting a free sample
The rising disposable income of the population has increased the demand for consumer durables. The growing innovation to increase sales has also gained traction in the market. Affordable prices, all-channel packages, customisation, and pay-per-view-like features complement the rising demand for set-top boxes. Quality content worldwide has created a massive consumption demand in the global market, barring borders. Set-top boxes enable access to global content of good quality at affordable prices, contributing to the enriching globalised consumer world and thereby driving the growth of the global set-top boxes market. To summarise, the global set-top boxes market would be driven by the rising population, increasing disposable income, customisable services, and creating entertaining content.
The rising content availability of every genre, taste, language, and preference on OTT platforms accessible via smart connected devices such as laptops and phones will restrict the market's growth. Smart-connected devices like laptops and mobiles are easy to carry. They enable the consumers to watch content according to places and timings suitable to them. The affordability of smart connected devices also contributes to their massive popularity in the market. Set-top boxes are a complementary product for television. With the growing content consumption on smartphones and laptops, the demand for television is witnessing a drop, contributing to an equally negative growth of the set-top boxes market.
The development of advanced set-top boxes has more features than the traditional set-top boxes. They are integrated with live TV recording, parental control, universal remote controls, and an electronic programming guide. These features allow customers seamless navigation to browse the hundreds of channels available by purchasing the set-top boxes. The services offering customisation of channels according to the subjective taste of the consumer will also aid in market expansion. Market players deliver affordable channel packages and viewer subscriptions, providing positive growth prospects in the forecast period.
The development of smart TVs, which do not require a set-top to assist them in delivering their primary functions of displaying content. The growing trend of associating the ownership of smart TVs with social status in society has garnered popularity in the market. Therefore, more consumers opt for smart TVs, which provide various programs, movies, and music. They even enable internet access and allow customers to browse the internet on the big screen. Smart TVs support gaming consoles, which has resulted in their growing popularity among youngsters. The rising demand for smart TVs will challenge the growth of the global set-top boxes market.
The global set-top boxes market has been segmented based on product type, resolution, end-user, sales channel, and regions.
The regions analysed for the market include North America, Europe, South America, Asia Pacific, the Middle East, and Africa. Asia Pacific region emerged as the largest market for the global set-top boxes market, with a 37.16% market revenue share in 2021.
Asia Pacific region Set-Top Boxes Market Share in 2020 - 37.16%
www.thebrainyinsights.com
Check the geographical analysis of this market by requesting a free sample
The key players are now concentrating on implementing strategies such as adopting new technology, raw materials, and ingredients, innovating new product flavours, mergers & acquisitions, joint ventures, alliances, and partnerships to improve their market position in the global set-top boxes industry.
In May 2021, Gospell joined Antriksh Digital Solution LLP, an Indian company specialising in digital television and broadcasting product solutions. The partnership intends to make DRM receivers more consumer-friendly and meet India's growing demand for DRM goods. In India, Gospell may provide Antriksh Digital with consultancy, integration, customisation services, and specialised DRM products.
As per The Brainy Insights, the size of the Set-top boxes market was valued at USD 18.76 Billion in 2021 to USD 25.87 Billion by 2030.
Global set-top boxes market is growing at a CAGR of 3.63% during the forecast period 2022-2030.
Asia Pacific region emerged as the largest market for the set-top boxes.
The market's growth will be influenced by the rising consumer demand.
The increasing consumption of content on smartphones, laptops and other smart connected devices could hamper the market growth.
Innovative products and services will provide huge opportunities to the market.
Key players are Samsung Electronics Ltd., Huawei Technologies Ltd., HUMAX, Skyworth Group, Advanced Digital Broadcast, ARRIS International, CISCO Systems Inc., Technicolor, EchoStar Corporation, and SAGEMCOM
1. Introduction
1.1. Objectives of the Study
1.2. Market Definition
1.3. Research Scope
1.4. Currency
1.5. Key Target Audience
2. Research Methodology and Assumptions
3. Executive Summary
4. Premium Insights
4.1. Porter’s Five Forces Analysis
4.2. Value Chain Analysis
4.3. Top Investment Pockets
4.3.1. Market Attractiveness Analysis by Product Type
4.3.2. Market Attractiveness Analysis by Resolution
4.3.3. Market Attractiveness Analysis by End User
4.3.4. Market Attractiveness Analysis by Sales Channel
4.3.5. Market Attractiveness Analysis by Region
4.4. Industry Trends
5. Market Dynamics
5.1. Market Evaluation
5.2. Drivers
5.2.1. Rising consumer demand
5.3. Restraints
5.3.1. The increasing consumption of content on smartphones, laptops and other smart connected devices
5.4. Opportunities
5.4.1. Innovative products and services
5.5. Challenges
5.5.1. Smart TVs
6. Global Set-Top Boxes Market Analysis and Forecast, By Product Type
6.1. Segment Overview
6.2. Cable
6.3. Digital Terrestrial Television (DTT)
6.4. Satellite
6.5. Over-The-Top (OTT)
6.6. Hybrid
7. Global Set-Top Boxes Market Analysis and Forecast, By Resolution
7.1. Segment Overview
7.2. Standard Definition (SD)
7.3. High Definition (HD)
7.4. Ultra-High Definition (UHD)
7.5. 4K And Above
8. Global Set-Top Boxes Market Analysis and Forecast, By End User
8.1. Segment Overview
8.2. Residential
8.3. Commercial
9. Global Set-Top Boxes Market Analysis and Forecast, By Sales Channel
9.1. Segment Overview
9.2. Online
9.3. Offline
10. Global Set-Top Boxes Market Analysis and Forecast, By Regional Analysis
10.1. Segment Overview
10.2. North America
10.2.1. U.S.
10.2.2. Canada
10.2.3. Mexico
10.3. Europe
10.3.1. Germany
10.3.2. France
10.3.3. U.K.
10.3.4. Italy
10.3.5. Spain
10.4. Asia-Pacific
10.4.1. Japan
10.4.2. China
10.4.3. India
10.5. South America
10.5.1. Brazil
10.6. Middle East and Africa
10.6.1. UAE
10.6.2. South Africa
11. Global Set-Top Boxes Market-Competitive Landscape
11.1. Overview
11.2. Market Share of Key Players in the Set-Top Boxes Market
11.2.1. Global Company Market Share
11.2.2. North America Company Market Share
11.2.3. Europe Company Market Share
11.2.4. APAC Company Market Share
11.3. Competitive Situations and Trends
11.3.1. Product Launches and Developments
11.3.2. Partnerships, Collaborations, and Agreements
11.3.3. Mergers & Acquisitions
11.3.4. Expansions
12. Company Profiles
12.1. Samsung Electronics Ltd.
12.1.1. Business Overview
12.1.2. Company Snapshot
12.1.3. Company Market Share Analysis
12.1.4. Company Product Portfolio
12.1.5. Recent Developments
12.1.6. SWOT Analysis
12.2. Huawei Technologies Ltd.
12.2.1. Business Overview
12.2.2. Company Snapshot
12.2.3. Company Market Share Analysis
12.2.4. Company Product Portfolio
12.2.5. Recent Developments
12.2.6. SWOT Analysis
12.3. HUMAX
12.3.1. Business Overview
12.3.2. Company Snapshot
12.3.3. Company Market Share Analysis
12.3.4. Company Product Portfolio
12.3.5. Recent Developments
12.3.6. SWOT Analysis
12.4. Skyworth Group
12.4.1. Business Overview
12.4.2. Company Snapshot
12.4.3. Company Market Share Analysis
12.4.4. Company Product Portfolio
12.4.5. Recent Developments
12.4.6. SWOT Analysis
12.5. Advanced Digital Broadcast
12.5.1. Business Overview
12.5.2. Company Snapshot
12.5.3. Company Market Share Analysis
12.5.4. Company Product Portfolio
12.5.5. Recent Developments
12.5.6. SWOT Analysis
12.6. ARRIS International
12.6.1. Business Overview
12.6.2. Company Snapshot
12.6.3. Company Market Share Analysis
12.6.4. Company Product Portfolio
12.6.5. Recent Developments
12.6.6. SWOT Analysis
12.7. CISCO Systems Inc.
12.7.1. Business Overview
12.7.2. Company Snapshot
12.7.3. Company Market Share Analysis
12.7.4. Company Product Portfolio
12.7.5. Recent Developments
12.7.6. SWOT Analysis
12.8. Technicolor
12.8.1. Business Overview
12.8.2. Company Snapshot
12.8.3. Company Market Share Analysis
12.8.4. Company Product Portfolio
12.8.5. Recent Developments
12.8.6. SWOT Analysis
12.9. EchoStar Corporation
12.9.1. Business Overview
12.9.2. Company Snapshot
12.9.3. Company Market Share Analysis
12.9.4. Company Product Portfolio
12.9.5. Recent Developments
12.9.6. SWOT Analysis
12.10. SAGEMCOM
12.10.1. Business Overview
12.10.2. Company Snapshot
12.10.3. Company Market Share Analysis
12.10.4. Company Product Portfolio
12.10.5. Recent Developments
12.10.6. SWOT Analysis
List of Table
1. Global Set-Top Boxes Market, By Product Type, 2019-2030 (USD Billion)
2. Global Cable Set-Top Boxes Market, By Region, 2019-2030 (USD Billion)
3. Global Digital Terrestrial Television (DTT) Set-Top Boxes Market, By Region, 2019-2030 (USD Billion)
4. Global Satellite Set-Top Boxes Market, By Region, 2019-2030 (USD Billion)
5. Global Over-The-Top (OTT) Set-Top Boxes Market, By Region, 2019-2030 (USD Billion)
6. Global Hybrid Set-Top Boxes Market, By Region, 2019-2030 (USD Billion)
7. Global Set-Top Boxes Market, By Resolution, 2019-2030 (USD Billion)
8. Global Standard Definition (SD) Set-Top Boxes Market, By Region, 2019-2030 (USD Billion)
9. Global High Definition (HD) Set-Top Boxes Market, By Region, 2019-2030 (USD Billion)
10. Global Ultra High Definition (UHD) Set-Top Boxes Market, By Region, 2019-2030 (USD Billion)
11. Global 4K & Above Set-Top Boxes Market, By Region, 2019-2030 (USD Billion)
12. Global Set-Top Boxes Market, By End User, 2019-2030 (USD Billion)
13. Global Residential Set-Top Boxes Market, By Region, 2019-2030 (USD Billion)
14. Global Commercial Set-Top Boxes Market, By Region, 2019-2030 (USD Billion)
15. Global Set-Top Boxes Market, By Sales Channel, 2019-2030 (USD Billion)
16. Global Online Set-Top Boxes Market, By Region, 2019-2030 (USD Billion)
17. Global Offline Set-Top Boxes Market, By Region, 2019-2030 (USD Billion)
18. Global Set-Top Boxes Market, By Region, 2019-2030 (USD Billion)
19. North America Set-Top Boxes Market, By Product Type, 2019-2030 (USD Billion)
20. North America Set-Top Boxes Market, By Resolution, 2019-2030 (USD Billion)
21. North America Set-Top Boxes Market, By End User, 2019-2030 (USD Billion)
22. North America Set-Top Boxes Market, By Sales Channel, 2019-2030 (USD Billion)
23. U.S. Set-Top Boxes Market, By Product Type, 2019-2030 (USD Billion)
24. U.S. Set-Top Boxes Market, By Resolution, 2019-2030 (USD Billion)
25. U.S. Set-Top Boxes Market, By End User, 2019-2030 (USD Billion)
26. U.S. Set-Top Boxes Market, By Sales Channel, 2019-2030 (USD Billion)
27. Canada Set-Top Boxes Market, By Product Type, 2019-2030 (USD Billion)
28. Canada Set-Top Boxes Market, By Resolution, 2019-2030 (USD Billion)
29. Canada Set-Top Boxes Market, By End User, 2019-2030 (USD Billion)
30. Canada Set-Top Boxes Market, By Sales Channel, 2019-2030 (USD Billion)
31. Mexico Set-Top Boxes Market, By Product Type, 2019-2030 (USD Billion)
32. Mexico Set-Top Boxes Market, By Resolution, 2019-2030 (USD Billion)
33. Mexico Set-Top Boxes Market, By End User, 2019-2030 (USD Billion)
34. Mexico Set-Top Boxes Market, By Sales Channel, 2019-2030 (USD Billion)
35. Europe Set-Top Boxes Market, By Product Type, 2019-2030 (USD Billion)
36. Europe Set-Top Boxes Market, By Resolution, 2019-2030 (USD Billion)
37. Europe Set-Top Boxes Market, By End User, 2019-2030 (USD Billion)
38. Europe Set-Top Boxes Market, By Sales Channel, 2019-2030 (USD Billion)
39. Germany Set-Top Boxes Market, By Product Type, 2019-2030 (USD Billion)
40. Germany Set-Top Boxes Market, By Resolution, 2019-2030 (USD Billion)
41. Germany Set-Top Boxes Market, By End User, 2019-2030 (USD Billion)
42. Germany Set-Top Boxes Market, By Sales Channel, 2019-2030 (USD Billion)
43. France Set-Top Boxes Market, By Product Type, 2019-2030 (USD Billion)
44. France Set-Top Boxes Market, By Resolution, 2019-2030 (USD Billion)
45. France Set-Top Boxes Market, By End User, 2019-2030 (USD Billion)
46. France Set-Top Boxes Market, By Sales Channel, 2019-2030 (USD Billion)
47. U.K. Set-Top Boxes Market, By Product Type, 2019-2030 (USD Billion)
48. U.K. Set-Top Boxes Market, By Resolution, 2019-2030 (USD Billion)
49. U.K. Set-Top Boxes Market, By End User, 2019-2030 (USD Billion)
50. U.K. Set-Top Boxes Market, By Sales Channel, 2019-2030 (USD Billion)
51. Italy Set-Top Boxes Market, By Product Type, 2019-2030 (USD Billion)
52. Italy Set-Top Boxes Market, By Resolution, 2019-2030 (USD Billion)
53. Italy Set-Top Boxes Market, By End User, 2019-2030 (USD Billion)
54. Italy Set-Top Boxes Market, By Sales Channel, 2019-2030 (USD Billion)
55. Spain Set-Top Boxes Market, By Product Type, 2019-2030 (USD Billion)
56. Spain Set-Top Boxes Market, By Resolution, 2019-2030 (USD Billion)
57. Spain Set-Top Boxes Market, By End User, 2019-2030 (USD Billion)
58. Spain Set-Top Boxes Market, By Sales Channel, 2019-2030 (USD Billion)
59. Asia Pacific Set-Top Boxes Market, By Product Type, 2019-2030 (USD Billion)
60. Asia Pacific Set-Top Boxes Market, By Resolution, 2019-2030 (USD Billion)
61. Asia Pacific Set-Top Boxes Market, By End User, 2019-2030 (USD Billion)
62. Asia Pacific Set-Top Boxes Market, By Sales Channel, 2019-2030 (USD Billion)
63. Japan Set-Top Boxes Market, By Product Type, 2019-2030 (USD Billion)
64. Japan Set-Top Boxes Market, By Resolution, 2019-2030 (USD Billion)
65. Japan Set-Top Boxes Market, By End User, 2019-2030 (USD Billion)
66. Japan Set-Top Boxes Market, By Sales Channel, 2019-2030 (USD Billion)
67. China Set-Top Boxes Market, By Product Type, 2019-2030 (USD Billion)
68. China Set-Top Boxes Market, By Resolution, 2019-2030 (USD Billion)
69. China Set-Top Boxes Market, By End User, 2019-2030 (USD Billion)
70. China Set-Top Boxes Market, By Sales Channel, 2019-2030 (USD Billion)
71. India Set-Top Boxes Market, By Product Type, 2019-2030 (USD Billion)
72. India Set-Top Boxes Market, By Resolution, 2019-2030 (USD Billion)
73. India Set-Top Boxes Market, By End User, 2019-2030 (USD Billion)
74. India Set-Top Boxes Market, By Sales Channel, 2019-2030 (USD Billion)
75. South America Set-Top Boxes Market, By Product Type, 2019-2030 (USD Billion)
76. South America Set-Top Boxes Market, By Resolution, 2019-2030 (USD Billion)
77. South America Set-Top Boxes Market, By End User, 2019-2030 (USD Billion)
78. South America Set-Top Boxes Market, By Sales Channel, 2019-2030 (USD Billion)
79. Brazil Set-Top Boxes Market, By Product Type, 2019-2030 (USD Billion)
80. Brazil Set-Top Boxes Market, By Resolution, 2019-2030 (USD Billion)
81. Brazil Set-Top Boxes Market, By End User, 2019-2030 (USD Billion)
82. Brazil Set-Top Boxes Market, By Sales Channel, 2019-2030 (USD Billion)
83. Middle East and Africa Set-Top Boxes Market, By Product Type, 2019-2030 (USD Billion)
84. Middle East and Africa Set-Top Boxes Market, By Resolution, 2019-2030 (USD Billion)
85. Middle East and Africa Set-Top Boxes Market, By End User, 2019-2030 (USD Billion)
86. Middle East and Africa Set-Top Boxes Market, By Sales Channel, 2019-2030 (USD Billion)
87. UAE Set-Top Boxes Market, By Product Type, 2019-2030 (USD Billion)
88. UAE Set-Top Boxes Market, By Resolution, 2019-2030 (USD Billion)
89. UAE Set-Top Boxes Market, By End User, 2019-2030 (USD Billion)
90. UAE Set-Top Boxes Market, By Sales Channel, 2019-2030 (USD Billion)
91. South Africa Set-Top Boxes Market, By Product Type, 2019-2030 (USD Billion)
92. South Africa Set-Top Boxes Market, By Resolution, 2019-2030 (USD Billion)
93. South Africa Set-Top Boxes Market, By End User, 2019-2030 (USD Billion)
94. South Africa Set-Top Boxes Market, By Sales Channel, 2019-2030 (USD Billion)
List of Figures
1. Global Set-Top Boxes Market Segmentation
2. Set-Top Boxes Market: Research Methodology
3. Market Size Estimation Methodology: Bottom-Up Approach
4. Market Size Estimation Methodology: Top-Down Approach
5. Data Triangulation
6. Porter’s Five Forces Analysis
7. Value Chain Analysis
8. Global Set-Top Boxes Market Attractiveness Analysis by Product Type
9. Global Set-Top Boxes Market Attractiveness Analysis by Resolution
10. Global Set-Top Boxes Market Attractiveness Analysis by End User
11. Global Set-Top Boxes Market Attractiveness Analysis by Sales Channel
12. Global Set-Top Boxes Market Attractiveness Analysis by Region
13. Global Set-Top Boxes Market: Dynamics
14. Global Set-Top Boxes Market Share by Product Type (2022 & 2030)
15. Global Set-Top Boxes Market Share by Resolution (2022 & 2030)
16. Global Set-Top Boxes Market Share by End User (2022 & 2030)
17. Global Set-Top Boxes Market Share by Sales Channel (2022 & 2030)
18. Global Set-Top Boxes Market Share by Regions (2022 & 2030)
19. Global Set-Top Boxes Market Share by Company (2021)
This study forecasts revenue at global, regional, and country levels from 2019 to 2030. The Brainy Insights has segmented the global set-top boxes market based on below mentioned segments:
Global Set-Top Boxes Market by Product Type:
Global Set-Top Boxes Market by Resolution:
Global Set-Top Boxes Market by End User:
Global Set-Top Boxes Market by Sales Channel:
Global Set-Top Boxes Market by Region:
Research has its special purpose to undertake marketing efficiently. In this competitive scenario, businesses need information across all industry verticals; the information about customer wants, market demand, competition, industry trends, distribution channels etc. This information needs to be updated regularly because businesses operate in a dynamic environment. Our organization, The Brainy Insights incorporates scientific and systematic research procedures in order to get proper market insights and industry analysis for overall business success. The analysis consists of studying the market from a miniscule level wherein we implement statistical tools which helps us in examining the data with accuracy and precision.
Our research reports feature both; quantitative and qualitative aspects for any market. Qualitative information for any market research process are fundamental because they reveal the customer needs and wants, usage and consumption for any product/service related to a specific industry. This in turn aids the marketers/investors in knowing certain perceptions of the customers. Qualitative research can enlighten about the different product concepts and designs along with unique service offering that in turn, helps define marketing problems and generate opportunities. On the other hand, quantitative research engages with the data collection process through interviews, e-mail interactions, surveys and pilot studies. Quantitative aspects for the market research are useful to validate the hypotheses generated during qualitative research method, explore empirical patterns in the data with the help of statistical tools, and finally make the market estimations.
The Brainy Insights offers comprehensive research and analysis, based on a wide assortment of factual insights gained through interviews with CXOs and global experts and secondary data from reliable sources. Our analysts and industry specialist assume vital roles in building up statistical tools and analysis models, which are used to analyse the data and arrive at accurate insights with exceedingly informative research discoveries. The data provided by our organization have proven precious to a diverse range of companies, facilitating them to address issues such as determining which products/services are the most appealing, whether or not customers use the product in the manner anticipated, the purchasing intentions of the market and many others.
Our research methodology encompasses an idyllic combination of primary and secondary initiatives. Key phases involved in this process are listed below:

The phase involves the gathering and collecting of market data and its related information with the help of different sources & research procedures.

The data procurement stage involves in data gathering and collecting through various data sources.
This stage involves in extensive research. These data sources includes:
Purchased Database: Purchased databases play a crucial role in estimating the market sizes irrespective of the domain. Our purchased database includes:
Primary Research: The Brainy Insights interacts with leading companies and experts of the concerned domain to develop the analyst team’s market understanding and expertise. It improves and substantiates every single data presented in the market reports. Primary research mainly involves in telephonic interviews, E-mail interactions and face-to-face interviews with the raw material providers, manufacturers/producers, distributors, & independent consultants. The interviews that we conduct provides valuable data on market size and industry growth trends prevailing in the market. Our organization also conducts surveys with the various industry experts in order to gain overall insights of the industry/market. For instance, in healthcare industry we conduct surveys with the pharmacists, doctors, surgeons and nurses in order to gain insights and key information of a medical product/device/equipment which the customers are going to usage. Surveys are conducted in the form of questionnaire designed by our own analyst team. Surveys plays an important role in primary research because surveys helps us to identify the key target audiences of the market. Additionally, surveys helps to identify the key target audience engaged with the market. Our survey team conducts the survey by targeting the key audience, thus gaining insights from them. Based on the perspectives of the customers, this information is utilized to formulate market strategies. Moreover, market surveys helps us to understand the current competitive situation of the industry. To be precise, our survey process typically involve with the 360 analysis of the market. This analytical process begins by identifying the prospective customers for a product or service related to the market/industry to obtain data on how a product/service could fit into customers’ lives.

Secondary Research: The secondary data sources includes information published by the on-profit organizations such as World bank, WHO, company fillings, investor presentations, annual reports, national government documents, statistical databases, blogs, articles, white papers and others. From the annual report, we analyse a company’s revenue to understand the key segment and market share of that organization in a particular region. We analyse the company websites and adopt the product mapping technique which is important for deriving the segment revenue. In the product mapping method, we select and categorize the products offered by the companies catering to domain specific market, deduce the product revenue for each of the companies so as to get overall estimation of the market size. We also source data and analyses trends based on information received from supply side and demand side intermediaries in the value chain. The supply side denotes the data gathered from supplier, distributor, wholesaler and the demand side illustrates the data gathered from the end customers for respective market domain.

The supply side for a domain specific market is analysed by:
The demand side for the market is estimated through:
In-house Library: Apart from these third-party sources, we have our in-house library of qualitative and quantitative information. Our in-house database includes market data for various industry and domains. These data are updated on regular basis as per the changing market scenario. Our library includes, historic databases, internal audit reports and archives.
Sometimes there are instances where there is no metadata or raw data available for any domain specific market. For those cases, we use our expertise to forecast and estimate the market size in order to generate comprehensive data sets. Our analyst team adopt a robust research technique in order to produce the estimates:
Data Synthesis: This stage involves the analysis & mapping of all the information obtained from the previous step. It also involves in scrutinizing the data for any discrepancy observed while data gathering related to the market. The data is collected with consideration to the heterogeneity of sources. Robust scientific techniques are in place for synthesizing disparate data sets and provide the essential contextual information that can orient market strategies. The Brainy Insights has extensive experience in data synthesis where the data passes through various stages:


Market Deduction & Formulation: The final stage comprises of assigning data points at appropriate market spaces so as to deduce feasible conclusions. Analyst perspective & subject matter expert based holistic form of market sizing coupled with industry analysis also plays a crucial role in this stage.
This stage involves in finalization of the market size and numbers that we have collected from data integration step. With data interpolation, it is made sure that there is no gap in the market data. Successful trend analysis is done by our analysts using extrapolation techniques, which provide the best possible forecasts for the market.
Data Validation & Market Feedback: Validation is the most important step in the process. Validation & re-validation via an intricately designed process helps us finalize data-points to be used for final calculations.

The Brainy Insights interacts with leading companies and experts of the concerned domain to develop the analyst team’s market understanding and expertise. It improves and substantiates every single data presented in the market reports. The data validation interview and discussion panels are typically composed of the most experienced industry members. The participants include, however, are not limited to:
Moreover, we always validate our data and findings through primary respondents from all the major regions we are working on.


Free Customization
Fortune 500 Clients
Free Yearly Update On Purchase Of Multi/Corporate License
Companies Served Till Date