- +1-315-215-1633
- sales@thebrainyinsights.com

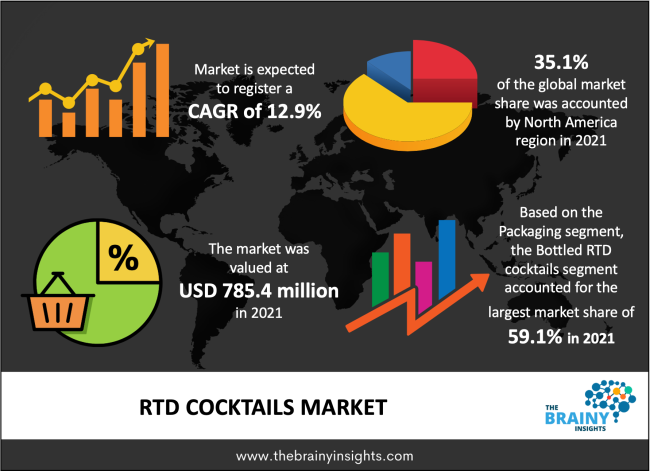
The RTD cocktails market size was valued at USD 785.4 million in 2021 and is anticipated to grow at a CAGR of 12.9% from 2022 to 2030. The rising demand and popularity of low-alcoholic flavored beverages are driving the demand for RTD cocktails. Increasing health concerns and focus on responsible drinking habits among the youth population has boosted the demand in countries like the US, Australia, the UK, and others.
RTD cocktails are available in a wide variety of flavors such as citrus, lemon, watermelon, and grapefruit with an alcohol base of vodka, gin, whisky, rum, and wine. The convenience offered by these drinks has increased their sale across various distribution channels. According to Drizly, RTD cocktails accounted for 3% of the total liquor sales in 2020 and it is the fastest-growing sub-category with a growth rate of over 1000% in 2020.
As consumers are becoming more sophisticated with the choice of products they consume or purchase. They prefer to spend money on premium alcoholic beverages rather than conventional drinks. Consumers these days want to enjoy the experience of drinking, thus, are turning to RTD cocktails. Product innovation in terms of flavors and infusion of natural herbs is likely to boost product demand.
Get an overview of this study by requesting a free sample
A lot of RTD cocktails available in the market are low in calories, with no added sugar, and infused with mint, ginger, and lemon peel which are beneficial for health. Manufacturer operating in this market have carefully studied their target audience, Gen Z and millennials, which often seek healthier products. Thus, key players have been launching healthier versions of these drinks to attract consumers.
For instance, in November 2021, Wood’s High Mountain Distillery, a Colorado-based company, introduced three new RTD cocktails in 12-ounce aluminum cans with ABV ranging from 8% to 11%. The drinks contain organic assam, orange pekoe tea, cardamom, lemon peel, and grapefruit as ingredients.
The spirit-based RTD cocktails accounted for the largest market share of 44.1% in 2021. Most consumers worldwide prefer to drink RTD cocktails with a base of spirits-gin, tequila, rum, and whisky, which is driving the segment’s growth. Increased product launches in this category by the leading manufacturer are expected to boost this category further in the coming years. For instance, The Coco Cola Company and Brown-Forman introduced a Jack & Coke RTD cocktail in Mexico.
According to IWSR vodka and tequila dominate the spirit-based RTD cocktails market and whisky base accounted for only 5% of the category in 2021. However, consumer demand for vivid flavors and premium products is likely to increase the consumption of RTD cocktails with whisky as a base.
Wine-based RTD cocktails were popular in the early days as wine coolers. Now the category has revamped itself as wine-based RTD cocktails and gaining traction from health-conscious consumers, particularly women as women perceive wine as a healthier alternative to the spirit and malt-based beverages.
The supermarkets & hypermarkets accounted for the largest revenue share of more than 60% in 2021. As RTD cocktails have a low level of alcohol, thus, they are easily available for sale through these channels. Most of the players in this market offer their products in stores like Walmart, Target, Tesco, and Carrefour owing to their wide consumer reach. Supermarkets are also launching their private-label brands owing to the high demand from consumers. For instance, in June 2022, Target announced the launch of “Casa Cantina” RTD cocktails.
The online segment is anticipated to register the fastest CAGR from 2022-2030. Many players are offering products through their websites or through alcohol delivery platforms such as Drizly owing to shifting consumer behavior for shopping. Slow & Low offers its RTD cocktail- Whiskey Sunshine and Whiskey Buck, and Rock & Rye through its website and Drizly.
Bottled RTD cocktails accounted for a larger market share of 59.1% in 2021. Bottled cocktails are usually purchased for at-home consumption as there is always a risk of breaking owing to the fragile nature of glass. Consumers used to purchase bottled RTD cocktails as they could see the drink and it appealed to them. Now, consumers are moving away from bottled packaging towards aluminum cans as they are easy to handle.
Canned packaging is anticipated to register a faster CAGR during the forecast period. Cans are portable, lightweight, and compact, making them ideal for packaging material for RTD cocktails. Moreover, their easy recyclability also influences consumers to purchase cans. Moreover, vivid design on cans also helps manufacturers to connect with their target audience.
North America led the market with a share of 35.1% in 2021. The consumption of RTD cocktails has skyrocketed like hard seltzer in the US as more people are looking for convenient and flavorful drinks. These drinks have also eliminated the need to go to a bar or club to enjoy a cocktail. With increasing product availability and continuous innovation, the consumption of these drinks is expected to grow further in the coming years.
Central & South America is likely to witness the second-fastest CAGR. Consumers in countries like Brazil, Argentina, and Chile have been following the footsteps of the US culture, thus, the manufacturer has been targeting this market. In August 2021, Novo Fogo launched the RTD cocktail -Brazilian Old Fashioned Highball, which is composed of cachaça, vanilla syrup, orange and aromatic bitters, and water.
Asia Pacific is anticipated to register the fastest CAGR of 14.7% during the forecast period. The young generation in Asian countries is seeking premium, sophisticated, low-alcoholic, and low-calorie beverages, which is driving the demand for RTD cocktails. The rise of cocktail culture along with convenience has increased the consumption of RTD cocktails in this region.
The key players are majorly focused on product innovations and partnerships to capture the market. For instance, Pernod Ricard has launched a couple of RTD cocktails such as Malibu canned cocktails, Jameson Ginger & Lime, and Beefeater Gin and Tonics to remain ahead in the competition. A lot of emerging players in the market such as Decimalist, Post Meridiem Spirits, Black Infusions, and Sagamore Spirit are focusing on quality and social media branding to reach their target consumers.
Segments Covered in the Report
1. Introduction
1.1. Objectives of the Study
1.2. Market Definition
1.3. Research Scope
1.4. Currency
1.5. Key Target Audience
2. Research Methodology and Assumptions
3. Executive Summary
4. Premium Insights
4.1. Porter’s Five Forces Analysis
4.2. Value Chain Analysis
4.3. Top Investment Pockets
4.3.1. Market Attractiveness Analysis by Product
4.3.2. Market Attractiveness Analysis by Distribution Channel
4.3.3. Market Attractiveness Analysis by Packaging
4.3.4. Market Attractiveness Analysis by Region
4.4. Industry Trends
5. Market Dynamics
5.1. Market Evaluation
5.2. Drivers
5.2.1. Rising demand for low-alcoholic convenient cocktails drinks
5.3. Restraints
5.3.1. Difference in taxation of RTD cocktails across the globe
5.4. Opportunities
5.4.1. Surging Demand for RTD Cocktails
6. Global RTD Cocktails Market Analysis and Forecast, By Product
6.1. Segment Overview
6.2. Malt-based
6.3. Spirit-based
6.4. Wine-based
7. Global RTD Cocktails Market Analysis and Forecast, By Distribution Channel
7.1. Segment Overview
7.2. Supermarkets & Hypermarkets
7.3. Online
7.4. Liquor Stores
7.5. Others
8. Global RTD Cocktails Market Analysis and Forecast, By Packaging
8.1. Segment Overview
8.2. Bottled
8.3. Canned
9. Global RTD Cocktails Market Analysis and Forecast, By Regional Analysis
9.1. Segment Overview
9.2. North America
9.2.1. U.S.
9.2.2. Canada
9.2.3. Mexico
9.3. Europe
9.3.1. Germany
9.3.2. France
9.3.3. U.K.
9.3.4. Italy
9.3.5. Spain
9.4. Asia-Pacific
9.4.1. Japan
9.4.2. China
9.4.3. India
9.5. South America
9.5.1. Brazil
9.6. Middle East and Africa
9.6.1. UAE
9.6.2. South Africa
10. Global RTD Cocktails Market-Competitive Landscape
10.1. Overview
10.2. Market Share of Key Players in the RTD Cocktails Market
10.2.1. Global Company Market Share
10.2.2. North America Company Market Share
10.2.3. Europe Company Market Share
10.2.4. APAC Company Market Share
10.3. Competitive Situations and Trends
10.3.1. Product Launches and Developments
10.3.2. Partnerships, Collaborations, and Agreements
10.3.3. Mergers & Acquisitions
10.3.4. Expansions
11. Company Profiles
11.1. Diageo plc.
11.1.1. Business Overview
11.1.2. Company Snapshot
11.1.3. Company Market Share Analysis
11.1.4. Company Product Portfolio
11.1.5. Recent Developments
11.1.6. SWOT Analysis
11.2. Brown-Forman
11.2.1. Business Overview
11.2.2. Company Snapshot
11.2.3. Company Market Share Analysis
11.2.4. Company Product Portfolio
11.2.5. Recent Developments
11.2.6. SWOT Analysis
11.3. Pernod Ricard
11.3.1. Business Overview
11.3.2. Company Snapshot
11.3.3. Company Market Share Analysis
11.3.4. Company Product Portfolio
11.3.5. Recent Developments
11.3.6. SWOT Analysis
11.4. Bacardi Limited.
11.4.1. Business Overview
11.4.2. Company Snapshot
11.4.3. Company Market Share Analysis
11.4.4. Company Product Portfolio
11.4.5. Recent Developments
11.4.6. SWOT Analysis
11.5. Asahi Group Holdings, Ltd.
11.5.1. Business Overview
11.5.2. Company Snapshot
11.5.3. Company Market Share Analysis
11.5.4. Company Product Portfolio
11.5.5. Recent Developments
11.5.6. SWOT Analysis
11.6. Halewood Wines & Spirits
11.6.1. Business Overview
11.6.2. Company Snapshot
11.6.3. Company Market Share Analysis
11.6.4. Company Product Portfolio
11.6.5. Recent Developments
11.6.6. SWOT Analysis
11.7. SUNTORY HOLDINGS LIMITED
11.7.1. Business Overview
11.7.2. Company Snapshot
11.7.3. Company Market Share Analysis
11.7.4. Company Product Portfolio
11.7.5. Recent Developments
11.7.6. SWOT Analysis
11.8. Constellation Brands
11.8.1. Business Overview
11.8.2. Company Snapshot
11.8.3. Company Market Share Analysis
11.8.4. Company Product Portfolio
11.8.5. Recent Developments
11.8.6. SWOT Analysis
11.9. Two Chicks Drinks, LLC
11.9.1. Business Overview
11.9.2. Company Snapshot
11.9.3. Company Market Share Analysis
11.9.4. Company Product Portfolio
11.9.5. Recent Developments
11.9.6. SWOT Analysis
11.10. Cutwater Spirits
11.10.1. Business Overview
11.10.2. Company Snapshot
11.10.3. Company Market Share Analysis
11.10.4. Company Product Portfolio
11.10.5. Recent Developments
11.10.6. SWOT Analysis
List of Table
1. Global RTD Cocktails Market, By Product, 2019-2030 (USD Billion)
2. Global Malt-based RTD Cocktails Market, By Region, 2019-2030 (USD Billion)
3. Global Spirit-based RTD Cocktails Market, By Region, 2019-2030 (USD Billion)
4. Global Wine-based RTD Cocktails Market, By Region, 2019-2030 (USD Billion)
5. Global RTD Cocktails Market, By Distribution Channel, 2019-2030 (USD Billion)
6. Global Supermarkets & Hypermarkets RTD Cocktails Market, By Region, 2019-2030 (USD Billion)
7. Global Online RTD Cocktails Market, By Region, 2019-2030 (USD Billion)
8. Global Liquor Stores RTD Cocktails Market, By Region, 2019-2030 (USD Billion)
9. Global Others RTD Cocktails Market, By Region, 2019-2030 (USD Billion)
10. Global RTD Cocktails Market, By Packaging, 2019-2030 (USD Billion)
11. Global Bottled RTD Cocktails Market, By Region, 2019-2030 (USD Billion)
12. Global Canned RTD Cocktails Market, By Region, 2019-2030 (USD Billion)
13. Global RTD Cocktails Market, By Region, 2019-2030 (USD Billion)
14. North America RTD Cocktails Market, By Product, 2019-2030 (USD Billion)
15. North America RTD Cocktails Market, By Distribution Channel, 2019-2030 (USD Billion)
16. North America RTD Cocktails Market, By Packaging, 2019-2030 (USD Billion)
17. U.S. RTD Cocktails Market, By Product, 2019-2030 (USD Billion)
18. U.S. RTD Cocktails Market, By Distribution Channel, 2019-2030 (USD Billion)
19. U.S. RTD Cocktails Market, By Packaging, 2019-2030 (USD Billion)
20. Canada RTD Cocktails Market, By Product, 2019-2030 (USD Billion)
21. Canada RTD Cocktails Market, By Distribution Channel, 2019-2030 (USD Billion)
22. Canada RTD Cocktails Market, By Packaging, 2019-2030 (USD Billion)
23. Mexico RTD Cocktails Market, By Product, 2019-2030 (USD Billion)
24. Mexico RTD Cocktails Market, By Distribution Channel, 2019-2030 (USD Billion)
25. Mexico RTD Cocktails Market, By Packaging, 2019-2030 (USD Billion)
26. Europe RTD Cocktails Market, By Product, 2019-2030 (USD Billion)
27. Europe RTD Cocktails Market, By Distribution Channel, 2019-2030 (USD Billion)
28. Europe RTD Cocktails Market, By Packaging, 2019-2030 (USD Billion)
29. Germany RTD Cocktails Market, By Product, 2019-2030 (USD Billion)
30. Germany RTD Cocktails Market, By Distribution Channel, 2019-2030 (USD Billion)
31. Germany RTD Cocktails Market, By Packaging, 2019-2030 (USD Billion)
32. France RTD Cocktails Market, By Product, 2019-2030 (USD Billion)
33. France RTD Cocktails Market, By Distribution Channel, 2019-2030 (USD Billion)
34. France RTD Cocktails Market, By Packaging, 2019-2030 (USD Billion)
35. U.K. RTD Cocktails Market, By Product, 2019-2030 (USD Billion)
36. U.K. RTD Cocktails Market, By Distribution Channel, 2019-2030 (USD Billion)
37. U.K. RTD Cocktails Market, By Packaging, 2019-2030 (USD Billion)
38. Italy RTD Cocktails Market, By Product, 2019-2030 (USD Billion)
39. Italy RTD Cocktails Market, By Distribution Channel, 2019-2030 (USD Billion)
40. Italy RTD Cocktails Market, By Packaging, 2019-2030 (USD Billion)
41. Spain RTD Cocktails Market, By Product, 2019-2030 (USD Billion)
42. Spain RTD Cocktails Market, By Distribution Channel, 2019-2030 (USD Billion)
43. Spain RTD Cocktails Market, By Packaging, 2019-2030 (USD Billion)
44. Asia Pacific RTD Cocktails Market, By Product, 2019-2030 (USD Billion)
45. Asia Pacific RTD Cocktails Market, By Distribution Channel, 2019-2030 (USD Billion)
46. Asia Pacific RTD Cocktails Market, By Packaging, 2019-2030 (USD Billion)
47. Japan RTD Cocktails Market, By Product, 2019-2030 (USD Billion)
48. Japan RTD Cocktails Market, By Distribution Channel, 2019-2030 (USD Billion)
49. Japan RTD Cocktails Market, By Packaging, 2019-2030 (USD Billion)
50. China RTD Cocktails Market, By Product, 2019-2030 (USD Billion)
51. China RTD Cocktails Market, By Distribution Channel, 2019-2030 (USD Billion)
52. China RTD Cocktails Market, By Packaging, 2019-2030 (USD Billion)
53. India RTD Cocktails Market, By Product, 2019-2030 (USD Billion)
54. India RTD Cocktails Market, By Distribution Channel, 2019-2030 (USD Billion)
55. India RTD Cocktails Market, By Packaging, 2019-2030 (USD Billion)
56. South America RTD Cocktails Market, By Product, 2019-2030 (USD Billion)
57. South America RTD Cocktails Market, By Distribution Channel, 2019-2030 (USD Billion)
58. South America RTD Cocktails Market, By Packaging, 2019-2030 (USD Billion)
59. Brazil RTD Cocktails Market, By Product, 2019-2030 (USD Billion)
60. Brazil RTD Cocktails Market, By Distribution Channel, 2019-2030 (USD Billion)
61. Brazil RTD Cocktails Market, By Packaging, 2019-2030 (USD Billion)
62. Middle East and Africa RTD Cocktails Market, By Product, 2019-2030 (USD Billion)
63. Middle East and Africa RTD Cocktails Market, By Distribution Channel, 2019-2030 (USD Billion)
64. Middle East and Africa RTD Cocktails Market, By Packaging, 2019-2030 (USD Billion)
65. UAE RTD Cocktails Market, By Product, 2019-2030 (USD Billion)
66. UAE RTD Cocktails Market, By Distribution Channel, 2019-2030 (USD Billion)
67. UAE RTD Cocktails Market, By Packaging, 2019-2030 (USD Billion)
68. South Africa RTD Cocktails Market, By Product, 2019-2030 (USD Billion)
69. South Africa RTD Cocktails Market, By Distribution Channel, 2019-2030 (USD Billion)
70. South Africa RTD Cocktails Market, By Packaging, 2019-2030 (USD Billion)
List of Figures
1. Global RTD Cocktails Market Segmentation
2. RTD Cocktails Market: Research Methodology
3. Market Size Estimation Methodology: Bottom-Up Approach
4. Market Size Estimation Methodology: Top-Down Approach
5. Data Triangulation
6. Porter’s Five Forces Analysis
7. Value Chain Analysis
8. Global RTD Cocktails Market Attractiveness Analysis by Product
9. Global RTD Cocktails Market Attractiveness Analysis by Distribution Channel
10. Global RTD Cocktails Market Attractiveness Analysis by Packaging
11. Global RTD Cocktails Market Attractiveness Analysis by Region
12. Global RTD Cocktails Market: Dynamics
13. Global RTD Cocktails Market Share by Product (2022 & 2030)
14. Global RTD Cocktails Market Share by Distribution Channel (2022 & 2030)
15. Global RTD Cocktails Market Share by Packaging (2022 & 2030)
16. Global RTD Cocktails Market Share by Regions (2022 & 2030)
17. Global RTD Cocktails Market Share by Company (2021)
Segments Covered in the Report
Research has its special purpose to undertake marketing efficiently. In this competitive scenario, businesses need information across all industry verticals; the information about customer wants, market demand, competition, industry trends, distribution channels etc. This information needs to be updated regularly because businesses operate in a dynamic environment. Our organization, The Brainy Insights incorporates scientific and systematic research procedures in order to get proper market insights and industry analysis for overall business success. The analysis consists of studying the market from a miniscule level wherein we implement statistical tools which helps us in examining the data with accuracy and precision.
Our research reports feature both; quantitative and qualitative aspects for any market. Qualitative information for any market research process are fundamental because they reveal the customer needs and wants, usage and consumption for any product/service related to a specific industry. This in turn aids the marketers/investors in knowing certain perceptions of the customers. Qualitative research can enlighten about the different product concepts and designs along with unique service offering that in turn, helps define marketing problems and generate opportunities. On the other hand, quantitative research engages with the data collection process through interviews, e-mail interactions, surveys and pilot studies. Quantitative aspects for the market research are useful to validate the hypotheses generated during qualitative research method, explore empirical patterns in the data with the help of statistical tools, and finally make the market estimations.
The Brainy Insights offers comprehensive research and analysis, based on a wide assortment of factual insights gained through interviews with CXOs and global experts and secondary data from reliable sources. Our analysts and industry specialist assume vital roles in building up statistical tools and analysis models, which are used to analyse the data and arrive at accurate insights with exceedingly informative research discoveries. The data provided by our organization have proven precious to a diverse range of companies, facilitating them to address issues such as determining which products/services are the most appealing, whether or not customers use the product in the manner anticipated, the purchasing intentions of the market and many others.
Our research methodology encompasses an idyllic combination of primary and secondary initiatives. Key phases involved in this process are listed below:

The phase involves the gathering and collecting of market data and its related information with the help of different sources & research procedures.

The data procurement stage involves in data gathering and collecting through various data sources.
This stage involves in extensive research. These data sources includes:
Purchased Database: Purchased databases play a crucial role in estimating the market sizes irrespective of the domain. Our purchased database includes:
Primary Research: The Brainy Insights interacts with leading companies and experts of the concerned domain to develop the analyst team’s market understanding and expertise. It improves and substantiates every single data presented in the market reports. Primary research mainly involves in telephonic interviews, E-mail interactions and face-to-face interviews with the raw material providers, manufacturers/producers, distributors, & independent consultants. The interviews that we conduct provides valuable data on market size and industry growth trends prevailing in the market. Our organization also conducts surveys with the various industry experts in order to gain overall insights of the industry/market. For instance, in healthcare industry we conduct surveys with the pharmacists, doctors, surgeons and nurses in order to gain insights and key information of a medical product/device/equipment which the customers are going to usage. Surveys are conducted in the form of questionnaire designed by our own analyst team. Surveys plays an important role in primary research because surveys helps us to identify the key target audiences of the market. Additionally, surveys helps to identify the key target audience engaged with the market. Our survey team conducts the survey by targeting the key audience, thus gaining insights from them. Based on the perspectives of the customers, this information is utilized to formulate market strategies. Moreover, market surveys helps us to understand the current competitive situation of the industry. To be precise, our survey process typically involve with the 360 analysis of the market. This analytical process begins by identifying the prospective customers for a product or service related to the market/industry to obtain data on how a product/service could fit into customers’ lives.

Secondary Research: The secondary data sources includes information published by the on-profit organizations such as World bank, WHO, company fillings, investor presentations, annual reports, national government documents, statistical databases, blogs, articles, white papers and others. From the annual report, we analyse a company’s revenue to understand the key segment and market share of that organization in a particular region. We analyse the company websites and adopt the product mapping technique which is important for deriving the segment revenue. In the product mapping method, we select and categorize the products offered by the companies catering to domain specific market, deduce the product revenue for each of the companies so as to get overall estimation of the market size. We also source data and analyses trends based on information received from supply side and demand side intermediaries in the value chain. The supply side denotes the data gathered from supplier, distributor, wholesaler and the demand side illustrates the data gathered from the end customers for respective market domain.

The supply side for a domain specific market is analysed by:
The demand side for the market is estimated through:
In-house Library: Apart from these third-party sources, we have our in-house library of qualitative and quantitative information. Our in-house database includes market data for various industry and domains. These data are updated on regular basis as per the changing market scenario. Our library includes, historic databases, internal audit reports and archives.
Sometimes there are instances where there is no metadata or raw data available for any domain specific market. For those cases, we use our expertise to forecast and estimate the market size in order to generate comprehensive data sets. Our analyst team adopt a robust research technique in order to produce the estimates:
Data Synthesis: This stage involves the analysis & mapping of all the information obtained from the previous step. It also involves in scrutinizing the data for any discrepancy observed while data gathering related to the market. The data is collected with consideration to the heterogeneity of sources. Robust scientific techniques are in place for synthesizing disparate data sets and provide the essential contextual information that can orient market strategies. The Brainy Insights has extensive experience in data synthesis where the data passes through various stages:


Market Deduction & Formulation: The final stage comprises of assigning data points at appropriate market spaces so as to deduce feasible conclusions. Analyst perspective & subject matter expert based holistic form of market sizing coupled with industry analysis also plays a crucial role in this stage.
This stage involves in finalization of the market size and numbers that we have collected from data integration step. With data interpolation, it is made sure that there is no gap in the market data. Successful trend analysis is done by our analysts using extrapolation techniques, which provide the best possible forecasts for the market.
Data Validation & Market Feedback: Validation is the most important step in the process. Validation & re-validation via an intricately designed process helps us finalize data-points to be used for final calculations.

The Brainy Insights interacts with leading companies and experts of the concerned domain to develop the analyst team’s market understanding and expertise. It improves and substantiates every single data presented in the market reports. The data validation interview and discussion panels are typically composed of the most experienced industry members. The participants include, however, are not limited to:
Moreover, we always validate our data and findings through primary respondents from all the major regions we are working on.


Free Customization
Fortune 500 Clients
Free Yearly Update On Purchase Of Multi/Corporate License
Companies Served Till Date