- +1-315-215-1633
- sales@thebrainyinsights.com

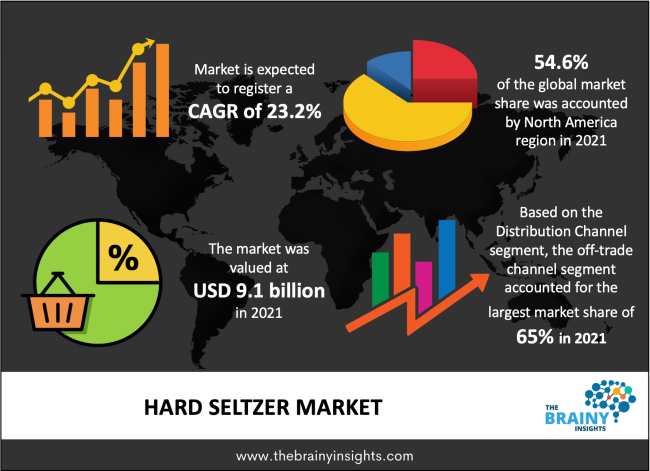
The hard seltzer market size was valued at USD 9.1 billion in 2021 and is anticipated to grow with a CAGR of 23.2% from 2022 to 2030. The demand for hard seltzer is driven by convenience and rising health-conscious consumers, who are looking to cut down their alcohol consumption. Hard seltzers are malt-based RTD alcoholic carbonated drinks that are usually infused with fruit flavors. These become popular among millennials and Gen Z due to their alcohol content, low sugar, and less calorie. Further, these drinks are almost equally popular among men and women in comparison to beer, which is usually preferred by men.
The low prices of hard seltzer in comparison to cocktails, beers, and other alcoholic drinks and easy availability across supermarkets and convenience stores are driving their demand, especially in countries such as the US, Canada, the UK, and the Netherlands. Most of the players operating in this market, initially started their product promotion through the Instagram channel to attract the young generation. According to research conducted by Bank of America, there were six times as many conversations about hard seltzers on Instagram in January 2020 as compared to January 2019.
Hard seltzers are produced using fruit ingredients, sugar, alcohol base, flavors, and yeast. The sugar source used to make hard seltzers may include dextrose, sucrose, cane sugar, agave syrup, and honey. Hard seltzer with natural ingredients like ginger, lime, grapefruit, and real fruit juice appeal more to the consumers. Thus, manufacturers are focused on launching hard seltzer with natural ingredients. For instance, in April 2021, Spindrift introduced Spindrift Spiked, a hard seltzer made with real ingredients, no artificial ingredients, and no added sugar in Boston, LA, and San Diageo.
Get an overview of this study by requesting a free sample
Hard seltzers are enriched with fruit flavors such as lemon, cranberry, orange, and pineapple. Some of the drinks are also rich in antioxidants and vitamin C, which makes them ideal low-alcoholic drinks for health-conscious consumers. Furthermore, hard seltzers are a good option for consumers who do not consume liquor regularly and for those, who are trying to cut back on hard drinks like whisky and rum. The changing lifestyle choices to improve health and the trend of responsible drinking have also boosted the demand for hard seltzers even in developing nations like India.
By ABV content, the market has been segmented into upto 4.9%, 5% to 6.9%, and more than 7.0%. The 5% to 6.9% ABV content segment accounted for the largest market share of 51.1% in 2021. Hard seltzer with moderate alcohol content between 5% to 6% is highly preferred by consumers to get a feel of alcohol along with not getting high. Thus, significant players in the alcohol industry have been expanding in this category. The major brands that offer seltzer in this segment include Shotgun Seltzer, Truly Hard Seltzer, Brouwerij West Hard Seltzer, White Claw Seltzer, Two Robbers Hard Seltzer, and Belching Beaver Hard Seltzer.
Upto 4.9% is anticipated to register the fastest CAGR of 24.1% during the forecast period owing to increasing consumer demand for no and low-alcoholic drinks due to rising focus on health and wellness. Moreover, the increasing demand for low-alcoholic beverages particularly among the young generation is driving the demand for hard seltzer with upto 4.9% ABV content. Further, low-alcoholic drinks are becoming popular among people of all age groups, which is driving the segment’s growth. Over the last few years, online discussion about low and no-alcohol drinks has been on the rise, which is influencing consumers toward low-alcoholic drinks such as hard seltzer.
Off-trade channels held a larger market share of more than 65% in 2021. Most consumers purchase the product from off-trade channels such as supermarkets & hypermarkets while shopping for groceries and other household products. Consumers prefer to buy these products from stores that offer huge discounts and offers. Some of the popular stores for shopping hard seltzer in the US are Walmart and Target. Further, online ordering of hard seltzer is also on the rise in countries such as the UK, China, and India. In developing countries, many regional players are offering their products exclusively through Instagram, which is also expected to drive sales through the off-trade channel.
The on-trade segment is anticipated to register a higher CAGR during the forecast period. Consumers have started opting for low-alcoholic drinks even in social gatherings such as pubs, bars, and eateries owing to rising concern for health. Thus, sale through the on-trade channel is expected to boost in the coming years. Moreover, hard seltzers are likely to replace beers in bars and restaurants in the upcoming years due to their low calories and natural ingredients.
North America led the market with a share of 54.6% in 2021. The growing prominence of major hard seltzer brands in countries such as the US, Canada, and Mexico is expected to propel the consumption of hard seltzers in this region. Some of the major brands dominating the hard seltzer market in the region are Corona Hard Seltzer, Smirnoff Seltzer, White Claw Hard Seltzer, Coors Hard Seltzer, and Truly. Furthermore, the rising focus on low-calorie, low-alcohol, and gluten-free beverages in the region is expected to fuel the demand for hard seltzers over the forecast period. Due to this, companies are focusing on developing hard seltzers with fewer calories and lesser carbs. Companies such as MillerCoors, Diageo plc, and Anheuser-Busch InBev, offer gluten-free hard seltzers with low calories.
The Asia Pacific is expected to expand at the fastest CAGR during the forecast period. The rising consumer demand for low and no alcoholic drinks in countries such as India, China, South Korea, and Australia is driving the demand in this region. Moreover, increased promotion of hard seltzer on social media platforms is likely to increase the demand for hard seltzer among millennials and Gen Z. Countries such as India, where the market/demand for hard seltzer was non-existent a few years back, now have a presence of regional players such as Pursue Hard Seltzer, IST, Bro Seltzer, and Raya, among others. Furthermore, the growing interest of major brands such as Lion, Diageo plc, Pirana, Nectar, and Native Sparkling Store in launching hard seltzers in the untapped market such as New Zealand is expected to bode well for market growth.
The hard seltzer market is very versatile with two brands holding the mature share “White Claw” and “Truly”. Still, several national and local brands are entering this market due to its high growth potential. The market players are adopting various strategies, including new product launches, partnerships, and expansion of product portfolios, to increase their market share in this highly competitive market.
Segments Covered in the Report
1. Introduction
1.1. Objectives of the Study
1.2. Market Definition
1.3. Research Scope
1.4. Currency
1.5. Key Target Audience
2. Research Methodology and Assumptions
3. Executive Summary
4. Premium Insights
4.1. Porter’s Five Forces Analysis
4.2. Value Chain Analysis
4.3. Top Investment Pockets
4.3.1. Market Attractiveness Analysis by ABV Content
4.3.2. Market Attractiveness Analysis by Distribution Channel
4.3.3. Market Attractiveness Analysis by Region
4.4. Industry Trends
5. Market Dynamics
5.1. Market Evaluation
5.2. Drivers
5.2.1. Rising health-conscious consumers
5.3. Restraints
5.3.1. Availability of Substitute Products
5.4. Opportunities
5.4.1. Rising popularity among millennials and Gen Z
5.5. Challenges
5.5.1. Government Restrictions
6. Global Hard Seltzer Market Analysis and Forecast, By ABV Content
6.1. Segment Overview
6.2. Upto 4.9%
6.3. 5% to 6.9%
6.4. More than 7.0%
7. Global Hard Seltzer Market Analysis and Forecast, By Distribution Channel
7.1. Segment Overview
7.2. On-trade
7.3. Off-trade
8. Global Hard Seltzer Market Analysis and Forecast, By Regional Analysis
8.1. Segment Overview
8.2. North America
8.2.1. U.S.
8.2.2. Canada
8.2.3. Mexico
8.3. Europe
8.3.1. Germany
8.3.2. France
8.3.3. U.K.
8.3.4. Italy
8.3.5. Spain
8.4. Asia-Pacific
8.4.1. Japan
8.4.2. China
8.4.3. India
8.5. South America
8.5.1. Brazil
8.6. Middle East and Africa
8.6.1. UAE
8.6.2. South Africa
9. Global Hard Seltzer Market-Competitive Landscape
9.1. Overview
9.2. Market Share of Key Players in the Hard Seltzer Market
9.2.1. Global Company Market Share
9.2.2. North America Company Market Share
9.2.3. Europe Company Market Share
9.2.4. APAC Company Market Share
9.3. Competitive Situations and Trends
9.3.1. Product Launches and Developments
9.3.2. Partnerships, Collaborations, and Agreements
9.3.3. Mergers & Acquisitions
9.3.4. Expansions
10. Company Profiles
10.1. Mark Anthony Brands International
10.1.1. Business Overview
10.1.2. Company Snapshot
10.1.3. Company Market Share Analysis
10.1.4. Company Product Portfolio
10.1.5. Recent Developments
10.1.6. SWOT Analysis
10.2. The Boston Beer Company
10.2.1. Business Overview
10.2.2. Company Snapshot
10.2.3. Company Market Share Analysis
10.2.4. Company Product Portfolio
10.2.5. Recent Developments
10.2.6. SWOT Analysis
10.3. The Coca Cola Company
10.3.1. Business Overview
10.3.2. Company Snapshot
10.3.3. Company Market Share Analysis
10.3.4. Company Product Portfolio
10.3.5. Recent Developments
10.3.6. SWOT Analysis
10.4. Diageo plc
10.4.1. Business Overview
10.4.2. Company Snapshot
10.4.3. Company Market Share Analysis
10.4.4. Company Product Portfolio
10.4.5. Recent Developments
10.4.6. SWOT Analysis
10.5. Heineken N.V.
10.5.1. Business Overview
10.5.2. Company Snapshot
10.5.3. Company Market Share Analysis
10.5.4. Company Product Portfolio
10.5.5. Recent Developments
10.5.6. SWOT Analysis
10.6. Molson Coors Beverage CO
10.6.1. Business Overview
10.6.2. Company Snapshot
10.6.3. Company Market Share Analysis
10.6.4. Company Product Portfolio
10.6.5. Recent Developments
10.6.6. SWOT Analysis
10.7. Constellation Brands, Inc.
10.7.1. Business Overview
10.7.2. Company Snapshot
10.7.3. Company Market Share Analysis
10.7.4. Company Product Portfolio
10.7.5. Recent Developments
10.7.6. SWOT Analysis
10.8. Kopparberg
10.8.1. Business Overview
10.8.2. Company Snapshot
10.8.3. Company Market Share Analysis
10.8.4. Company Product Portfolio
10.8.5. Recent Developments
10.8.6. SWOT Analysis
10.9. Anheuser-Busch InBev
10.9.1. Business Overview
10.9.2. Company Snapshot
10.9.3. Company Market Share Analysis
10.9.4. Company Product Portfolio
10.9.5. Recent Developments
10.9.6. SWOT Analysis
10.10. Bro Seltzer
10.10.1. Business Overview
10.10.2. Company Snapshot
10.10.3. Company Market Share Analysis
10.10.4. Company Product Portfolio
10.10.5. Recent Developments
10.10.6. SWOT Analysis
10.11. Fountain Hard Seltzer
10.11.1. Business Overview
10.11.2. Company Snapshot
10.11.3. Company Market Share Analysis
10.11.4. Company Product Portfolio
10.11.5. Recent Developments
10.11.6. SWOT Analysis
10.12. Shotgun Seltzer
10.12.1. Business Overview
10.12.2. Company Snapshot
10.12.3. Company Market Share Analysis
10.12.4. Company Product Portfolio
10.12.5. Recent Developments
10.12.6. SWOT Analysis
List of Table
1. Global Hard Seltzer Market, By ABV Content, 2019-2030 (USD Billion)
2. Global Upto 4.9% Hard Seltzer Market, By Region, 2019-2030 (USD Billion)
3. Global 5% to 6.9% Hard Seltzer Market, By Region, 2019-2030 (USD Billion)
4. Global More than 7.0% Hard Seltzer Market, By Region, 2019-2030 (USD Billion)
5. Global Hard Seltzer Market, By Distribution Channel, 2019-2030 (USD Billion)
6. Global On-trade Hard Seltzer Market, By Region, 2019-2030 (USD Billion)
7. Global Off-trade Hard Seltzer Market, By Region, 2019-2030 (USD Billion)
8. Global Hard Seltzer Market, By Region, 2019-2030 (USD Billion)
9. North America Hard Seltzer Market, By ABV Content, 2019-2030 (USD Billion)
10. North America Hard Seltzer Market, By Distribution Channel, 2019-2030 (USD Billion)
11. U.S. Hard Seltzer Market, By ABV Content, 2019-2030 (USD Billion)
12. U.S. Hard Seltzer Market, By Distribution Channel, 2019-2030 (USD Billion)
13. Canada Hard Seltzer Market, By ABV Content, 2019-2030 (USD Billion)
14. Canada Hard Seltzer Market, By Distribution Channel, 2019-2030 (USD Billion)
15. Mexico Hard Seltzer Market, By ABV Content, 2019-2030 (USD Billion)
16. Mexico Hard Seltzer Market, By Distribution Channel, 2019-2030 (USD Billion)
17. Europe Hard Seltzer Market, By ABV Content, 2019-2030 (USD Billion)
18. Europe Hard Seltzer Market, By Distribution Channel, 2019-2030 (USD Billion)
19. Germany Hard Seltzer Market, By ABV Content, 2019-2030 (USD Billion)
20. Germany Hard Seltzer Market, By Distribution Channel, 2019-2030 (USD Billion)
21. France Hard Seltzer Market, By ABV Content, 2019-2030 (USD Billion)
22. France Hard Seltzer Market, By Distribution Channel, 2019-2030 (USD Billion)
23. U.K. Hard Seltzer Market, By ABV Content, 2019-2030 (USD Billion)
24. U.K. Hard Seltzer Market, By Distribution Channel, 2019-2030 (USD Billion)
25. Italy Hard Seltzer Market, By ABV Content, 2019-2030 (USD Billion)
26. Italy Hard Seltzer Market, By Distribution Channel, 2019-2030 (USD Billion)
27. Spain Hard Seltzer Market, By ABV Content, 2019-2030 (USD Billion)
28. Spain Hard Seltzer Market, By Distribution Channel, 2019-2030 (USD Billion)
29. Asia Pacific Hard Seltzer Market, By ABV Content, 2019-2030 (USD Billion)
30. Asia Pacific Hard Seltzer Market, By Distribution Channel, 2019-2030 (USD Billion)
31. Japan Hard Seltzer Market, By ABV Content, 2019-2030 (USD Billion)
32. Japan Hard Seltzer Market, By Distribution Channel, 2019-2030 (USD Billion)
33. China Hard Seltzer Market, By ABV Content, 2019-2030 (USD Billion)
34. China Hard Seltzer Market, By Distribution Channel, 2019-2030 (USD Billion)
35. India Hard Seltzer Market, By ABV Content, 2019-2030 (USD Billion)
36. India Hard Seltzer Market, By Distribution Channel, 2019-2030 (USD Billion)
37. South America Hard Seltzer Market, By ABV Content, 2019-2030 (USD Billion)
38. South America Hard Seltzer Market, By Distribution Channel, 2019-2030 (USD Billion)
39. Brazil Hard Seltzer Market, By ABV Content, 2019-2030 (USD Billion)
40. Brazil Hard Seltzer Market, By Distribution Channel, 2019-2030 (USD Billion)
41. Middle East and Africa Hard Seltzer Market, By ABV Content, 2019-2030 (USD Billion)
42. Middle East and Africa Hard Seltzer Market, By Distribution Channel, 2019-2030 (USD Billion)
43. UAE Hard Seltzer Market, By ABV Content, 2019-2030 (USD Billion)
44. UAE Hard Seltzer Market, By Distribution Channel, 2019-2030 (USD Billion)
45. South Africa Hard Seltzer Market, By ABV Content, 2019-2030 (USD Billion)
46. South Africa Hard Seltzer Market, By Distribution Channel, 2019-2030 (USD Billion)
List of Figures
1. Global Hard Seltzer Market Segmentation
2. Hard Seltzer Market: Research Methodology
3. Market Size Estimation Methodology: Bottom-Up Approach
4. Market Size Estimation Methodology: Top-Down Approach
5. Data Triangulation
6. Porter’s Five Forces Analysis
7. Value Chain Analysis
8. Global Hard Seltzer Market Attractiveness Analysis by ABV Content
9. Global Hard Seltzer Market Attractiveness Analysis by Distribution Channel
10. Global Hard Seltzer Market Attractiveness Analysis by Region
11. Global Hard Seltzer Market: Dynamics
12. Global Hard Seltzer Market Share by ABV Content (2022 & 2030)
13. Global Hard Seltzer Market Share by Distribution Channel (2022 & 2030)
14. Global Hard Seltzer Market Share by Regions (2022 & 2030)
15. Global Hard Seltzer Market Share by Company (2021)
Segments Covered in the Report
Research has its special purpose to undertake marketing efficiently. In this competitive scenario, businesses need information across all industry verticals; the information about customer wants, market demand, competition, industry trends, distribution channels etc. This information needs to be updated regularly because businesses operate in a dynamic environment. Our organization, The Brainy Insights incorporates scientific and systematic research procedures in order to get proper market insights and industry analysis for overall business success. The analysis consists of studying the market from a miniscule level wherein we implement statistical tools which helps us in examining the data with accuracy and precision.
Our research reports feature both; quantitative and qualitative aspects for any market. Qualitative information for any market research process are fundamental because they reveal the customer needs and wants, usage and consumption for any product/service related to a specific industry. This in turn aids the marketers/investors in knowing certain perceptions of the customers. Qualitative research can enlighten about the different product concepts and designs along with unique service offering that in turn, helps define marketing problems and generate opportunities. On the other hand, quantitative research engages with the data collection process through interviews, e-mail interactions, surveys and pilot studies. Quantitative aspects for the market research are useful to validate the hypotheses generated during qualitative research method, explore empirical patterns in the data with the help of statistical tools, and finally make the market estimations.
The Brainy Insights offers comprehensive research and analysis, based on a wide assortment of factual insights gained through interviews with CXOs and global experts and secondary data from reliable sources. Our analysts and industry specialist assume vital roles in building up statistical tools and analysis models, which are used to analyse the data and arrive at accurate insights with exceedingly informative research discoveries. The data provided by our organization have proven precious to a diverse range of companies, facilitating them to address issues such as determining which products/services are the most appealing, whether or not customers use the product in the manner anticipated, the purchasing intentions of the market and many others.
Our research methodology encompasses an idyllic combination of primary and secondary initiatives. Key phases involved in this process are listed below:

The phase involves the gathering and collecting of market data and its related information with the help of different sources & research procedures.

The data procurement stage involves in data gathering and collecting through various data sources.
This stage involves in extensive research. These data sources includes:
Purchased Database: Purchased databases play a crucial role in estimating the market sizes irrespective of the domain. Our purchased database includes:
Primary Research: The Brainy Insights interacts with leading companies and experts of the concerned domain to develop the analyst team’s market understanding and expertise. It improves and substantiates every single data presented in the market reports. Primary research mainly involves in telephonic interviews, E-mail interactions and face-to-face interviews with the raw material providers, manufacturers/producers, distributors, & independent consultants. The interviews that we conduct provides valuable data on market size and industry growth trends prevailing in the market. Our organization also conducts surveys with the various industry experts in order to gain overall insights of the industry/market. For instance, in healthcare industry we conduct surveys with the pharmacists, doctors, surgeons and nurses in order to gain insights and key information of a medical product/device/equipment which the customers are going to usage. Surveys are conducted in the form of questionnaire designed by our own analyst team. Surveys plays an important role in primary research because surveys helps us to identify the key target audiences of the market. Additionally, surveys helps to identify the key target audience engaged with the market. Our survey team conducts the survey by targeting the key audience, thus gaining insights from them. Based on the perspectives of the customers, this information is utilized to formulate market strategies. Moreover, market surveys helps us to understand the current competitive situation of the industry. To be precise, our survey process typically involve with the 360 analysis of the market. This analytical process begins by identifying the prospective customers for a product or service related to the market/industry to obtain data on how a product/service could fit into customers’ lives.

Secondary Research: The secondary data sources includes information published by the on-profit organizations such as World bank, WHO, company fillings, investor presentations, annual reports, national government documents, statistical databases, blogs, articles, white papers and others. From the annual report, we analyse a company’s revenue to understand the key segment and market share of that organization in a particular region. We analyse the company websites and adopt the product mapping technique which is important for deriving the segment revenue. In the product mapping method, we select and categorize the products offered by the companies catering to domain specific market, deduce the product revenue for each of the companies so as to get overall estimation of the market size. We also source data and analyses trends based on information received from supply side and demand side intermediaries in the value chain. The supply side denotes the data gathered from supplier, distributor, wholesaler and the demand side illustrates the data gathered from the end customers for respective market domain.

The supply side for a domain specific market is analysed by:
The demand side for the market is estimated through:
In-house Library: Apart from these third-party sources, we have our in-house library of qualitative and quantitative information. Our in-house database includes market data for various industry and domains. These data are updated on regular basis as per the changing market scenario. Our library includes, historic databases, internal audit reports and archives.
Sometimes there are instances where there is no metadata or raw data available for any domain specific market. For those cases, we use our expertise to forecast and estimate the market size in order to generate comprehensive data sets. Our analyst team adopt a robust research technique in order to produce the estimates:
Data Synthesis: This stage involves the analysis & mapping of all the information obtained from the previous step. It also involves in scrutinizing the data for any discrepancy observed while data gathering related to the market. The data is collected with consideration to the heterogeneity of sources. Robust scientific techniques are in place for synthesizing disparate data sets and provide the essential contextual information that can orient market strategies. The Brainy Insights has extensive experience in data synthesis where the data passes through various stages:


Market Deduction & Formulation: The final stage comprises of assigning data points at appropriate market spaces so as to deduce feasible conclusions. Analyst perspective & subject matter expert based holistic form of market sizing coupled with industry analysis also plays a crucial role in this stage.
This stage involves in finalization of the market size and numbers that we have collected from data integration step. With data interpolation, it is made sure that there is no gap in the market data. Successful trend analysis is done by our analysts using extrapolation techniques, which provide the best possible forecasts for the market.
Data Validation & Market Feedback: Validation is the most important step in the process. Validation & re-validation via an intricately designed process helps us finalize data-points to be used for final calculations.

The Brainy Insights interacts with leading companies and experts of the concerned domain to develop the analyst team’s market understanding and expertise. It improves and substantiates every single data presented in the market reports. The data validation interview and discussion panels are typically composed of the most experienced industry members. The participants include, however, are not limited to:
Moreover, we always validate our data and findings through primary respondents from all the major regions we are working on.


Free Customization
Fortune 500 Clients
Free Yearly Update On Purchase Of Multi/Corporate License
Companies Served Till Date