- +1-315-215-1633
- sales@thebrainyinsights.com

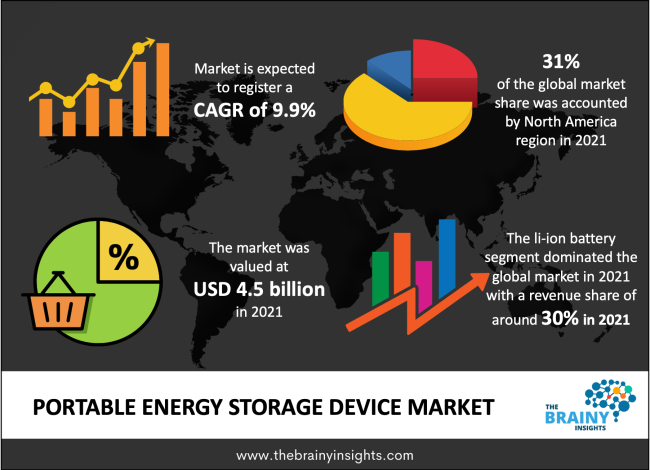
The Portable Energy Storage Device market was estimated at around 4.5 billion in 2021, growing at a CAGR of nearly 9.9% during 2022-2030. The market is projected to reach approximately USD 12.5 billion by 2030.
The market for mobile energy storage systems has grown significantly since its peak in 2020, and it is anticipated to post a sizable revenue CAGR throughout the projected period. Globally increasing importance of renewable energy sources is a major element propelling market revenue development. Additionally, government spending on the delivery of energy to rural areas is anticipated to boost market growth. The battery system is integrated with the EMS, BMS, and a transportation platform in a mobile energy storage system. According to standards ranging from 0.2 MWh to 1 Mwh, it is scaleable. It is frequently used in field exploration, power insurance, rescue and relief operations, key operations, military leadership, and emergency communication.
Get an overview of this study by requesting a free sample
Nearly every business across the world was affected by the COVID-19 epidemic, including that of mobile energy storage systems. As a result of COVID-19, which is limiting the supply of batteries and other components as well as adoption, the forecasted growth of several application sectors of the market is expected to decline due to significant disruptions in businesses and the global economy. The current situation has affected the supply chain for the energy industry, particularly for battery energy storage systems and renewable energy technology. The manufacturing and supply chain were disrupted as a result of strict government requirements and laws including social distance and employee reductions by a specific percentage, which ultimately had a negative effect on the sector.
Growing popularity to accelerate the market’s growth
Over the forecast period, market growth is anticipated to be fueled by the rising popularity of mobile energy storage systems to satisfy the rising demand for energy and key benefits of the product. Mobile energy storage, for instance, can boost the effectiveness of diesel generators and offer additional power generation, short-term or seasonal contracts, energy storage services, and backup power to places vulnerable to storms. Mobile energy storage technologies are in demand as worldwide public awareness of greenhouse gases rises. Typically, these devices are used to store renewable energy. Therefore, it is anticipated that throughout the course of the forecast period, technological advancements in the direction of renewable energy generation will drive market expansion for mobile energy storage.
Decentralized power generation technology, which is the foundation of mobile energy, is an affordable, dependable, and practical alternative for the generation and distribution of energy in the future. These systems are strong, adaptable, modular, and dependable sources of electric capacity that help with a wide range of electricity-related services. Over the course of the projection period, these variables are anticipated to significantly support market expansion.
Based on type, the mobile energy storage system market is segmented into li-ion battery, sodium-based battery, lead-acid battery, and others. The li-ion battery segment accounted for largest share in the global market in 2021. In 2010, the price of lithium-ion batteries was approximately US$ 1,160 per KWh. Since then, the price has been going down. In 2020, the cost was approximately US$ 130 per KWh. As businesses engage more in R&D to make batteries more affordable, it is anticipated that the price of lithium-ion batteries will soon drop even more. Thus, during the projection period, market participants may benefit financially from the increased focus on R&D of energy-efficient lithium-ion batteries. Based on application, the mobile energy storage system market is segmented into residential, commercial, industrial, and others. The residential segment is expected to register high growth owing to rapid urbanization in developing countries.
In 2021, North America dominated the market for mobile energy storage systems globally. Throughout the predicted period, it is anticipated that this tendency would persist. North America is predicted to have a 34% market share by 2031, up from its expected 30% share in 2021. In 2021, Asia Pacific accounted for 29% of the market. By 2031, it's expected to control 31% of the global market. During the projection period, it is anticipated that the mobile ESS market in Latin America, the Middle East, and Africa would expand slowly. In 2021, Middle East & Africa and Latin America collectively owned 18% of the market share. By 2031, these areas would likely collectively lose market share and make up 16% of the worldwide market.
The global Portable Energy Storage Device market is segmented as follows:
By Type
By Application
By Region/Geography
| Attribute | Description |
|---|---|
| Base Year | 2021 |
| Forecast period | 2022-2030 |
| Report Coverage | Revenue estimation and forecast, company profile, competitive landscape, growth factors, and recent trends |
| Regional scope | North America, Europe, Asia Pacific, Middle East & Africa, and Latin America |
| Market Size(unit) | USD Billion |
| CAGR (2022 to 2030) | 9.9% |
| Segments Covered |
By Type |
1. Introduction
1.1. Objectives of the Study
1.2. Market Definition
1.3. Research Scope
2. Research Methodology and Assumptions
3. Executive Summary
4. Premium Insights
4.1. Porter’s Five Forces Analysis
4.2. Value Chain Analysis
4.3. Top Investment Pockets
4.3.1. Market Attractiveness Analysis By Type
4.3.2. Market Attractiveness Analysis By Application
4.4. Industry Trends
5. Market Dynamics
5.1. Market Evaluation
5.2. Drivers
5.2.1. Growing popularity to accelerate the market’s growth
5.3. Restrains
5.3.1. Availability of substitute materials would hamper the market
5.4. Opportunities
5.4.1. Growing market
6. Global Portable Energy Storage Device Market Analysis and Forecast, By Type
6.1. Segment Overview
6.2. li-ion battery
6.3. Sodium-based battery
6.4. Lead-acid battery
6.5. Others
7. Global Portable Energy Storage Device Market Analysis and Forecast, By Application
7.1. Segment Overview
7.2. Residential
7.3. Commercial
7.4. Industrial
8. Global Portable Energy Storage Device Market Analysis and Forecast, By Regional Analysis
8.1. Segment Overview
8.2. North America
8.2.1. U.S.
8.2.2. Canada
8.2.3. Mexico
8.3. Europe
8.3.1. Germany
8.3.2. France
8.3.3. U.K.
8.3.4. Italy
8.3.5. Spain
8.3.6. Rest of Europe
8.4. Asia-Pacific
8.4.1. Japan
8.4.2. China
8.4.3. India
8.4.4. Australia
8.4.5. South Korea
8.4.6. Rest of Asia-Pacific
8.5. South America
8.5.1. Brazil
8.5.2. Argentina
8.5.3. Rest of South America
8.6. Middle East and Africa
8.6.1. UAE
8.6.2. South Africa
8.6.3. Egypt
8.6.4. Kuwait
8.6.5. Saudi Arabia
8.6.6. Rest of Middle East & Africa
9. Global Portable Energy Storage Device Market-Competitive Landscape
9.1. Overview
9.2. Market Share of Key Players in the Portable Energy Storage Device market
9.2.1. Global Company Market Share
9.2.2. North America Company Market Share
9.2.3. Europe Company Market Share
9.2.4. APAC Company Market Share
9.3. Competitive Situations and Trends
9.3.1. Type Launches and Developments
9.3.2. Partnerships, Collaborations, and Agreements
9.3.3. Mergers & Acquisitions
9.3.4. Expansions
10. Company Profiles
10.1. Aquion Energy
10.1.1. Business Overview
10.1.2. Company Snapshot
10.1.3. Company Market Share Analysis
10.1.4. Company Application Portfolio
10.1.5. Recent Developments
10.1.6. SWOT Analysis
10.2. Green Charge
10.2.1. Business Overview
10.2.2. Company Snapshot
10.2.3. Company Market Share Analysis
10.2.4. Company Application Portfolio
10.2.5. Recent Developments
10.2.6. SWOT Analysis
10.3. LG Chem
10.3.1. Business Overview
10.3.2. Company Snapshot
10.3.3. Company Market Share Analysis
10.3.4. Company Application Portfolio
10.3.5. Recent Developments
10.3.6. SWOT Analysis
10.4. Panasonic
10.4.1. Business Overview
10.4.2. Company Snapshot
10.4.3. Company Market Share Analysis
10.4.4. Company Application Portfolio
10.4.5. Recent Developments
10.4.6. SWOT Analysis
10.5. NEC Energy Solutions
10.5.1. Business Overview
10.5.2. Company Snapshot
10.5.3. Company Market Share Analysis
10.5.4. Company Application Portfolio
10.5.5. Recent Developments
10.5.6. SWOT Analysis
10.6. JSR Corporation
10.6.1. Business Overview
10.6.2. Company Snapshot
10.6.3. Company Market Share Analysis
10.6.4. Company Application Portfolio
10.6.5. Recent Developments
10.6.6. SWOT Analysis
10.7. NRG Energy
10.7.1. Business Overview
10.7.2. Company Snapshot
10.7.3. Company Market Share Analysis
10.7.4. Company Application Portfolio
10.7.5. Recent Developments
10.7.6. SWOT Analysis
10.8. Amperex Technology
10.8.1. Business Overview
10.8.2. Company Snapshot
10.8.3. Company Market Share Analysis
10.8.4. Company Application Portfolio
10.8.5. Recent Developments
10.8.6. SWOT Analysis
10.9. Boston Power
10.9.1. Business Overview
10.9.2. Company Snapshot
10.9.3. Company Market Share Analysis
10.9.4. Company Application Portfolio
10.9.5. Recent Developments
10.9.6. SWOT Analysis
10.10. Power Edison
10.10.1. Business Overview
10.10.2. Company Snapshot
10.10.3. Company Market Share Analysis
10.10.4. Company Application Portfolio
10.10.5. Recent Developments
10.10.6. SWOT Analysis
List of Table
1. Global Portable Energy Storage Device Market, By Type, 2022-2030(USD Billion)
2. Global li-ion Battery Portable Energy Storage Device Market, By Region, 2022-2030(USD Billion)
3. Global Sodium-Based Battery Portable Energy Storage Device Market, By Region, 2022-2030(USD Billion)
4. Global Lead-Acid Battery Portable Energy Storage Device Market, By Region, 2022-2030(USD Billion)
5. Global Others Portable Energy Storage Device Market, By Region, 2022-2030(USD Billion)
6. Global Portable Energy Storage Device Market, By Application, 2022-2030(USD Billion)
7. Global Commercial Portable Energy Storage Device Market, By Region, 2022-2030(USD Billion)
8. Global Residential Portable Energy Storage Device Market, By Region, 2022-2030(USD Billion)
9. Global Industrial Portable Energy Storage Device Market, By Region, 2022-2030(USD Billion)
10. Global Portable Energy Storage Device Market, By Region, 2022-2030(USD Billion)
11. Global Portable Energy Storage Device Market, By North America, 2022-2030(USD Billion)
12. North America Portable Energy Storage Device Market, By Type, 2022-2030(USD Billion)
13. North America Portable Energy Storage Device Market, By Application, 2022-2030(USD Billion)
14. U.S. Portable Energy Storage Device Market, By Type, 2022-2030(USD Billion)
15. U.S. Portable Energy Storage Device Market, By Application, 2022-2030(USD Billion)
16. Canada Portable Energy Storage Device Market, By Type, 2022-2030(USD Billion)
17. Canada Portable Energy Storage Device Market, By Application, 2022-2030(USD Billion)
18. Mexico Portable Energy Storage Device Market, By Type, 2022-2030(USD Billion)
19. Mexico Portable Energy Storage Device Market, By Application, 2022-2030(USD Billion)
20. Europe Portable Energy Storage Device Market, By Type, 2022-2030(USD Billion)
21. Europe Portable Energy Storage Device Market, By Application, 2022-2030(USD Billion)
22. Germany Portable Energy Storage Device Market, By Type, 2022-2030(USD Billion)
23. Germany Portable Energy Storage Device Market, By Application, 2022-2030(USD Billion)
24. France Portable Energy Storage Device Market, By Type, 2022-2030(USD Billion)
25. France Portable Energy Storage Device Market, By Application, 2022-2030(USD Billion)
26. U.K. Portable Energy Storage Device Market, By Type, 2022-2030(USD Billion)
27. U.K. Portable Energy Storage Device Market, By Application, 2022-2030(USD Billion)
28. Italy Portable Energy Storage Device Market, By Type, 2022-2030(USD Billion)
29. Italy Portable Energy Storage Device Market, By Application, 2022-2030(USD Billion)
30. Spain Portable Energy Storage Device Market, By Type, 2022-2030(USD Billion)
31. Spain Portable Energy Storage Device Market, By Application, 2022-2030(USD Billion)
32. Rest of Europe Portable Energy Storage Device Market, By Type, 2022-2030(USD Billion)
33. Rest of Europe Portable Energy Storage Device Market, By Application, 2022-2030(USD Billion)
34. Asia Pacific Portable Energy Storage Device Market, By Type, 2022-2030(USD Billion)
35. Asia Pacific Portable Energy Storage Device Market, By Application, 2022-2030(USD Billion)
36. Japan Portable Energy Storage Device Market, By Type, 2022-2030(USD Billion)
37. Japan Portable Energy Storage Device Market, By Application, 2022-2030(USD Billion)
38. China Portable Energy Storage Device Market, By Type, 2022-2030(USD Billion)
39. China Portable Energy Storage Device Market, By Application, 2022-2030(USD Billion)
40. India Portable Energy Storage Device Market, By Type, 2022-2030(USD Billion)
41. India Portable Energy Storage Device Market, By Application, 2022-2030(USD Billion)
42. Australia Portable Energy Storage Device Market, By Type, 2022-2030(USD Billion)
43. Australia Portable Energy Storage Device Market, By Application, 2022-2030(USD Billion)
44. South Korea Portable Energy Storage Device Market, By Type, 2022-2030(USD Billion)
45. South Korea Portable Energy Storage Device Market, By Application, 2022-2030(USD Billion)
46. Rest of Asia-Pacific Portable Energy Storage Device Market, By Type, 2022-2030(USD Billion)
47. Rest of Asia-Pacific Portable Energy Storage Device Market, By Application, 2022-2030(USD Billion)
48. South America Portable Energy Storage Device Market, By Type, 2022-2030(USD Billion)
49. South America Portable Energy Storage Device Market, By Application, 2022-2030(USD Billion)
50. Brazil Portable Energy Storage Device Market, By Type, 2022-2030(USD Billion)
51. Brazil Portable Energy Storage Device Market, By Application, 2022-2030(USD Billion)
52. Argentina Portable Energy Storage Device Market, By Type, 2022-2030(USD Billion)
53. Argentina Portable Energy Storage Device Market, By Application, 2022-2030(USD Billion)
54. Rest of Latin America Portable Energy Storage Device Market, By Type, 2022-2030(USD Billion)
55. Rest of Latin America Portable Energy Storage Device Market, By Application, 2022-2030(USD Billion)
56. Middle East and Africa Portable Energy Storage Device Market, By Type, 2022-2030(USD Billion)
57. Middle East and Africa Portable Energy Storage Device Market, By Application, 2022-2030(USD Billion)
58. UAE Portable Energy Storage Device Market, By Type, 2022-2030(USD Billion)
59. UAE Portable Energy Storage Device Market, By Application, 2022-2030(USD Billion)
60. South Africa Portable Energy Storage Device Market, By Type, 2022-2030(USD Billion)
61. South Africa Portable Energy Storage Device Market, By Application, 2022-2030(USD Billion)
62. Egypt Portable Energy Storage Device Market, By Type, 2022-2030(USD Billion)
63. Egypt Portable Energy Storage Device Market, By Application, 2022-2030(USD Billion)
64. Kuwait Portable Energy Storage Device Market, By Type, 2022-2030(USD Billion)
65. Kuwait Portable Energy Storage Device Market, By Application, 2022-2030(USD Billion)
66. Saudi Arabia Portable Energy Storage Device Market, By Type, 2022-2030(USD Billion)
67. Saudi Arabia Portable Energy Storage Device Market, By Application, 2022-2030(USD Billion)
68. Rest of Middle East Portable Energy Storage Device Market, By Type, 2022-2030(USD Billion)
69. Rest of Middle East Portable Energy Storage Device Market, By Application, 2022-2030(USD Billion)
List of Figures
1. Global Portable Energy Storage Device Market Segmentation
2. Portable Energy Storage Device Market: Research Methodology
3. Market Size Estimation Methodology: Bottom-Up Approach
4. Market Size Estimation Methodology: Top-Down Approach
5. Data Triangulation
6. Porter’s Five Forces Analysis
7. Value Chain Analysis
8. Global Portable Energy Storage Device Market Attractiveness Analysis By Type
9. Global Portable Energy Storage Device Market Attractiveness Analysis By Application
10. Global Portable Energy Storage Device Market Attractiveness Analysis By Region
11. Global Portable Energy Storage Device Market: Dynamics
12. Global Portable Energy Storage Device Market Share By Type(2022 & 2030)
13. Global Portable Energy Storage Device Market Share By Application(2022 & 2030)
14. Global Portable Energy Storage Device Market Share by Regions (2022 & 2030)
15. Global Portable Energy Storage Device Market Share by Company (2021)
By Type
By Application
By Region/Geography
Research has its special purpose to undertake marketing efficiently. In this competitive scenario, businesses need information across all industry verticals; the information about customer wants, market demand, competition, industry trends, distribution channels etc. This information needs to be updated regularly because businesses operate in a dynamic environment. Our organization, The Brainy Insights incorporates scientific and systematic research procedures in order to get proper market insights and industry analysis for overall business success. The analysis consists of studying the market from a miniscule level wherein we implement statistical tools which helps us in examining the data with accuracy and precision.
Our research reports feature both; quantitative and qualitative aspects for any market. Qualitative information for any market research process are fundamental because they reveal the customer needs and wants, usage and consumption for any product/service related to a specific industry. This in turn aids the marketers/investors in knowing certain perceptions of the customers. Qualitative research can enlighten about the different product concepts and designs along with unique service offering that in turn, helps define marketing problems and generate opportunities. On the other hand, quantitative research engages with the data collection process through interviews, e-mail interactions, surveys and pilot studies. Quantitative aspects for the market research are useful to validate the hypotheses generated during qualitative research method, explore empirical patterns in the data with the help of statistical tools, and finally make the market estimations.
The Brainy Insights offers comprehensive research and analysis, based on a wide assortment of factual insights gained through interviews with CXOs and global experts and secondary data from reliable sources. Our analysts and industry specialist assume vital roles in building up statistical tools and analysis models, which are used to analyse the data and arrive at accurate insights with exceedingly informative research discoveries. The data provided by our organization have proven precious to a diverse range of companies, facilitating them to address issues such as determining which products/services are the most appealing, whether or not customers use the product in the manner anticipated, the purchasing intentions of the market and many others.
Our research methodology encompasses an idyllic combination of primary and secondary initiatives. Key phases involved in this process are listed below:

The phase involves the gathering and collecting of market data and its related information with the help of different sources & research procedures.

The data procurement stage involves in data gathering and collecting through various data sources.
This stage involves in extensive research. These data sources includes:
Purchased Database: Purchased databases play a crucial role in estimating the market sizes irrespective of the domain. Our purchased database includes:
Primary Research: The Brainy Insights interacts with leading companies and experts of the concerned domain to develop the analyst team’s market understanding and expertise. It improves and substantiates every single data presented in the market reports. Primary research mainly involves in telephonic interviews, E-mail interactions and face-to-face interviews with the raw material providers, manufacturers/producers, distributors, & independent consultants. The interviews that we conduct provides valuable data on market size and industry growth trends prevailing in the market. Our organization also conducts surveys with the various industry experts in order to gain overall insights of the industry/market. For instance, in healthcare industry we conduct surveys with the pharmacists, doctors, surgeons and nurses in order to gain insights and key information of a medical product/device/equipment which the customers are going to usage. Surveys are conducted in the form of questionnaire designed by our own analyst team. Surveys plays an important role in primary research because surveys helps us to identify the key target audiences of the market. Additionally, surveys helps to identify the key target audience engaged with the market. Our survey team conducts the survey by targeting the key audience, thus gaining insights from them. Based on the perspectives of the customers, this information is utilized to formulate market strategies. Moreover, market surveys helps us to understand the current competitive situation of the industry. To be precise, our survey process typically involve with the 360 analysis of the market. This analytical process begins by identifying the prospective customers for a product or service related to the market/industry to obtain data on how a product/service could fit into customers’ lives.

Secondary Research: The secondary data sources includes information published by the on-profit organizations such as World bank, WHO, company fillings, investor presentations, annual reports, national government documents, statistical databases, blogs, articles, white papers and others. From the annual report, we analyse a company’s revenue to understand the key segment and market share of that organization in a particular region. We analyse the company websites and adopt the product mapping technique which is important for deriving the segment revenue. In the product mapping method, we select and categorize the products offered by the companies catering to domain specific market, deduce the product revenue for each of the companies so as to get overall estimation of the market size. We also source data and analyses trends based on information received from supply side and demand side intermediaries in the value chain. The supply side denotes the data gathered from supplier, distributor, wholesaler and the demand side illustrates the data gathered from the end customers for respective market domain.

The supply side for a domain specific market is analysed by:
The demand side for the market is estimated through:
In-house Library: Apart from these third-party sources, we have our in-house library of qualitative and quantitative information. Our in-house database includes market data for various industry and domains. These data are updated on regular basis as per the changing market scenario. Our library includes, historic databases, internal audit reports and archives.
Sometimes there are instances where there is no metadata or raw data available for any domain specific market. For those cases, we use our expertise to forecast and estimate the market size in order to generate comprehensive data sets. Our analyst team adopt a robust research technique in order to produce the estimates:
Data Synthesis: This stage involves the analysis & mapping of all the information obtained from the previous step. It also involves in scrutinizing the data for any discrepancy observed while data gathering related to the market. The data is collected with consideration to the heterogeneity of sources. Robust scientific techniques are in place for synthesizing disparate data sets and provide the essential contextual information that can orient market strategies. The Brainy Insights has extensive experience in data synthesis where the data passes through various stages:


Market Deduction & Formulation: The final stage comprises of assigning data points at appropriate market spaces so as to deduce feasible conclusions. Analyst perspective & subject matter expert based holistic form of market sizing coupled with industry analysis also plays a crucial role in this stage.
This stage involves in finalization of the market size and numbers that we have collected from data integration step. With data interpolation, it is made sure that there is no gap in the market data. Successful trend analysis is done by our analysts using extrapolation techniques, which provide the best possible forecasts for the market.
Data Validation & Market Feedback: Validation is the most important step in the process. Validation & re-validation via an intricately designed process helps us finalize data-points to be used for final calculations.

The Brainy Insights interacts with leading companies and experts of the concerned domain to develop the analyst team’s market understanding and expertise. It improves and substantiates every single data presented in the market reports. The data validation interview and discussion panels are typically composed of the most experienced industry members. The participants include, however, are not limited to:
Moreover, we always validate our data and findings through primary respondents from all the major regions we are working on.


Free Customization
Fortune 500 Clients
Free Yearly Update On Purchase Of Multi/Corporate License
Companies Served Till Date