- +1-315-215-1633
- sales@thebrainyinsights.com

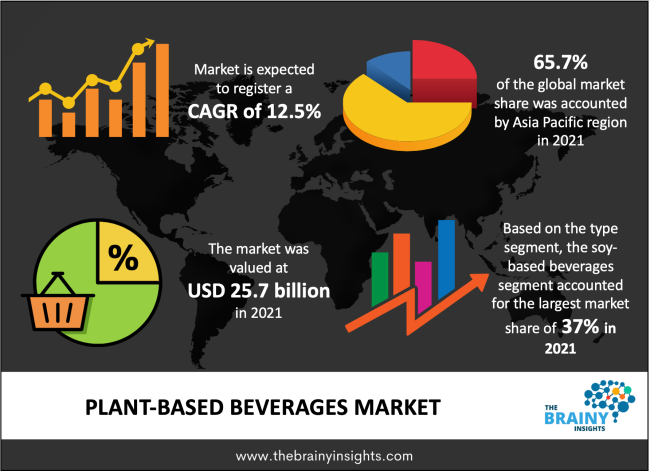
The plant-based beverages market size was valued at USD 25.7 billion in 2021 and is anticipated to grow with a CAGR of 12.5% from 2022 to 2030. The growing trend of veganism and rising acceptance of plant-based diets among consumers is a major factors contributing to the growth of the market. With increasing awareness about global warming, animal cruelty, and long-term sustainability, people across the world have been restricting their consumption of all animal-based products, including meat, eggs, milk, butter, cheese, etc.
Increasing health concerns among millennials have also compelled them to shift towards vegan foods and beverages. Moreover, the vegan population has been increasing owing to the rising prevalence of lactose intolerance and lactose malabsorption. According to the U.S Department of Health and Human Services, around 68% of the world’s population has lactose malabsorption, making them more susceptible to lactose intolerance.
The plant-based beverages milk such as soy, almond, and oat are being widely consumed across the globe. While soy milk is more consumed in Asian countries, oat and almond milk are popular in American and European countries. All these milk are rich in vitamins and minerals that support bone and muscle health. These are also rich in healthy fatty acids, making them suitable for a health-conscious person.
Get an overview of this study by requesting a free sample
Plant-based beverages are sold worldwide through various distribution channels and manufacturers rely heavily on both, online and offline channels. Popular brick-and-mortar stores are opted for by most manufacturers to reach a wider audience; these include Walmart, Aldi, Carrefour, Lidl, and Tesco. According to the National Dairy Council report 2022, 98% of stores in the US sold lactose-free milk in 2021.
The high cost of vegan food & beverages in comparison to conventional products especially for people in some of the low-income regions including Africa and some parts of Asia is expected to limit the growth of the market. As the production costs of these beverages are quite high, the finished products tend to be expensive. These market trends are posing major challenges for plant-based beverage manufacturers.
By type, the market has been segmented into soy, coconut, almond, oats, cashew, and others. The soy-based beverages held the largest market share of around 37% in 2021. These drinks were initially adopted by consumers as a replacement for dairy-based beverages, particularly milk. However, now with improved taste, soy-based drinks are gaining momentum worldwide. Consumers from developed as well as developing countries are showing a willingness to pay a premium price for beverages with better nutritional benefits. With growing consumer demand for nutritional yet allergy-free drinks, soy-based beverages are expected to witness steady growth across the forecast period.
The coconut-based beverages are anticipated to register a faster CAGR of 13.2% during the forecast period as coconut-based drinks are extremely nutritious. Coconut-based drinks are becoming favorable as low-calorie rehydrating drinks. Due to its low calorific value, coconut water is increasingly being used in juices, to improve their nutritional profile. Moreover, the easy availability of coconuts in Asian countries is expected to provide huge opportunities to manufacturers in the coming years.
The rising advancement in the oats-processing facilities and growing commercialization of oat-based beverages are expected to drive the demand for this segment. Moreover, oat milk has replaced soy and almond to become a favorite among most vegan consumers. Some of the popular oat milk brands are Oatly, Everyday Value, Califia Farms, Chobani, Oatsome, and Silk. It is widely used to make coffee and smoothies by consumers.
Others include flax, hemp, and hazelnut-based beverages. Hemp-based beverages are a popular milk alternative to dairy-based as well as other traditional beverages. Compared to traditional dairy products, hemp milk has fewer calories and carbs. It is widely used in coffees, smoothies, and teas. Consumers are opting for hazelnut-based drinks as hazelnuts are rich in fiber, vitamin E, and omega-3 & 6 fatty acids. Moreover, it has a naturally sweet taste in comparison to other plant-based beverages.
Plain beverages held a larger market share of 58.7% in 2021. A majority of consumers prefer unflavored plant-based beverages, as it is mainly consumed as a direct replacement for dairy milk and used for making coffees, smoothies, and teas. Consumers prefer plain drinks to enjoy the subtle original taste of the source, from which the drinks are derived. For instance, hazelnut and oats-based drinks have a sweet natural taste while almonds & cashews have a nutty taste of their own.
Flavored plant-based beverages are anticipated to grow at a higher CAGR during the forecast period. An increasing number of developments and product launches of appealing flavors in the market is expected to drive segment growth over the forecast period. For instance, in May 2021, Naked launched the smoothie “Indulgent Protein” in two flavors, Chocolate Protein and Vanilla Protein. It has 30 grams of plant protein and is Non-GMO project certified, vegan, and with no preservatives.
Offline distribution channel held a larger market share in 2021. Most consumers buy plant-based beverages from offline stores such as Walmart, Carrefour, Tesco, Target, and Kroger. The presence of a wide range of brands and discount offers prompt people to shop through this channel. Further, the wide customer reach of big supermarkets & hypermarkets encourages manufacturers to make their products available on the shelf of these stores.
Online channel is anticipated to witness a higher CAGR during the forecast period from 2022-2030. Most consumers have switched to online grocery shopping, especially after the outbreak of the covid-19 pandemic. According to the Annual Retail Trade Survey (ARTS) 2020 release, e-commerce sales increased by 43% in 2020 in the US, rising from USD 571.2 billion in 2019 to USD 815.4 billion in 2020.
The Asia Pacific led the market with a share of 65.7% in 2021. The increasing vegan population in the region is likely to fuel the demand for plant-based beverages in the region. Moreover, the rising awareness of the benefits of vegan-based drinks, especially among millennials, and the increasing cases of lactose intolerance are projected to drive plant-based beverages. Additionally, product launches are also expected to bode well for regional growth. For instance, in April 2020, Asahi launched a soy-based drink, Green Calpis in South Korea. Similarly, in March 2022, Califia Farms launched three new plant milk -Original Oat Milk, Vanilla Oat Milk, and Unsweetened Almond Barista Blend in Australia.
Europe is expected to expand at the fastest CAGR of 13.8% during the forecast period. The rising acceptance of veganism and the increasing vegan population are driving market growth. Further, the growing adoption of vegan beverages, along with government support for plant-based beverage manufacturers, is expected to drive the market. Launches of exciting flavors by market players are also driving the demand for plant-based drinks. For instance, in September 2020, Nestlé launched a new variety of Nesquik in Europe. This ready-to-drink plant-based beverage combines oats, peas, and cocoa.
The market players in this consolidated market are adopting various strategies such as new product launches, partnerships, and expansion of product portfolios, to increase their market share in this highly competitive market.
Segments Covered in the Report
1. Introduction
1.1. Objectives of the Study
1.2. Market Definition
1.3. Research Scope
1.4. Currency
1.5. Key Target Audience
2. Research Methodology and Assumptions
3. Executive Summary
4. Premium Insights
4.1. Porter’s Five Forces Analysis
4.2. Value Chain Analysis
4.3. Top Investment Pockets
4.3.1. Market Attractiveness Analysis by Type
4.3.2. Market Attractiveness Analysis by Distribution Channel
4.3.3. Market Attractiveness Analysis by Flavor
4.3.4. Market Attractiveness Analysis by Region
4.4. Industry Trends
5. Market Dynamics
5.1. Market Evaluation
5.2. Drivers
5.2.1. Rising acceptance of plant-based diets among consumers
5.3. Restraints
5.3.1. High cost of vegan food & beverages
5.4. Opportunities
5.4.1. Rising vegan population
6. Global Plant-based Beverages Market Analysis and Forecast, By Type
6.1. Segment Overview
6.2. Soy
6.3. Almond
6.4. Coconut
6.5. Oats
6.6. Cashew
6.7. Others
7. Global Plant-based Beverages Market Analysis and Forecast, By Distribution Channel
7.1. Segment Overview
7.2. Online
7.3. Offline
8. Global Plant-based Beverages Market Analysis and Forecast, By Flavor
8.1. Segment Overview
8.2. Plain
8.3. Flavored
9. Global Plant-based Beverages Market Analysis and Forecast, By Regional Analysis
9.1. Segment Overview
9.2. North America
9.2.1. U.S.
9.2.2. Canada
9.2.3. Mexico
9.3. Europe
9.3.1. Germany
9.3.2. France
9.3.3. U.K.
9.3.4. Italy
9.3.5. Spain
9.4. Asia-Pacific
9.4.1. Japan
9.4.2. China
9.4.3. India
9.5. South America
9.5.1. Brazil
9.6. Middle East and Africa
9.6.1. UAE
9.6.2. South Africa
10. Global Plant-based Beverages Market-Competitive Landscape
10.1. Overview
10.2. Market Share of Key Players in the Plant-based Beverages Market
10.2.1. Global Company Market Share
10.2.2. North America Company Market Share
10.2.3. Europe Company Market Share
10.2.4. APAC Company Market Share
10.3. Competitive Situations and Trends
10.3.1. Product Launches and Developments
10.3.2. Partnerships, Collaborations, and Agreements
10.3.3. Mergers & Acquisitions
10.3.4. Expansions
11. Company Profiles
11.1. Danone
11.1.1. Business Overview
11.1.2. Company Snapshot
11.1.3. Company Market Share Analysis
11.1.4. Company Product Portfolio
11.1.5. Recent Developments
11.1.6. SWOT Analysis
11.2. Nestlé
11.2.1. Business Overview
11.2.2. Company Snapshot
11.2.3. Company Market Share Analysis
11.2.4. Company Product Portfolio
11.2.5. Recent Developments
11.2.6. SWOT Analysis
11.3. Vitasoy International Holdings Limited
11.3.1. Business Overview
11.3.2. Company Snapshot
11.3.3. Company Market Share Analysis
11.3.4. Company Product Portfolio
11.3.5. Recent Developments
11.3.6. SWOT Analysis
11.4. Harmless Harvest
11.4.1. Business Overview
11.4.2. Company Snapshot
11.4.3. Company Market Share Analysis
11.4.4. Company Product Portfolio
11.4.5. Recent Developments
11.4.6. SWOT Analysis
11.5. Califia Farms
11.5.1. Business Overview
11.5.2. Company Snapshot
11.5.3. Company Market Share Analysis
11.5.4. Company Product Portfolio
11.5.5. Recent Developments
11.5.6. SWOT Analysis
11.6. Freedom Foods Group Limited
11.6.1. Business Overview
11.6.2. Company Snapshot
11.6.3. Company Market Share Analysis
11.6.4. Company Product Portfolio
11.6.5. Recent Developments
11.6.6. SWOT Analysis
11.7. Campbell Soup Company
11.7.1. Business Overview
11.7.2. Company Snapshot
11.7.3. Company Market Share Analysis
11.7.4. Company Product Portfolio
11.7.5. Recent Developments
11.7.6. SWOT Analysis
11.8. Blue Diamond Growers, Inc.
11.8.1. Business Overview
11.8.2. Company Snapshot
11.8.3. Company Market Share Analysis
11.8.4. Company Product Portfolio
11.8.5. Recent Developments
11.8.6. SWOT Analysis
11.9. SunOpta
11.9.1. Business Overview
11.9.2. Company Snapshot
11.9.3. Company Market Share Analysis
11.9.4. Company Product Portfolio
11.9.5. Recent Developments
11.9.6. SWOT Analysis
11.10. The Hain Celestial Group
11.10.1. Business Overview
11.10.2. Company Snapshot
11.10.3. Company Market Share Analysis
11.10.4. Company Product Portfolio
11.10.5. Recent Developments
11.10.6. SWOT Analysis
List of Table
1. Global Plant-based Beverages Market, By Type, 2019-2030 (USD Billion)
2. Global Soy Plant-based Beverages Market, By Region, 2019-2030 (USD Billion)
3. Global Almond Plant-based Beverages Market, By Region, 2019-2030 (USD Billion)
4. Global Coconut Plant-based Beverages Market, By Region, 2019-2030 (USD Billion)
5. Global Oats Plant-based Beverages Market, By Region, 2019-2030 (USD Billion)
6. Global Cashew Plant-based Beverages Market, By Region, 2019-2030 (USD Billion)
7. Global Others Plant-based Beverages Market, By Region, 2019-2030 (USD Billion)
8. Global Plant-based Beverages Market, By Distribution Channel, 2019-2030 (USD Billion)
9. Global Online Plant-based Beverages Market, By Region, 2019-2030 (USD Billion)
10. Global Offline Plant-based Beverages Market, By Region, 2019-2030 (USD Billion)
11. Global Plant-based Beverages Market, By Flavor, 2019-2030 (USD Billion)
12. Global Plain Plant-based Beverages Market, By Region, 2019-2030 (USD Billion)
13. Global Flavored Plant-based Beverages Market, By Region, 2019-2030 (USD Billion)
14. Global Plant-based Beverages Market, By Region, 2019-2030 (USD Billion)
15. North America Plant-based Beverages Market, By Type, 2019-2030 (USD Billion)
16. North America Plant-based Beverages Market, By Distribution Channel, 2019-2030 (USD Billion)
17. North America Plant-based Beverages Market, By Flavor, 2019-2030 (USD Billion)
18. U.S. Plant-based Beverages Market, By Type, 2019-2030 (USD Billion)
19. U.S. Plant-based Beverages Market, By Distribution Channel, 2019-2030 (USD Billion)
20. U.S. Plant-based Beverages Market, By Flavor, 2019-2030 (USD Billion)
21. Canada Plant-based Beverages Market, By Type, 2019-2030 (USD Billion)
22. Canada Plant-based Beverages Market, By Distribution Channel, 2019-2030 (USD Billion)
23. Canada Plant-based Beverages Market, By Flavor, 2019-2030 (USD Billion)
24. Mexico Plant-based Beverages Market, By Type, 2019-2030 (USD Billion)
25. Mexico Plant-based Beverages Market, By Distribution Channel, 2019-2030 (USD Billion)
26. Mexico Plant-based Beverages Market, By Flavor, 2019-2030 (USD Billion)
27. Europe Plant-based Beverages Market, By Type, 2019-2030 (USD Billion)
28. Europe Plant-based Beverages Market, By Distribution Channel, 2019-2030 (USD Billion)
29. Europe Plant-based Beverages Market, By Flavor, 2019-2030 (USD Billion)
30. Germany Plant-based Beverages Market, By Type, 2019-2030 (USD Billion)
31. Germany Plant-based Beverages Market, By Distribution Channel, 2019-2030 (USD Billion)
32. Germany Plant-based Beverages Market, By Flavor, 2019-2030 (USD Billion)
33. France Plant-based Beverages Market, By Type, 2019-2030 (USD Billion)
34. France Plant-based Beverages Market, By Distribution Channel, 2019-2030 (USD Billion)
35. France Plant-based Beverages Market, By Flavor, 2019-2030 (USD Billion)
36. U.K. Plant-based Beverages Market, By Type, 2019-2030 (USD Billion)
37. U.K. Plant-based Beverages Market, By Distribution Channel, 2019-2030 (USD Billion)
38. U.K. Plant-based Beverages Market, By Flavor, 2019-2030 (USD Billion)
39. Italy Plant-based Beverages Market, By Type, 2019-2030 (USD Billion)
40. Italy Plant-based Beverages Market, By Distribution Channel, 2019-2030 (USD Billion)
41. Italy Plant-based Beverages Market, By Flavor, 2019-2030 (USD Billion)
42. Spain Plant-based Beverages Market, By Type, 2019-2030 (USD Billion)
43. Spain Plant-based Beverages Market, By Distribution Channel, 2019-2030 (USD Billion)
44. Spain Plant-based Beverages Market, By Flavor, 2019-2030 (USD Billion)
45. Asia Pacific Plant-based Beverages Market, By Type, 2019-2030 (USD Billion)
46. Asia Pacific Plant-based Beverages Market, By Distribution Channel, 2019-2030 (USD Billion)
47. Asia Pacific Plant-based Beverages Market, By Flavor, 2019-2030 (USD Billion)
48. Japan Plant-based Beverages Market, By Type, 2019-2030 (USD Billion)
49. Japan Plant-based Beverages Market, By Distribution Channel, 2019-2030 (USD Billion)
50. Japan Plant-based Beverages Market, By Flavor, 2019-2030 (USD Billion)
51. China Plant-based Beverages Market, By Type, 2019-2030 (USD Billion)
52. China Plant-based Beverages Market, By Distribution Channel, 2019-2030 (USD Billion)
53. China Plant-based Beverages Market, By Flavor, 2019-2030 (USD Billion)
54. India Plant-based Beverages Market, By Type, 2019-2030 (USD Billion)
55. India Plant-based Beverages Market, By Distribution Channel, 2019-2030 (USD Billion)
56. India Plant-based Beverages Market, By Flavor, 2019-2030 (USD Billion)
57. South America Plant-based Beverages Market, By Type, 2019-2030 (USD Billion)
58. South America Plant-based Beverages Market, By Distribution Channel, 2019-2030 (USD Billion)
59. South America Plant-based Beverages Market, By Flavor, 2019-2030 (USD Billion)
60. Brazil Plant-based Beverages Market, By Type, 2019-2030 (USD Billion)
61. Brazil Plant-based Beverages Market, By Distribution Channel, 2019-2030 (USD Billion)
62. Brazil Plant-based Beverages Market, By Flavor, 2019-2030 (USD Billion)
63. Middle East and Africa Plant-based Beverages Market, By Type, 2019-2030 (USD Billion)
64. Middle East and Africa Plant-based Beverages Market, By Distribution Channel, 2019-2030 (USD Billion)
65. Middle East and Africa Plant-based Beverages Market, By Flavor, 2019-2030 (USD Billion)
66. UAE Plant-based Beverages Market, By Type, 2019-2030 (USD Billion)
67. UAE Plant-based Beverages Market, By Distribution Channel, 2019-2030 (USD Billion)
68. UAE Plant-based Beverages Market, By Flavor, 2019-2030 (USD Billion)
69. South Africa Plant-based Beverages Market, By Type, 2019-2030 (USD Billion)
70. South Africa Plant-based Beverages Market, By Distribution Channel, 2019-2030 (USD Billion)
71. South Africa Plant-based Beverages Market, By Flavor, 2019-2030 (USD Billion)
List of Figures
1. Global Plant-based Beverages Market Segmentation
2. Plant-based Beverages Market: Research Methodology
3. Market Size Estimation Methodology: Bottom-Up Approach
4. Market Size Estimation Methodology: Top-Down Approach
5. Data Triangulation
6. Porter’s Five Forces Analysis
7. Value Chain Analysis
8. Global Plant-based Beverages Market Attractiveness Analysis by Type
9. Global Plant-based Beverages Market Attractiveness Analysis by Distribution Channel
10. Global Plant-based Beverages Market Attractiveness Analysis by Flavor
11. Global Plant-based Beverages Market Attractiveness Analysis by Region
12. Global Plant-based Beverages Market: Dynamics
13. Global Plant-based Beverages Market Share by Type (2022 & 2030)
14. Global Plant-based Beverages Market Share by Distribution Channel (2022 & 2030)
15. Global Plant-based Beverages Market Share by Flavor (2022 & 2030)
16. Global Plant-based Beverages Market Share by Regions (2022 & 2030)
17. Global Plant-based Beverages Market Share by Company (2021)
Segments Covered in the Report
Research has its special purpose to undertake marketing efficiently. In this competitive scenario, businesses need information across all industry verticals; the information about customer wants, market demand, competition, industry trends, distribution channels etc. This information needs to be updated regularly because businesses operate in a dynamic environment. Our organization, The Brainy Insights incorporates scientific and systematic research procedures in order to get proper market insights and industry analysis for overall business success. The analysis consists of studying the market from a miniscule level wherein we implement statistical tools which helps us in examining the data with accuracy and precision.
Our research reports feature both; quantitative and qualitative aspects for any market. Qualitative information for any market research process are fundamental because they reveal the customer needs and wants, usage and consumption for any product/service related to a specific industry. This in turn aids the marketers/investors in knowing certain perceptions of the customers. Qualitative research can enlighten about the different product concepts and designs along with unique service offering that in turn, helps define marketing problems and generate opportunities. On the other hand, quantitative research engages with the data collection process through interviews, e-mail interactions, surveys and pilot studies. Quantitative aspects for the market research are useful to validate the hypotheses generated during qualitative research method, explore empirical patterns in the data with the help of statistical tools, and finally make the market estimations.
The Brainy Insights offers comprehensive research and analysis, based on a wide assortment of factual insights gained through interviews with CXOs and global experts and secondary data from reliable sources. Our analysts and industry specialist assume vital roles in building up statistical tools and analysis models, which are used to analyse the data and arrive at accurate insights with exceedingly informative research discoveries. The data provided by our organization have proven precious to a diverse range of companies, facilitating them to address issues such as determining which products/services are the most appealing, whether or not customers use the product in the manner anticipated, the purchasing intentions of the market and many others.
Our research methodology encompasses an idyllic combination of primary and secondary initiatives. Key phases involved in this process are listed below:

The phase involves the gathering and collecting of market data and its related information with the help of different sources & research procedures.

The data procurement stage involves in data gathering and collecting through various data sources.
This stage involves in extensive research. These data sources includes:
Purchased Database: Purchased databases play a crucial role in estimating the market sizes irrespective of the domain. Our purchased database includes:
Primary Research: The Brainy Insights interacts with leading companies and experts of the concerned domain to develop the analyst team’s market understanding and expertise. It improves and substantiates every single data presented in the market reports. Primary research mainly involves in telephonic interviews, E-mail interactions and face-to-face interviews with the raw material providers, manufacturers/producers, distributors, & independent consultants. The interviews that we conduct provides valuable data on market size and industry growth trends prevailing in the market. Our organization also conducts surveys with the various industry experts in order to gain overall insights of the industry/market. For instance, in healthcare industry we conduct surveys with the pharmacists, doctors, surgeons and nurses in order to gain insights and key information of a medical product/device/equipment which the customers are going to usage. Surveys are conducted in the form of questionnaire designed by our own analyst team. Surveys plays an important role in primary research because surveys helps us to identify the key target audiences of the market. Additionally, surveys helps to identify the key target audience engaged with the market. Our survey team conducts the survey by targeting the key audience, thus gaining insights from them. Based on the perspectives of the customers, this information is utilized to formulate market strategies. Moreover, market surveys helps us to understand the current competitive situation of the industry. To be precise, our survey process typically involve with the 360 analysis of the market. This analytical process begins by identifying the prospective customers for a product or service related to the market/industry to obtain data on how a product/service could fit into customers’ lives.

Secondary Research: The secondary data sources includes information published by the on-profit organizations such as World bank, WHO, company fillings, investor presentations, annual reports, national government documents, statistical databases, blogs, articles, white papers and others. From the annual report, we analyse a company’s revenue to understand the key segment and market share of that organization in a particular region. We analyse the company websites and adopt the product mapping technique which is important for deriving the segment revenue. In the product mapping method, we select and categorize the products offered by the companies catering to domain specific market, deduce the product revenue for each of the companies so as to get overall estimation of the market size. We also source data and analyses trends based on information received from supply side and demand side intermediaries in the value chain. The supply side denotes the data gathered from supplier, distributor, wholesaler and the demand side illustrates the data gathered from the end customers for respective market domain.

The supply side for a domain specific market is analysed by:
The demand side for the market is estimated through:
In-house Library: Apart from these third-party sources, we have our in-house library of qualitative and quantitative information. Our in-house database includes market data for various industry and domains. These data are updated on regular basis as per the changing market scenario. Our library includes, historic databases, internal audit reports and archives.
Sometimes there are instances where there is no metadata or raw data available for any domain specific market. For those cases, we use our expertise to forecast and estimate the market size in order to generate comprehensive data sets. Our analyst team adopt a robust research technique in order to produce the estimates:
Data Synthesis: This stage involves the analysis & mapping of all the information obtained from the previous step. It also involves in scrutinizing the data for any discrepancy observed while data gathering related to the market. The data is collected with consideration to the heterogeneity of sources. Robust scientific techniques are in place for synthesizing disparate data sets and provide the essential contextual information that can orient market strategies. The Brainy Insights has extensive experience in data synthesis where the data passes through various stages:


Market Deduction & Formulation: The final stage comprises of assigning data points at appropriate market spaces so as to deduce feasible conclusions. Analyst perspective & subject matter expert based holistic form of market sizing coupled with industry analysis also plays a crucial role in this stage.
This stage involves in finalization of the market size and numbers that we have collected from data integration step. With data interpolation, it is made sure that there is no gap in the market data. Successful trend analysis is done by our analysts using extrapolation techniques, which provide the best possible forecasts for the market.
Data Validation & Market Feedback: Validation is the most important step in the process. Validation & re-validation via an intricately designed process helps us finalize data-points to be used for final calculations.

The Brainy Insights interacts with leading companies and experts of the concerned domain to develop the analyst team’s market understanding and expertise. It improves and substantiates every single data presented in the market reports. The data validation interview and discussion panels are typically composed of the most experienced industry members. The participants include, however, are not limited to:
Moreover, we always validate our data and findings through primary respondents from all the major regions we are working on.


Free Customization
Fortune 500 Clients
Free Yearly Update On Purchase Of Multi/Corporate License
Companies Served Till Date