- +1-315-215-1633
- sales@thebrainyinsights.com

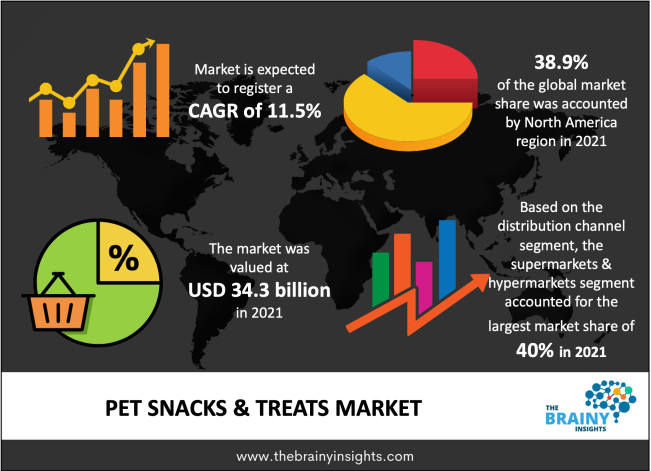
The pet snacks & treats market size was valued at USD 34.3 billion in 2021 and is anticipated to grow at a CAGR of 11.5% from 2022 to 2030. Increasing spending on pet health and nutrition has been driving market growth. According to the American Pet Products Association (APPA), approximately USD 50 billion was spent alone on pet food & treats in the US. The money was spent on pet food including specialty snacks and healthy treats.
The rising number of pets and pet ownership in countries such as the US, Brazil, China, and Russia is driving the demand for pet snacks & treats. According to a Survey conducted by Forbes in February 2022, 78% of pet parents acquired a new pet during the pandemic in the US. Further, the survey also releveled that young pet owner, usually in the age group of 18 to 25 years spend more on their pets. Such trends are likely to have a positive impact on market growth.
According to Alex Douzet, CEO of Pumpkin Pet Insurance, millennial couples in the US first adopt a pet before having kids, as taking care of a pet helps them prepare to become a parent. Further, as most pet owners view their pet as a child or family member, they are preferring best quality of food and other products for their pets. Today, consumers are interested in knowing the types of food available for their dogs and cats and which food will be a healthier option. These trends are likely to boost the market for pet snacks in the coming years.
Get an overview of this study by requesting a free sample
During the covid-19 outbreak, mental stress and loneliness hit many people worldwide. The imposition of lockdown, and restrictions on travel, made meeting friends & family difficult. This resulted in the adoption of pets for companionship, especially among young people, who are living alone. The increased surge in pet adoption, influenced pet food manufacturers to fulfill the growing demand with new pet treats and snacks.
Most of the pet parents were working from home during 2020-2021, thus, spent more time on pet training, which has resulted in the increased consumption of training treats. To support the increasing demand for treats, Wellness Pet Company launched a new rewarding treat- Good Dog in May 2022. These are made with natural ingredients and added vitamins & minerals to support the dog’s health.
Dogs led the market in 2021, accounting for a share of 65.9%. The rising concern among pet owners for premium, natural, and human-quality pet food products including treats are likely to boost the demand. Trends like vegan and cell-based pet treats are also expected to fuel the market growth. For instance, Clif Bar & Company launched vegan jerky treats for dogs in June 2022. The treats are available in Petco stores in three flavors with prices ranging between USD 8 to USD 17.
Cats are anticipated to grow at a higher CAGR of 12.6% during the forecast period. The increasing adoption of cats and focus on their health & wellness is driving the segment growth. Nestlé Purina offers various cat treats & snacks including Friskies Party Mix, which are made from natural ingredients and has added mineral & vitamins for healthy growth. In May 2021, Mars expanded its cat food & treat brand TEMPTATIONS two include new treat formats a creamy puree, and a soft meaty morsel. Such initiatives are likely to bode well for the segment’s growth.
Chewable pet snacks & treats are anticipated to grow at a higher CAGR during the forecast period. To keep the teeth and gums healthy & free from food buildup, dog owners are buying chewable treats for their dogs. The product innovation and launches will bode well for the segment’s growth. For instance, in February 2022, The J.M. Smucker Company Brand Milk-Bone added new crunchy treats- Stacked and Stuffed and chewable- Flavor Twists and Flavor Braids to its portfolio. The Stacked and Stuffed is a crème biscuit with peanut butter, which is available in 10 ounces and 30 ounces for USD 3.79 and USD 9.79 across Walmart. Amazon, and Target.
Eatable accounted for a larger market share of more than 60% in 2021. The wide availability of premium and functional treats & snacks is the major factor for the segment’s dominance. The new product offerings by various small & well-established players are expected to drive market growth in the coming years. In January 2020, Doggy Delirious, the brand of Wet Noses Natural Dog Treat Company, rebranded and launched two new treat flavors that are made from human-grade, natural ingredients, with no added preservatives, and non-GMO. As per the company, rebranding was a necessary step to show pet owners a commitment towards humanization and sustainability.
Supermarkets & hypermarkets accounted for the largest market share of more than 40% in 2021. Increasing varieties of pet food & snacks at various supermarkets & hypermarket is driving sale through this channel. For instance, Cargill’s The Chompery, a dog treat brand product is exclusively sold in the meat aisle of the stores. The Chompery line includes chews, bones, and treats, made from a single ingredient. Moreover, the opening of an innovative concept like pet treat bars is expected to fuel the growth. Firstly, Coles launched a self-service pet treat bar in Melbourne, Australia to make pet parents and their pets happy while shopping at stores.
Online channel is anticipated to grow at the fastest CAGR of 13.1% over the forecast period. The availability of a wide range of products, along with improved browsing experience is fueling the demand through this segment. Further, features such as subscriptions, saving favorite products, hassle-free delivery, and various payment mode are also influencing pet owners to choose an e-commerce platform. Some of the popular e-commerce websites are Amazon, Chewy, Petco, PetFlow, and Zooplus, among others.
North America led the market with a share of 38.9% in 2021. According to the National Pet Owners Survey, 70% of households owned a pet in the US in 2021-2022, an increase of 3% from 2019. Thus, increasing pet adoption has been positively impacting the growth of pet snacks in the region. Moreover, the increasing culture of adopting shelter animals to save their lives has become a common phenomenon owing to rising awareness, which is also likely to influence market growth. Pet owners in this region are seeking a premium, vegan, natural, free-from range of snacks & treats to maintain their overall health.
Central & South America is anticipated to be the fastest-growing region during the forecast period. The rising focus on dogs’ and cats’ health to provide them with balanced nutrition and increasing availability of a wide variety of snacks in the region will bolster the market growth. Increasing awareness among consumers about the issues faced by a pet such as allergies, wet gain, loss of teeth, and tummy infections, is expected to have a positive impact on the demand in the coming years. Moreover, an increase in the spending capacity of consumers in Brazil is likely to change their purchasing decision for pet food.
The pet snacks & treat market consists of a larger number of well-established players such as Nestlé, Mars, The J.M. Smucker Company, and Wellness Pet Company, among others. Companies have been implementing strategies such as product expansion, strengthening online presence, and geographical expansion to stay ahead in the market. Nestlé
Segments Covered in the Report
1. Introduction
1.1. Objectives of the Study
1.2. Market Definition
1.3. Research Scope
1.4. Currency
1.5. Key Target Audience
2. Research Methodology and Assumptions
3. Executive Summary
4. Premium Insights
4.1. Porter’s Five Forces Analysis
4.2. Value Chain Analysis
4.3. Top Investment Pockets
4.3.1. Market Attractiveness Analysis by Pet Type
4.3.2. Market Attractiveness Analysis by Product
4.3.3. Market Attractiveness Analysis by Distribution Channel
4.3.4. Market Attractiveness Analysis by Region
4.4. Industry Trends
5. Market Dynamics
5.1. Market Evaluation
5.2. Drivers
5.2.1. Increasing spending on pet health and nutrition
5.3. Restraints
5.3.1. Allergies with active ingredients can hinder the market growth
5.4. Opportunities
5.4.1. Rise in number of pets and pet ownership
5.5. Challenges
5.5.1. Lack of awareness regarding proper usage of chewable treats
6. Global Pet Snacks & Treats Market Analysis and Forecast, By Pet Type
6.1. Segment Overview
6.2. Dogs
6.3. Cats
6.4. Others
7. Global Pet Snacks & Treats Market Analysis and Forecast, By Product
7.1. Segment Overview
7.2. Eatable
7.3. Chewable
8. Global Pet Snacks & Treats Market Analysis and Forecast, By Distribution Channel
8.1. Segment Overview
8.2. Supermarkets & Hypermarkets
8.3. Specialty Stores
8.4. Online
8.5. Others
9. Global Pet Snacks & Treats Market Analysis and Forecast, By Regional Analysis
9.1. Segment Overview
9.2. North America
9.2.1. U.S.
9.2.2. Canada
9.2.3. Mexico
9.3. Europe
9.3.1. Germany
9.3.2. France
9.3.3. U.K.
9.3.4. Italy
9.3.5. Spain
9.4. Asia-Pacific
9.4.1. Japan
9.4.2. China
9.4.3. India
9.5. South America
9.5.1. Brazil
9.6. Middle East and Africa
9.6.1. UAE
9.6.2. South Africa
10. Global Pet Snacks & Treats Market-Competitive Landscape
10.1. Overview
10.2. Market Share of Key Players in the Pet Snacks & Treats Market
10.2.1. Global Company Market Share
10.2.2. North America Company Market Share
10.2.3. Europe Company Market Share
10.2.4. APAC Company Market Share
10.3. Competitive Situations and Trends
10.3.1. Product Launches and Developments
10.3.2. Partnerships, Collaborations, and Agreements
10.3.3. Mergers & Acquisitions
10.3.4. Expansions
11. Company Profiles
11.1. SCHELL & KAMPETER, INC.
11.1.1. Business Overview
11.1.2. Company Snapshot
11.1.3. Company Market Share Analysis
11.1.4. Company Product Portfolio
11.1.5. Recent Developments
11.1.6. SWOT Analysis
11.2. The J.M. Smucker Company
11.2.1. Business Overview
11.2.2. Company Snapshot
11.2.3. Company Market Share Analysis
11.2.4. Company Product Portfolio
11.2.5. Recent Developments
11.2.6. SWOT Analysis
11.3. Addiction Foods
11.3.1. Business Overview
11.3.2. Company Snapshot
11.3.3. Company Market Share Analysis
11.3.4. Company Product Portfolio
11.3.5. Recent Developments
11.3.6. SWOT Analysis
11.4. Tiernahrung Deuerer GmbH
11.4.1. Business Overview
11.4.2. Company Snapshot
11.4.3. Company Market Share Analysis
11.4.4. Company Product Portfolio
11.4.5. Recent Developments
11.4.6. SWOT Analysis
11.5. Wellness Pet Company
11.5.1. Business Overview
11.5.2. Company Snapshot
11.5.3. Company Market Share Analysis
11.5.4. Company Product Portfolio
11.5.5. Recent Developments
11.5.6. SWOT Analysis
11.6. Mars, Incorporated and its Affiliates
11.6.1. Business Overview
11.6.2. Company Snapshot
11.6.3. Company Market Share Analysis
11.6.4. Company Product Portfolio
11.6.5. Recent Developments
11.6.6. SWOT Analysis
11.7. Spectrum Brands, Inc.
11.7.1. Business Overview
11.7.2. Company Snapshot
11.7.3. Company Market Share Analysis
11.7.4. Company Product Portfolio
11.7.5. Recent Developments
11.7.6. SWOT Analysis
11.8. Cargill
11.8.1. Business Overview
11.8.2. Company Snapshot
11.8.3. Company Market Share Analysis
11.8.4. Company Product Portfolio
11.8.5. Recent Developments
11.8.6. SWOT Analysis
11.9. Affinity Petcare S.A
11.9.1. Business Overview
11.9.2. Company Snapshot
11.9.3. Company Market Share Analysis
11.9.4. Company Product Portfolio
11.9.5. Recent Developments
11.9.6. SWOT Analysis
11.10. Unicharm Corporation
11.10.1. Business Overview
11.10.2. Company Snapshot
11.10.3. Company Market Share Analysis
11.10.4. Company Product Portfolio
11.10.5. Recent Developments
11.10.6. SWOT Analysis
11.11. Blue Buffalo Co., Ltd
11.11.1. Business Overview
11.11.2. Company Snapshot
11.11.3. Company Market Share Analysis
11.11.4. Company Product Portfolio
11.11.5. Recent Developments
11.11.6. SWOT Analysis
11.12. Hill's Pet Nutrition, Inc.
11.12.1. Business Overview
11.12.2. Company Snapshot
11.12.3. Company Market Share Analysis
11.12.4. Company Product Portfolio
11.12.5. Recent Developments
11.12.6. SWOT Analysis
List of Table
1. Global Pet Snacks & Treats Market, By Pet Type, 2019-2030 (USD Billion)
2. Global Dogs Pet Snacks & Treats Market, By Region, 2019-2030 (USD Billion)
3. Global Cats Pet Snacks & Treats Market, By Region, 2019-2030 (USD Billion)
4. Global Others Pet Snacks & Treats Market, By Region, 2019-2030 (USD Billion)
5. Global Pet Snacks & Treats Market, By Product, 2019-2030 (USD Billion)
6. Global Eatable Pet Snacks & Treats Market, By Region, 2019-2030 (USD Billion)
7. Global Chewable Pet Snacks & Treats Market, By Region, 2019-2030 (USD Billion)
8. Global Pet Snacks & Treats Market, By Distribution Channel, 2019-2030 (USD Billion)
9. Global Supermarkets & Hypermarkets Pet Snacks & Treats Market, By Region, 2019-2030 (USD Billion)
10. Global Specialty Stores Pet Snacks & Treats Market, By Region, 2019-2030 (USD Billion)
11. Global Online Pet Snacks & Treats Market, By Region, 2019-2030 (USD Billion)
12. Global Others Pet Snacks & Treats Market, By Region, 2019-2030 (USD Billion)
13. Global Pet Snacks & Treats Market, By Region, 2019-2030 (USD Billion)
14. North America Pet Snacks & Treats Market, By Pet Type, 2019-2030 (USD Billion)
15. North America Pet Snacks & Treats Market, By Product, 2019-2030 (USD Billion)
16. North America Pet Snacks & Treats Market, By Distribution Channel, 2019-2030 (USD Billion)
17. U.S. Pet Snacks & Treats Market, By Pet Type, 2019-2030 (USD Billion)
18. U.S. Pet Snacks & Treats Market, By Product, 2019-2030 (USD Billion)
19. U.S. Pet Snacks & Treats Market, By Distribution Channel, 2019-2030 (USD Billion)
20. Canada Pet Snacks & Treats Market, By Pet Type, 2019-2030 (USD Billion)
21. Canada Pet Snacks & Treats Market, By Product, 2019-2030 (USD Billion)
22. Canada Pet Snacks & Treats Market, By Distribution Channel, 2019-2030 (USD Billion)
23. Mexico Pet Snacks & Treats Market, By Pet Type, 2019-2030 (USD Billion)
24. Mexico Pet Snacks & Treats Market, By Product, 2019-2030 (USD Billion)
25. Mexico Pet Snacks & Treats Market, By Distribution Channel, 2019-2030 (USD Billion)
26. Europe Pet Snacks & Treats Market, By Pet Type, 2019-2030 (USD Billion)
27. Europe Pet Snacks & Treats Market, By Product, 2019-2030 (USD Billion)
28. Europe Pet Snacks & Treats Market, By Distribution Channel, 2019-2030 (USD Billion)
29. Germany Pet Snacks & Treats Market, By Pet Type, 2019-2030 (USD Billion)
30. Germany Pet Snacks & Treats Market, By Product, 2019-2030 (USD Billion)
31. Germany Pet Snacks & Treats Market, By Distribution Channel, 2019-2030 (USD Billion)
32. France Pet Snacks & Treats Market, By Pet Type, 2019-2030 (USD Billion)
33. France Pet Snacks & Treats Market, By Product, 2019-2030 (USD Billion)
34. France Pet Snacks & Treats Market, By Distribution Channel, 2019-2030 (USD Billion)
35. U.K. Pet Snacks & Treats Market, By Pet Type, 2019-2030 (USD Billion)
36. U.K. Pet Snacks & Treats Market, By Product, 2019-2030 (USD Billion)
37. U.K. Pet Snacks & Treats Market, By Distribution Channel, 2019-2030 (USD Billion)
38. Italy Pet Snacks & Treats Market, By Pet Type, 2019-2030 (USD Billion)
39. Italy Pet Snacks & Treats Market, By Product, 2019-2030 (USD Billion)
40. Italy Pet Snacks & Treats Market, By Distribution Channel, 2019-2030 (USD Billion)
41. Spain Pet Snacks & Treats Market, By Pet Type, 2019-2030 (USD Billion)
42. Spain Pet Snacks & Treats Market, By Product, 2019-2030 (USD Billion)
43. Spain Pet Snacks & Treats Market, By Distribution Channel, 2019-2030 (USD Billion)
44. Asia Pacific Pet Snacks & Treats Market, By Pet Type, 2019-2030 (USD Billion)
45. Asia Pacific Pet Snacks & Treats Market, By Product, 2019-2030 (USD Billion)
46. Asia Pacific Pet Snacks & Treats Market, By Distribution Channel, 2019-2030 (USD Billion)
47. Japan Pet Snacks & Treats Market, By Pet Type, 2019-2030 (USD Billion)
48. Japan Pet Snacks & Treats Market, By Product, 2019-2030 (USD Billion)
49. Japan Pet Snacks & Treats Market, By Distribution Channel, 2019-2030 (USD Billion)
50. China Pet Snacks & Treats Market, By Pet Type, 2019-2030 (USD Billion)
51. China Pet Snacks & Treats Market, By Product, 2019-2030 (USD Billion)
52. China Pet Snacks & Treats Market, By Distribution Channel, 2019-2030 (USD Billion)
53. India Pet Snacks & Treats Market, By Pet Type, 2019-2030 (USD Billion)
54. India Pet Snacks & Treats Market, By Product, 2019-2030 (USD Billion)
55. India Pet Snacks & Treats Market, By Distribution Channel, 2019-2030 (USD Billion)
56. South America Pet Snacks & Treats Market, By Pet Type, 2019-2030 (USD Billion)
57. South America Pet Snacks & Treats Market, By Product, 2019-2030 (USD Billion)
58. South America Pet Snacks & Treats Market, By Distribution Channel, 2019-2030 (USD Billion)
59. Brazil Pet Snacks & Treats Market, By Pet Type, 2019-2030 (USD Billion)
60. Brazil Pet Snacks & Treats Market, By Product, 2019-2030 (USD Billion)
61. Brazil Pet Snacks & Treats Market, By Distribution Channel, 2019-2030 (USD Billion)
62. Middle East and Africa Pet Snacks & Treats Market, By Pet Type, 2019-2030 (USD Billion)
63. Middle East and Africa Pet Snacks & Treats Market, By Product, 2019-2030 (USD Billion)
64. Middle East and Africa Pet Snacks & Treats Market, By Distribution Channel, 2019-2030 (USD Billion)
65. UAE Pet Snacks & Treats Market, By Pet Type, 2019-2030 (USD Billion)
66. UAE Pet Snacks & Treats Market, By Product, 2019-2030 (USD Billion)
67. UAE Pet Snacks & Treats Market, By Distribution Channel, 2019-2030 (USD Billion)
68. South Africa Pet Snacks & Treats Market, By Pet Type, 2019-2030 (USD Billion)
69. South Africa Pet Snacks & Treats Market, By Product, 2019-2030 (USD Billion)
70. South Africa Pet Snacks & Treats Market, By Distribution Channel, 2019-2030 (USD Billion)
List of Figures
1. Global Pet Snacks & Treats Market Segmentation
2. Pet Snacks & Treats Market: Research Methodology
3. Market Size Estimation Methodology: Bottom-Up Approach
4. Market Size Estimation Methodology: Top-Down Approach
5. Data Triangulation
6. Porter’s Five Forces Analysis
7. Value Chain Analysis
8. Global Pet Snacks & Treats Market Attractiveness Analysis by Pet Type
9. Global Pet Snacks & Treats Market Attractiveness Analysis by Product
10. Global Pet Snacks & Treats Market Attractiveness Analysis by Distribution Channel
11. Global Pet Snacks & Treats Market Attractiveness Analysis by Region
12. Global Pet Snacks & Treats Market: Dynamics
13. Global Pet Snacks & Treats Market Share by Pet Type (2022 & 2030)
14. Global Pet Snacks & Treats Market Share by Product (2022 & 2030)
15. Global Pet Snacks & Treats Market Share by Distribution Channel (2022 & 2030)
16. Global Pet Snacks & Treats Market Share by Regions (2022 & 2030)
17. Global Pet Snacks & Treats Market Share by Company (2021)
Segments Covered in the Report
Research has its special purpose to undertake marketing efficiently. In this competitive scenario, businesses need information across all industry verticals; the information about customer wants, market demand, competition, industry trends, distribution channels etc. This information needs to be updated regularly because businesses operate in a dynamic environment. Our organization, The Brainy Insights incorporates scientific and systematic research procedures in order to get proper market insights and industry analysis for overall business success. The analysis consists of studying the market from a miniscule level wherein we implement statistical tools which helps us in examining the data with accuracy and precision.
Our research reports feature both; quantitative and qualitative aspects for any market. Qualitative information for any market research process are fundamental because they reveal the customer needs and wants, usage and consumption for any product/service related to a specific industry. This in turn aids the marketers/investors in knowing certain perceptions of the customers. Qualitative research can enlighten about the different product concepts and designs along with unique service offering that in turn, helps define marketing problems and generate opportunities. On the other hand, quantitative research engages with the data collection process through interviews, e-mail interactions, surveys and pilot studies. Quantitative aspects for the market research are useful to validate the hypotheses generated during qualitative research method, explore empirical patterns in the data with the help of statistical tools, and finally make the market estimations.
The Brainy Insights offers comprehensive research and analysis, based on a wide assortment of factual insights gained through interviews with CXOs and global experts and secondary data from reliable sources. Our analysts and industry specialist assume vital roles in building up statistical tools and analysis models, which are used to analyse the data and arrive at accurate insights with exceedingly informative research discoveries. The data provided by our organization have proven precious to a diverse range of companies, facilitating them to address issues such as determining which products/services are the most appealing, whether or not customers use the product in the manner anticipated, the purchasing intentions of the market and many others.
Our research methodology encompasses an idyllic combination of primary and secondary initiatives. Key phases involved in this process are listed below:

The phase involves the gathering and collecting of market data and its related information with the help of different sources & research procedures.

The data procurement stage involves in data gathering and collecting through various data sources.
This stage involves in extensive research. These data sources includes:
Purchased Database: Purchased databases play a crucial role in estimating the market sizes irrespective of the domain. Our purchased database includes:
Primary Research: The Brainy Insights interacts with leading companies and experts of the concerned domain to develop the analyst team’s market understanding and expertise. It improves and substantiates every single data presented in the market reports. Primary research mainly involves in telephonic interviews, E-mail interactions and face-to-face interviews with the raw material providers, manufacturers/producers, distributors, & independent consultants. The interviews that we conduct provides valuable data on market size and industry growth trends prevailing in the market. Our organization also conducts surveys with the various industry experts in order to gain overall insights of the industry/market. For instance, in healthcare industry we conduct surveys with the pharmacists, doctors, surgeons and nurses in order to gain insights and key information of a medical product/device/equipment which the customers are going to usage. Surveys are conducted in the form of questionnaire designed by our own analyst team. Surveys plays an important role in primary research because surveys helps us to identify the key target audiences of the market. Additionally, surveys helps to identify the key target audience engaged with the market. Our survey team conducts the survey by targeting the key audience, thus gaining insights from them. Based on the perspectives of the customers, this information is utilized to formulate market strategies. Moreover, market surveys helps us to understand the current competitive situation of the industry. To be precise, our survey process typically involve with the 360 analysis of the market. This analytical process begins by identifying the prospective customers for a product or service related to the market/industry to obtain data on how a product/service could fit into customers’ lives.

Secondary Research: The secondary data sources includes information published by the on-profit organizations such as World bank, WHO, company fillings, investor presentations, annual reports, national government documents, statistical databases, blogs, articles, white papers and others. From the annual report, we analyse a company’s revenue to understand the key segment and market share of that organization in a particular region. We analyse the company websites and adopt the product mapping technique which is important for deriving the segment revenue. In the product mapping method, we select and categorize the products offered by the companies catering to domain specific market, deduce the product revenue for each of the companies so as to get overall estimation of the market size. We also source data and analyses trends based on information received from supply side and demand side intermediaries in the value chain. The supply side denotes the data gathered from supplier, distributor, wholesaler and the demand side illustrates the data gathered from the end customers for respective market domain.

The supply side for a domain specific market is analysed by:
The demand side for the market is estimated through:
In-house Library: Apart from these third-party sources, we have our in-house library of qualitative and quantitative information. Our in-house database includes market data for various industry and domains. These data are updated on regular basis as per the changing market scenario. Our library includes, historic databases, internal audit reports and archives.
Sometimes there are instances where there is no metadata or raw data available for any domain specific market. For those cases, we use our expertise to forecast and estimate the market size in order to generate comprehensive data sets. Our analyst team adopt a robust research technique in order to produce the estimates:
Data Synthesis: This stage involves the analysis & mapping of all the information obtained from the previous step. It also involves in scrutinizing the data for any discrepancy observed while data gathering related to the market. The data is collected with consideration to the heterogeneity of sources. Robust scientific techniques are in place for synthesizing disparate data sets and provide the essential contextual information that can orient market strategies. The Brainy Insights has extensive experience in data synthesis where the data passes through various stages:


Market Deduction & Formulation: The final stage comprises of assigning data points at appropriate market spaces so as to deduce feasible conclusions. Analyst perspective & subject matter expert based holistic form of market sizing coupled with industry analysis also plays a crucial role in this stage.
This stage involves in finalization of the market size and numbers that we have collected from data integration step. With data interpolation, it is made sure that there is no gap in the market data. Successful trend analysis is done by our analysts using extrapolation techniques, which provide the best possible forecasts for the market.
Data Validation & Market Feedback: Validation is the most important step in the process. Validation & re-validation via an intricately designed process helps us finalize data-points to be used for final calculations.

The Brainy Insights interacts with leading companies and experts of the concerned domain to develop the analyst team’s market understanding and expertise. It improves and substantiates every single data presented in the market reports. The data validation interview and discussion panels are typically composed of the most experienced industry members. The participants include, however, are not limited to:
Moreover, we always validate our data and findings through primary respondents from all the major regions we are working on.


Free Customization
Fortune 500 Clients
Free Yearly Update On Purchase Of Multi/Corporate License
Companies Served Till Date